


 Inglés (pdf)
 Articulo en XML
 Referencias del artículo
 Enviar articulo por email
 Citado por SciELO
  Citado por Google
  Similares en
SciELO
Similares en
SciELO  Similares en Google
 Permalink
1. Introduction
Type 1 Diabetes Mellitus (T1DM) is a chronic disease that impairs the functionality of glucose homeostasis. It is implicated in important morbidity and mortality rates worldwide, and its incidence grows at a rate of 3-5% per year [1]. It is estimated that about 6% of the world’s population suffers from diabetes mellitus (DM), and in 2005 there were 1.1 million deaths associated with it. It is important to note that, according to one study, almost 80% of deaths from diabetes occur in low and middle-income countries [2]. In fact, Colombia, located in the Latin American region, has 3 million people with DM [3]. This represents an 8% prevalence. In rural areas, this figure falls to less than 2%, the disparity due to factors mainly associated with urbanization. The cities stand out for having high rates of obesity, a factor associated with the disease. In Colombia, DM is among the top 5 causes of death, and its morbidity is also considered high, due to its treatment occupying a greater proportion of the hospital network, which places DM in fourth place. Therefore, DM generates significant economic cost overruns for Colombia's national public health system [3].
New treatments for T1DM are focused on the development of the Artificial Pancreas (PA). This is a system composed of several control algorithms that emulate the natural functioning of the pancreas, supplying the correct dose of insulin to regulate glucose levels through the use of a subcutaneous insulin pump. The PA calculates the correct dose from the feedback it receives based on interstitial glucose measurements obtained from Continuous Glucose Monitoring sensors. With great advances in medical instrumentation, the development of the PA has provoked great interest worldwide. Nevertheless, it has not yet been possible to propose a set of algorithms that adequately solve the different problems that have arisen, mainly, how to eliminate hypoglycemic and hyperglycemic episodes when insulin levels are disturbed [4,5].
These types of problems have been the focus of most treatments since the beginnings of the development of the PA. For instance, in [6], the authors proposed the use of an MPC controller with asymmetric costs to perform glycemic control. They validated the controller through in silico tests and clinical trials with patients in their homes. In [7], an advanced Proportional-Integral-Derivative (PID) control system was proposed for patients with T1DM in intensive care. The control system is a PID and based on the concept of expert systems, the design of the PID controller employs rules conceived using controller dynamics according to the measurement of blood glucose values.
In fact, it has been established that PID and MPC controllers are the most applied control strategies in T1DM. Reference [8] compares the performances of an MPC and a PID. The analysis shows that the MPC strategy has an equal or better performance than the PID controller, the MPC having the longest mean time in the normoglycemic zone (70-180 mg/dl) and the PID the lowest (74.4 Vs 63.7 %). The mean glucose level for the MPC strategy is less than the PID (181 Vs 220 mg/dl). Although different control proposals are found in the literature [9,10], there are certain problems that are still considered to be open topics, including insulin overdose, for which the application of pure PID control has not been successful. Also, there are factors to be taken into account such as the effect of plant-model mismatch, meals (unannounced or estimated incorrectly), parameter variations due to hormonal changes such as the dawn phenomenon, exercise, stress and external factors. Furthermore, automatic individualization of the controller for different patients in order to reduce the need for medical staff and patients to have expert knowledge of these technologies is still a challenge.
In this paper, the performance and robustness of two glycemic control algorithms are examined. The first controller is based on the analysis of positivity in the state space and the control action. For this, a controller K+PID is proposed which is composed of a combination of the control by feedback of states and a new positive PID. The K represents state feedback which assures the state/input positivity trajectories [11,12]. For the PID, a representation in state space of the PID is developed that also respects positivity constraints. This form of control action is analyzed along with the state space of the model to obtain a guarantee of positivity in the states and control action’s trajectories. The second controller proposed here is a predictive control that targets a particular zone with impulsive control action (iZMPC) [13,14]. For this case, an impulse scheme is shown to manage the insulin injections as impulses, and obtains a more accurate representation than that of clinical practice. The iZMPC handles positivity through its optimization constraints. For both strategies the Kalman filter is applied to reconstruct the non-measurable states. These control strategies are evaluated with a cohort of 50 virtual patients taken from [15] and the UVa / Padova simulator approved by the Food and Drug Administration (FDA) of the United States, which serves as a substitute for clinical trials with animals.
These strategies’ performances are evaluated in interaction with unannounced meal disturbances, plant-model mismatch, hypo and hyperglycemic events and the percentage of time inside and outside the normoglycemic zone. First, an index is proposed to evaluate the performance of the two strategies. Second, a robustness analysis is performed. Three of the most important physiological parameters, sensitivity to insulin, CHO sensitivity factor, and average endogenous production, change during the simulation time. The sensitivity of the control strategies against parameter variations affects robustness, leading to a risk of hyper and hypoglycemia.
Additionally, the control-variability grid analysis (CVGA) is used to evaluate the performance of closed-loop controllers for a specific cohort of T1DM patients obtained from the metabolic simulator approved by the FDA (Food and Drug Administration) of The United States. This method allows for the visualization of the extreme (maximum and minimum) excursions of glucose caused by a control algorithm in a group of subjects, each represented by a point for any given observation period. The iZMPC controller is inside the normoglycemic zone 98.13 % of the time compared to 93.29% of the time for the K+PID controller. Also, the K+PID controller presents less excursions into the A zone in the CVGA matrix as well as the biggest performance index.
The rest of the paper is organized as follows: Section 2 describes the characteristics of the selected model for T1DM. Section 3 presents the PID control approach. Section 4 outlines the model predictive controller by target zones and impulsive control action. Section 5 presents the Kalman observer used for state estimation. Section 6 includes the results of the performance and robustness analysis and its validation using the T1DMS Metabolic Simulator software (FDA approved). Finally, Section 7 presents the conclusions and recommendations for future study in this field.
2. Model for T1DM patients
In the literature, different models have been presented to represent glucose-insulin dynamics [17-19]. In [15], a model based on functional insulin therapy (FIT) is proposed that has shown good acceptance rates in clinical practice. The main characteristics of the model are good long-term prediction and the introduction of equilibrium points and parameters with clear physiological significance. In this paper a modified version of the model presented in [15] is used. Its realization in the state space is as follows:

The proposed model presents five state variables and five parameters. Where x 1 (t) represents glycemia (mg/dl), x 2 and x 3 is the insulin subsystem (x 2 represents the plasma insulin and x 3 represents the subcutaneous insulin). Similarly, a second order model is used to represent the increase of blood glucose concentration due to the absorption of carbohydrates (x 4 represents the plasma carbohydrates and x 3 the digestion of carbohydrates). A detailed description of the state variables of this model is shown in Table 1.

The blood glucose dynamics consist of the model’s first differential equation in eq. (1). It defines the glycemic variation and isdependent on: i) the levels plasma insulin, ii) the absorption of carbohydrates through digestion; and iii) the affine term representing the difference between the endogenous production of glucose by the liver (EGP) and the constant insulin independent consumption of glucose by the brain (θ 1).
The relationship between insulin infusions and insulinemia are derived from pharmacokinetics and insulin dynamics [15]. Insulin dynamics is calculated by a second order model with a time constant (θ 3) and the insulin sensibility factor (θ 2). Similarly, a second order model is used to represent the increase in glucose due to the absorption of carbohydrates (time constant θ 5 and sensibility factor θ 4). A summary of the parameters, their description and units is given in Table 2.

3. Positive PID controller approach
3.1. Positive state feedback
Glucose-insulin dynamics, as well as the large majority of biological processes, should not take negative values. However, this model would allow that to happen, so a controller that guarantees the control objectives and therefore the positivity of the states and the inputs, is developed theoretically. To simplify the analysis the input is considered as continuous.
To develop the controller, the following definitions are taken into account:
A linear system given by eq. (1) is considered, then system (1), is called internally positive if for every  ,
,  , the state
  and output trajectories
 , for any t ≥ 0.
For the system (1), the nonempty set  is a positively invariant set (PIS) if
  implies
 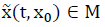 for any t > 0.
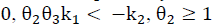
If  , then M (G) denotes the polyhedron

Then, the polyhedral set M(G) is a positively invariant set for the system (8), if and only if there exists a Metzler matrix H ∈  (r×r), i.e. Hij ≥0 for i≠j, such that:

Notice if A is Metzler, the positive orthant  is PIS.
Note that the subsystems x 2-x 3, and x 4-x 5 have their positive octants as PIS. That is, these subsystems are positive; and are therefore more in line with physiology.
To ensure that model states and their inputs always remain in the positive region of the space of states, the conditions that a feedback of states must fulfill are analyzed based on the first three differential equations of the model (1) and the physiological characteristics of the states. For this analysis, the following state feedback is considered:

which generates the following characteristic polynomial:

The first condition of stability, according to the Routh-Hurwitz criterion, is such that all the coefficients of the polynomial (5) must be positive, which means that:

The second condition of stability is:

For the positivity of input/state solution considers 
 , and the set:

Then, the maximum PIS of the system (7) with feedback (11) i

Eq. (9) can be stated if it is considered Eq. (3) on the system with the polyhedron and the H matrices:
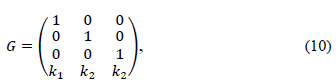
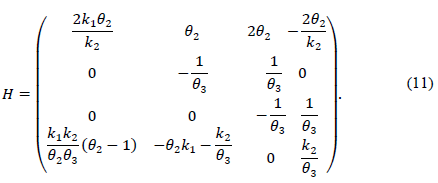
Note that the conditions k 2 > 0 and θ 2 θ 3 k 1 > -k 2 not only ensure that H is Metzler (i.e., H 14, H 41 y H 42 are positive), but also that the roots of the polynomial (5) are negative and real. This is because its discriminant,

is greater than zero. Also, it can be verified that the second stability condition given by eq. (7) is automatically fulfilled as illustrated in Fig. 1, in which the feasible region for the parameters k 1 and ?? 2 is shown, where the positivity of solutions is assured.
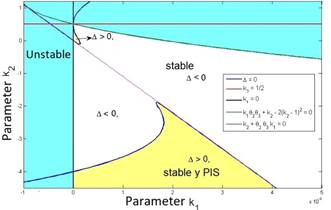
The yellow zone represents the region of stable and positive conditions, while the white zone solely represents the stable region. The system’s stable zone is characterized by the parametric equations obtained from the Routh-Hurwitz criterion (eq. 6-7), while the positive zone is obtained from Eq. (9) by performing a pole placement analysis of the characteristic polynomial given by Eq. (5).
3.2. Designing PID in state space with input positivity constraint
This section outlines a PID control strategy in the state space form. In this way, the control output integrated with the model in eq. (1) is analyzed, along with the conditions that guarantee the positivity of the state space of the glucose-insulin subsystem and the control action. The design of this strategy considers that, for patients applying insulin, the control rejects the effect of meals and also regulates within the normoglycemic zone during fasting periods ( 70 ≥ x1 140 ≤ mg/dl).
Considering a PID type controller of the form:

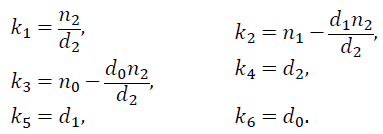
Where e (s) represents the dynamics of the error expressed as y - yref and u (s) is the PID control output. The controller in eq. (13) can be expressed as:
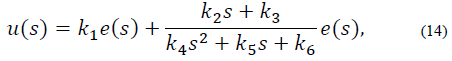
with
For the second term of eq. (14), artificial states are proposed such that
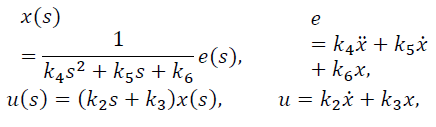
Let p1 =x and p2 =x, and so the system can be expressed as:
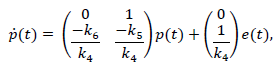
Finally, considering the first term of eq. (14), the output of the PID controller (13) can be expressed as:

3.3. PID with the glucose-insulin subsystem
The glucose-insulin subsystem is a composition of the first three state variables of model (1) and insulin input u(t). Hence, it is considered that r(t) =0 and the states x4 - x5 are not taken into account. Therefore, the glucose-insulin subsystem can be expressed as:

Bearing in mind that y ref is a constant value, it should be taken into account that the dynamic of error is equal to the dynamic of the output, in this case x1. Considering the control action in eq. (15), the system can be rewritten as
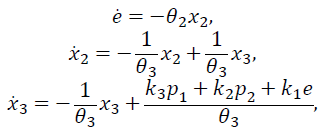
and expressed in matrix form as
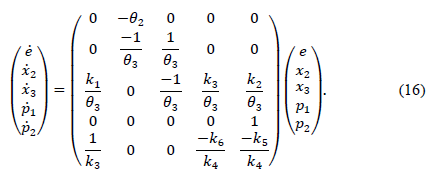
Definition A has the dynamic matrix of eq. (16). It should be noted that the subsystems x2 -x3, and p1-p2 have their positive octants as PIS. That is, the dynamic insulin subsystem has a natural positivity and the dynamic p- subsystem can be tuned using the controller variables in order to guarantee its positivity. Regarding the positive criterion (corollary 1), it is important to note that it is equivalent to a placement analysis of the root of the characteristic polynomial of the matrix A (poly(A)). In fact, a similar process is used to obtain the positivity conditions through the fulfillment of the Routh-Hurwitz criterion and the discriminant. Both criterions must be complied so that the roots remain real and negative, without an imaginary part [11,12].
The control proposed here is composed of a combination of state feedback control and positive PID. In the first instance, the feedback control is responsible for bringing the patient into the normoglycemia zone, and in the second, the PID is responsible for rejecting any disturbances when the patient is already in this zone or beforehand, if the disturbance appears before the patient enters the normoglycemia zone. Disturbances due to food intake are detected using the CGM signal. In this way, a switch between the controllers is made when an increase of more than 10 mg / dl in the glucose values is detected, within a time window of 20 minutes. In this way, when using the K + PID strategy, the user does not need to enter details of the time and value of their meals into the computation.
4. MPC strategy for blood glucose control
This section outlines a zone targeting MPC strategy that is extended for impulsive systems, and compares it with a standard MPC as well as the previous controller, in terms of its performance and robustness according to its application. The design of the strategies takes into account impulsive control inputs while satisfying state and input constraints [20]. Blood glucose is regulated in the normoglycemic zone, calculated by 70 ≤ x1 ≤ 140 mg/dl. Furthermore, these strategies could be used at any time of the day, during fasting periods or when ingesting a meal. Currently, blood glucose is regulated with injections and for those patients who use an insulin pump, insulin is delivered in periodic pulses, small enough to be considered as impulses. Therefore, this assumption that considers the injections as impulses seems to be more suited in practice for the treatment of diabetic patients.
4.1. Impulsive discrete system
An impulsive discretization of the system in eq. (1) is carried out in order to position control inputs as impulses. The following continuous time system in state space form is taken into consideration:

Let u (similarly  ) be the impulsive input such that
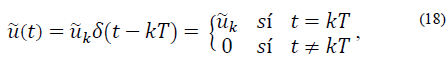
evaluating the continuous system state at sample time instants given by t = (k + 1)T, then

Now the discrete time model is
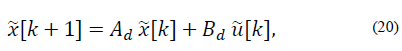
Where Ad = eAT and Bd= EAT B.
4.2. Impulsive zone targeting MPC strategy
The main goal for zone targeting MPC is to steer the system to target zone and keep the system inside of it for as long as possible. In general, MPC generates an optimal control trajectory  which minimizes a quadratic cost function and only the first input u0
0 is injected into the system. In this section, a zone targeting MPC for impulsive systems is presented that steers glycemic levels from an initial state to zone 𝛿 using a tracking reference [20]. This approach has been studied before with some modifications in [13,14,21].
which minimizes a quadratic cost function and only the first input u0
0 is injected into the system. In this section, a zone targeting MPC for impulsive systems is presented that steers glycemic levels from an initial state to zone 𝛿 using a tracking reference [20]. This approach has been studied before with some modifications in [13,14,21].
The impulsive discrete system in (20) should be considered with,  as the constrained state and input respectively.
  isthe controlled output,
  the tracking reference and δ є
  defines the zone around
  The quadratic cost function of the optimization problem to be solved by the MPC every time sample is given by [20]:

where,

with N as the prediction horizon, this being the term that penalizes the predicted output trajectory ( ) and input trajectory (
 ) so that it stays inside the target zone. Q >0 and R >0 penalize the outputs and inputs respectively with respect to an equilibrium (
 ). The term

with P > 0, represents the final cost and forces the outputs to reach an equilibrium (or target zone) at the end of the horizon. Then, the optimization problem that solves the MPC at every instant k is given by:

It should be noted that δ is an additional constrained decision variable, where δmax is the parameter that defines the maximum value for the zone around  . In this case, A and B are the impulsive discrete matrices calculated in eq. (20) for predictions.
5. Kalman observer for discrete systems
The first state variable (glycemia) is the only measurable variable. For this reason, both strategies need an observer to estimate the remaining state variables. Consequently, a Kalman observer is designed for impulsive systems.
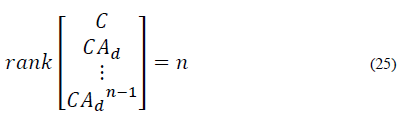
The discrete time system for predictions in eq. (20) should be considered. The system must satisfy the observability criteria for impulsive systems [22]. The system is observable if and only if:
The discrete Kalman observer takes the following form:

The observer gain and the estimated states are obtained through prediction and correction. The correction is made using the measurement update equations:
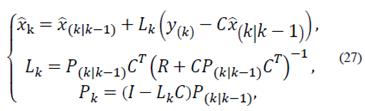
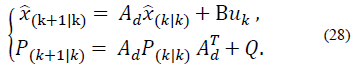
Finally, the prediction is made using the time update equations:
6. In silico: virtual patient results
This section presents a comparison of the control strategies’ performance, developed in consideration of the rejection of disturbances caused by unannounced meals, the percentage of time inside and outside the normoglycemic zone, hypo and hyperglycemic events, CVGA metrics and a performance index that is proposed for the evaluation of the general performance of the strategies. In addition, both control strategies are assessed in the UVa/Padova Simulator for the average adult patient.
6.1. Virtual scenario
The performance of the control strategies is tested with a 1-day virtual protocol. Each patient is assigned a starting level of hypoglycemia (180 mg / dl) at 00 hours, the control loop is closed at this time. 3 meals are ingested, spaced as follows: a breakfast of 40g at 7am, a lunch of 50g at 12pm and a dinner of 70g at 8pm. The virtual scenario ends after 24h.
6.2. Performance
Table 3 shows the performance comparison between the previous control strategies and a standard impulsive MPC for the 50 virtual patients. As shown, the iZMPC has the highest percentage of time inside the normoglycemic zone and the lowest percentage of time in hypo or hyperglycemia. As expected, the MPC strategies need more computation time than the PID.
Performance indices are a quantitative measure of the system response. For this application, hyperglycemic episodes after meal intake are not as dangerous as hypoglycemic episodes due to overestimation of insulin doses. As a result of this, a performance index is proposed in order to penalize blood glucose concentration outside of the normoglycemic zone. The index is multiplied by higher values when x1 lies within hypoglycemia. The index is given by:
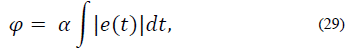
where,
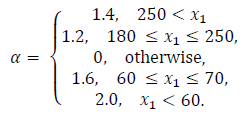
In Table 3 the mean of the index in eq. (29) for the 50 virtual patients is given. It is important to note that the performance index for iMPC is bigger than that of iZMPC, this is because of short episodes where blood glucose rises above 180 (mg/dl). Therefore, it is beneficial to use MPC strategies based on its performance, assuming that no plant-model mismatch is proven. Thus, the impulsive zone MPC strategy seems to perform best.

In Fig. 2, the CVGA is used to compare the performance of both controllers in the 50 virtual patients. Table 4 shows the CVGA summary outcome. The iZMPC controller manages to maintain the correct glycemic control in all patients (A+B zone). The PID controller achieves a correct glycemic control in 48 patients, and an acceptable control for 2 patients (C zone).


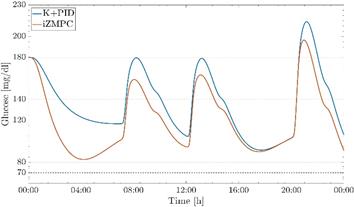
The proposed control strategies have a good performance against plant-model mismatch as shown in the preclinical test in the UVa/Padova T1DMS metabolic simulator, Fig. 3. The simulator has a highly non-linear model to accurately represent a patient with T1DM, in addition to representing the dynamics present in commercial insulin pumps and CGM devices. The performance of both controllers is validated using the same scenario presented in section 5.1, measurements of the CGM sensor and a generic insulin pump are taken into account. It can be observed that in this pre-clinical trial, both controllers manage to maintain normoglycemic values despite the disturbances of food intake.
6.3. Robustness
The robustness of control strategies depends on the accuracy of the model describing the plant. Type 1 diabetes mellitus patients tend to be affected by external disturbances that the model used here for the control design normally does not take into account. In this section, the previous control strategies are evaluated for scenarios of plant-model mismatch due to parameter variations. First, parameter variations are justified by means of a physiological analysis of external disturbances affecting glucose regulation.
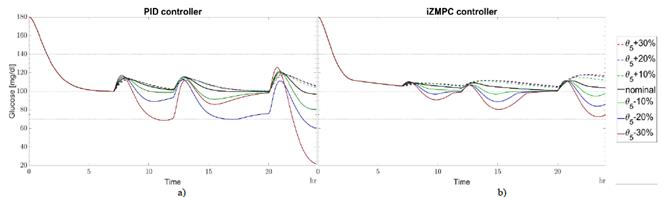
Let θ 2real , θ 3real , and θ 5real be the parameters related to insulin sensitivity, insulin time action and carbohydrates time action in the real plant, respectively. When θ 2real is greater than θ2, the patient is less resistant to insulin action. Here, the controller is expected to be able to reduce insulin doses to avoid hypoglycemia. On the other hand, when θ 2real is less than θ2 and the patient is more resistant to insulin action, the controller should increase insulin doses to avoid hyperglycemia. Changes in insulin sensitivity are produced because of physical activity (increases insulin sensitivity) and dawn phenomenon (reduces insulin sensitivity) [23,24].
Fig. 4 shows the variations in a day for θ 2real with respect to θ2. The sensitivity for the iZMPC strategy is higher than for PID due to incorrect predictions. Here, MPC strategies tend to overestimate or underestimate insulin doses causing hypo and hyperglycemia. The blood glucose concentration for the PID strategy lies inside the normoglycemic zone and could handle higher variations in this parameter.

Source: Authors.
Figure 4 Variations in θ2real w.r.t. θ2 for a) PID and b) izMPC. Black line for nominal parameters. Green dotted line for +10% variation, green continuous line for -10%. Blue dotted line for +20% variation, blue continuous line for -20%. Red dotted line for +30% variation, red continuous line for -30%.
The type of insulin, the place of the injection, the temperature, age of patient, and other medications all produce changes in θ3 [25]. When θ 3real is greater than θ3, insulin absorption occurs slowly. When insulin remains from previous boluses increases, the patient requires less insulin to avoid accumulation and a subsequent hypoglycemic episode. Otherwise, insulin absorption is fast and no insulin remains. In this case, the patient needs more insulin to avoid hyperglycemia events. The strategies are less sensitive to variations in θ 3real with respect to θ3 as shown in Fig. 5. The PID and iZMPC are more sensitive when θ 3real tends to increase, leading to a risk of hypoglycemia. Slow carbs need less insulin to absorb glucose for energy. When θ 5real is greater than θ5, carbohydrates are digested easily, then, the blood glucose concentration tends to increase rapidly, and the insulin needed should increase to avoid hyperglycemia [26]. Moreover, when θ 5real is less than θ5 carbohydrates need more time to be digested. Then, blood glucose concentration increases slowly, requiring less insulin to be injected. In this case, in Fig. 6, the PID strategy is more sensitive when θ 5real tends to decrease with respect to θ5, leading to hypoglycemia. MPC strategies are less sensitive to variations in this parameter. it should be noted that for these cases, the iZMPC can handle higher variations than the PID.

Source: Authors.
Figure 5 Variations in θ 3real w.r.t. θ3 for a) PID and b) izMPC. Black line for nominal parameters. Green dotted line for +10% variation, green continuous line for -10%. Blue dotted line for +20% variation, blue continuous line for -20%. Red dotted line for +30% variation, red continuous line for -30%.
Source: Authors.
Figure 6 Variations in θ 5real w.r.t. θ 5 for a) PID and b) izMPC. Black line for nominal parameters. Green dotted line for +10% variation, green continuous line for -10%. Blue dotted line for +20% variation, blue continuous line for -20%. Red dotted line for +30% variation, red continuous line for -30%.
7. Conclusions and future study
This paper addressed the design of fundamental algorithms for blood glucose regulation for patients with type 1 diabetes mellitus. An affine model composed of five state variables and five parameters was used to represent the glucose-insulin dynamic and carbohydrate absorption. For this model, two strategies were developed.
The first is a state space PID which has the conditions to guarantee positivity of the state variables and control action. The second strategy is an extended zone targeting model predictive controller for impulsive systems.
In general terms, the algorithms accomplish the objective of steering the blood glucose concentration into the normoglycemic zone under realistic conditions, modelling impulsive input and unannounced meals. Furthermore, the strategies presented are a contribution to control theory, especially the PID in state form and the extension of the zone targeting MPC with impulsive systems for these kinds of application.
The control strategies were evaluated using a simulation with data from 17 real patients collected by the Nantes University Hospital, France [15] and 33 virtual patients from the UVa/Padova simulator. In terms of performance, both strategies avoid hypoglycemic events completely and respond quickly to unannounced meal intake, reducing postprandial hyperglycemic events. Additionally, a standard impulsive MPC was added to the comparison in order to establish the advantages and disadvantages of using an iZMPC instead of a standard one.
The addition of the slack variable δ as a decision variable increases the computation time. However, the use of the iZMPC reduces unnecessary injections when reaching the reference glucose value and will stop delivering insulin once the normoglycemic zone is reached.
Despite eliminating hypoglycemic events, the PID strategy spends more time in postprandial hyperglycemic periods and thus a higher performance index. Nevertheless, this strategy is less sensitive to plant-model mismatch when parameters associated with insulin sensitivity and insulin time action are affected by external disturbances, causing parameter variations. The benefit of using a PID controller as opposed to the iZMPC, is that the latter will present feasibility problems if plant-model mismatch increases. The results of the controller behavior are in accordance with the physiological justification found in the literature.
Embedded artificial pancreas systems have computational limitations. Therefore, the PID controller presents more benefits due to its faster computation time.
Nevertheless, the computation time of the iZMPC controller is still within the acceptable range for these types of biomedical applications. Sampling time in artificial pancreas systems is usually between 5-15 minutes.
The control strategies are presented as an initial approach to solving some of the existent problems in artificial pancreases. However, good results from the simulation allow for an improvement in the development of theory and the possibility of clinical validation. For future studies, more realistic scenarios should be considered. Furthermore, robust characteristics should be studied to avoid, in theory, hypoglycemic events due to parameter variations and plant-model mismatch.

