


 Inglés (pdf)
 Articulo en XML
 Referencias del artículo
 Enviar articulo por email
 Citado por SciELO
  Citado por Google
  Similares en
SciELO
Similares en
SciELO  Similares en Google
 Permalink
1. Introduction
From industry experience and laboratory tests, it is a common knowledge that most operations performed in a well have an impact on its productivity and in most cases may become a representative source of formation damage. Acid stimulation jobs and their associated chemicals are not an exemption of this, and the consequences may vary from wettability changes, secondary precipitations, incompatibilities between formation and treatment fluids up to insoluble asphaltene-like solid deposits. Considering the demand of this type of operations in Colombia as an option to improve production or injection rates, it is important to recognize additive’s nature and the influence of the acid system itself as they may compromise formation’s integrity and therefore the purpose of the job.
During acid stimulation treatments, it is highly possible that acid-sludge aggregates appear, they are recognized as acid or oil insoluble products [1] originated from interactions between treatment fluids and some sorts of crude oils [2]. These insoluble particles can be present as a stable emulsion, solids, or a combination of both [2] and they are deeply associated to asphaltenic components present in crude oils, which are normally in colloidal state, and that are mainly destabilized by low pH environments once they are exposed to the acid treatment [2]. However, there are some other factors associated to sludge occurrence including but not limited to acid type or strength, presence of Ferric or Ferrous ions, mutual solvents, acid corrosion inhibitors [3] and as mentioned, chemical structure of crude oil [4].
Different acid systems have been tested with a wide range of formation fluids to find the appropriate treatment to prevent sludge precipitates and additionally fit customer needs. Some studies showed acid strength impact on the amount of sludge and the inability of typical anti-sludgging additives to control it with moderate quantities of them [5]. On the opposite side, high dosifications of these addtives might end in reverse emulsions considering iron complexes and non-emulsisfying agents [5]. At then end sludgging tendencies persisted and possible solutions went around reducing inorganic acid strenght, appropriate selection of corrosion inhibitors and organic acid implementation instead [4] which in essence changes the nature of the acid system.
Despite of these findings, when it comes to testing procedures, there are a few more challenges to solve such us: additives compatibility, cleaner sands in detergency tests and short emulsion break times. This work presents a methodology to evaluate different combinations of anti-sludge agents, iron-control additives, and surfactants at varied concentrations in two different acid systems (Hydrochloric-Hydrofluoric acid componund each) and review their performance throughout multiple laboratory tests while a quantitative evaluation of acid sludge is carried out based on API RP 42 regulations keeping as the primary targets no acid sludge and emulsion prevention.
It is not the intent of this publication to explain how sludge forms and what the main causes of it are, that information can be in previous investigations, some of them referenced within this document. Rather, this study focuses on testing different chemical blends as options to enhance existing stimulation fluids, while providing an insight into different acid sludge formation conditions throughout several experimental tests. It is our intention to support a better chemical selection and treatment optimization when designing acid systems for formations highly sensitive to sludge production.
2. Experimental evaluations
2.1. Background
To begin with, as crude oil components and sample age are part of the multiple factors influencing sludge-forming tendencies [2,6], experimental tests were conducted as soon as the sample focus of this study was received in the laboratory. The first step was fluid characterization including BSW, API gravity and asphaltene content measurements as shown in Table 1.
Table 1 Oil sample characterization.
| Sample | °API | % Water (Vol) | % Sediment (Mass) | % Asphaltene (Mass) |
|---|---|---|---|---|
| Crude oil #1 | 25.02 | 0.25 | <1 | 22.33 |
Source: The authors.
Previous laboratory work with different oil samples from the same field object of this study ended in long emulsion break times with different tensioactive agents and severe acid induced sludge occurrence with oil API gravities between 16-25 degrees and asphaltene content from 15 to 45% [6] under iron influence [7]. Considering those facts, iron contaminated (3000 ppm Fe+3) compatibility test was the core analysis as in past researching studies [6].
At that time fluids were evaluated mainly in a 50/50 proportion of acid contaminated with 3000 ppm of Iron (III) chloride versus crude oil, these previously mixed over 30 seconds and then heated at reservoir temperature for a maximum test period of 60 minutes, monitoring every 10 minutes emulsion break progress. Once emulsion was fully broken, the mixture was poured through a 100-mesh screen where solids or sludge presence was qualitative classified as no sludge, trace, moderate or heavy sludge as A.P.I recommended practice 42 suggests [8]. In addition to this, any solids left in the screen were gently rinsed with 250 ml of warm water and 150 ml of aliphatic solvent to remove emulsions and paraffins but not acid induced sludge, all in accordance with the mentioned recommended practice.
Aligned with this experimental background and A.P.I RP 42 a couple of variations were introduced for this study. First, to have an idea of sludge forming trend when introducing a new additive or varying its concentration in the acid system, the same 50/50 proportion was evaluated but the weight of crude oil precipitates was recorded after each test (eq.1) to quantitative classify increase or decrease tendencies. Sludge present on the mesh, once cleaned as previously explained (warm water + solvent), was softly dried by mesh’s underside with a paper towel and then heated in the laboratory oven at test temperature (180 °F) for 1 or 2 minutes before proceeding to weight the remnant.

2.2. Preliminary compatibility tests
With the formerly outlined protocol, sludge and emulsion break tests were performed between previously field-used HCl-HF formulations at two different concentrations versus the oil sample object of this study.
2.2.1. Surfactant selection
Tensioactive agent selection for long emulsion break times was the initial test and covered Iron contaminated (Fe III) compatibility testing (as previously explained) of 15% HCl- 1.1%HF (F1) and 6.5% HC l - 1% HF (F2) samples, including two different non-ionic surfactants (S1 & S2) at different concentrations: 1 gallon per thousand gallons (gpt) - low concentration- and 4 gpt - high concentration-. See results in Table 2.
Table 2 Surfactant selection for F1 & F2.
| Acid System | Sludge Weight (gr) | Emulsion Break % | Emulsion Break Time (min) |
|---|---|---|---|
| F1-S1-1 gpt | 8.814 | 80 | 60 |
| F1-S2-4 gpt | 9.361 | 0 | 60 |
| F2-S1-1 gpt | 0.30 | 100 | 50 |
| F2-S2-4 gpt | 0.50 | 90 | 60 |
Source: The authors.
Considering results from Table 2, S1-1 gpt was the most suitable surfactant for both acid formulas in terms of less sludge amount weighed and higher emulsion break percentage within an hour test period or less than that.
2.2.2. Anti-sludge agent incorporation in F1 & F2
Two different anti-sludge agents (AS) were tested with both acid samples and selected surfactant. The first one, called AS-1, tested from 10-30 gpt and the second one AS-2, from 20-60 gpt, Fig 1 (left) illustrates F1-S1-1 gpt compatibility test results without any AS incorporation.
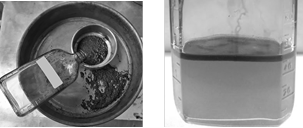
One of the findings at this experimental stage was, how acid corrosion inhibitor affected sludging tendency in presence of ferrous/ferric ions [9] and also how its ionic charge influenced acid blend dispersion as seen in Fig 1 (right). Based on that, each formulation containing either AS-1 or AS-2, was tested with and without corrosion inhibitor (CI) to quantify how much it impacted precipitates production.
Table 3 illustrates for F1 (15% HCl- 1.1%HF) how sludge weight decreased around 20% at different AS1 concentrations even though emulsion break remained around 80% comparing to base scenario in Table 2 (F1-S1-1 gpt). Additionally, it is important to highlight, how corrosion inhibitor incremented more than 40%, in most cases, aggregates magnitude when using AS1 additive.
Table 3 Anti-sludge agent selection for F1.
| Acid System | Sludge Weight (gr) | Emulsion Break % | Emulsion Break Time (min) |
| F1-AS1-10 gpt-CI | 6.63 | 80 | 60 |
| F1-AS1-10 gpt | 5.50 | 80 | 60 |
| F1-AS1-20 gpt-CI | 7.23 | 80 | 60 |
| F1-AS1-20 gpt | 4.58 | 95 | 60 |
| F1-AS1-30 gpt-CI | 6.53 | 82 | 60 |
| F1-AS1-30 gpt | 1.12 | 100 | 60 |
| F1-AS2-20 gpt-CI | 3.39 | 100 | 20 |
| F1-AS2-20 gpt | 4.10 | 100 | 30 |
| F1-AS2-50 gpt-CI | 1.05 | 90 | 60 |
| F1-AS2-50 gpt | 0.04 | 100 | 10 |
| F1-AS2-60 gpt-CI | 2.6 | 80 | 60 |
| F1-AS2-60 gpt | 4.46 | 82 | 60 |
Source: The authors.
In case of F1-AS2, it had relatively best performance than AS1, decreasing precipitates weight (around 70%) and increasing emulsion break percentage within the first 60 minutes of test with regards to initial scenario (Table 2 - F1-S1-1 gpt.). However, this additive also suffered effects from CI incorporation in compatibility testing. At the end F1-AS1 at 30 gpt and F1-AS2 at 50 gpt, both with CI, continued the process as they were considered the most representative results based on the initial guidelines for this study and the nature of the sandstone stimulation fluids.
F2 evaluation (6.5% HCl - 1% HF) was to some extent faster than F1. First, compatibility testing was executed only with AS1 as it had positive results in a very straightforward way. AS1 concentration was increased in 10 gpt steps and as a quick response at 50 gpt there was no sludge on the mesh (see Table 4) additionally emulsion break times were drastically reduced from 45 to 10 minutes. Second, CI incorporation in this acid formula did not have as much impact as in F1, therefore, all tests were performed with it.
Table 4 Anti-sludge agent selection for F2.
| Acid System | Sludge Weight (gr) | Emulsion Break % | Emulsion Break Time (min) |
|---|---|---|---|
| F2-AS1-30 gpt-CI | 0.1 | 100 | 10 |
| F2-AS1-40 gpt-CI | 0.013 | 100 | 7 |
| F2-AS1-50 gpt-CI | 0 | 100 | 5 |
Source: The authors.
Even though, there was a quick response from AS1 in F2, as seen in Fig 2, a few more challenges arose at this stage for it. One of them was a negative detergency test result, which led to run a couple of compatibility test more varying surfactant agent and mutual solvent concentrations.

It is important to highlight that one of the main parameters which affects sludge reactions, apart from formation fluid nature and iron presence, is acid strength [7], that may change typical anti-sludge agents ability to control precipitates production [9]. In retrospect, that is the biggest difference between both acid systems, where F2 is almost half concentration of F1. However, these two stimulation treatments, with corrosion inhibitor and the mentioned acid strengths are part of the stimulation jobs essence and therefore this study continued with proposed concentrations, focusing on an optimal solution to face these challenges.
2.2.3. Iron control additives incorporation in F1
From previous section, AS1 at 30 gpt and AS2 at 50 gpt were considered optimum concentrations to reduce sludge tendencies in F1. However, they did not stop these unwanted reactions at all, as in F2. For that reason, iron control additives inclusion was the next step with F1, considering that Fe+3 highly promotes sludge in presence of strong acids and asphaltenic oils [4].
From this moment forward, F1 is redefined considering either AS1 at 30 gpt or AS2 at 50 gpt and research continued including them and then varying concentrations of citric acid as iron sequestering agent (IS) and erythorbic acid as ferric-iron inhibitor (FI). Table 5 resumes experimental test results obtained from additional compatibility tests and shows that most favorable concentration for IS and FI was 50 pounds per thousand gallons (ppt) initially.
Table 5 Iron control additives selection for F1-AS1.
| Acid System | Sludge Weight (gr) | Emulsion Break % | Emulsion Break Time (min) |
|---|---|---|---|
| F1-AS1-30 gpt-CI | 6.53 | 82 | 60 |
| F1-50 ppt IS-50 ppt FI | 0 | 100 | 20 |
| F1-0 ppt IS-50 ppt FI | 3 | 100 | 50 |
| AS1-50gpt-50 ppt FI | 0 | 100 | 20 |
Source: The authors.
Once more, this study focused in two main things, one was sludge problems mitigation and the other one was additives optimization. Based on that and acknowledging cost/benefit relationship, iron sequestering agent was removed and a few more tests were completed increasing AS1 concentration up to 50 gpt and surfactant 1 (S1) concentration by 1 gpt, looking for emulsion break percentage and time improvements. As seen in Fig. 3 (right), the results were self-evident, there was a 100 % improvement avoiding sludge reactions, emulsion was fully broken, and even better, breaking-time was reduced around 70% (AS1-50 gpt - 50 ppt FI - Table 5). Fig. 3 (left) illustrates sludging tendency without iron control additives incorporation.

With AS2 the same procedure was followed, and the results are shown in Table 6. Even though a zero-sludge outcome was not succeeded, weight of reactions was drastically decreased around 98%, emulsion test was fully broken and even faster than in AS1 representing a time reduction of 85%.
2.2.4. Detergency test & mutual solvents effects in F1 & F2
First project complexity from real life considered at this stage, was the fact that once acid treatment contacted formation surface, part of the additives could be adsorbed onto the surface rock, and they would not be able to perform their designed function [10], minimum chemical adsorption is considered nowadays an essential part of treatment success [11]. The second aspect was additive’s nature and their sociated ionic strength changes that could impact things like wettability properties and acid blend homogeneity.
With that in mind, a third test was contemplated to assess cleaning capacity of surfactant present in acid blends as well as its implementation effects on the surface of the test sand and therefore be able to verify adverse visual wettability changes. The cleaner de sand (free of oil traces) the better the detergency test results and the lesser adverse effects of additives inclusion in wettability properties.
F2 detergency test results observed in Fig. 4 (left) showed possible consequences of the previous stated factors and based on that, surfactant 1 (S1) concentration was increased in 1 gpt steps while at the same time it was combined with a new non-ionic tensioactive agent (S2) incorporated with concentration increments using the same approach as in S1. Mutual solvent concentration was reduced (from 20 to 10 gpt) as different studies support that, in combination with sandstone stimulation fluids it reduced adsorption of surfactant on silica surfaces and improved acid/oil emulsion separation and somehow sand cleanliness or detergency tests [10].

As a result of the previously mentioned solution, there was an important oil phase removal from solids surface as seen in Fig 4 (right) and it was possibly attributed to interfacial or surface tension reductions between fluids and/or sand sample which contributed in some degree to sand cleanliness. Mutual solvent concentration was finally set back as originally designed for F2, considering that its change in concentration was not as representative in detergency test result as expected.
In summary, Table 7 shows additives included and optimized in F2 throughout this study considering prevention of unwanted sludge reactions, optimum emulsion break times and percentages (100% in less than an hour) and non-oil phase wettability results:
Table 7 Final formulation for F2.
| Additive | Concentration | Units |
|---|---|---|
| Anti-Sludge Agent 1 | 50 | gpt |
| Corrosion Inhibitor | 5 | gpt |
| Mutual Solvent | 20 | gpt |
| Surfactant 1 | 1 | gpt |
| Surfactant 2 | 2 | gpt |
Source: The authors.
F1 essentially exhibited almost the same detergency test results as in F2, after AS agent and FI inclusion, which was also attributed to the factors mentioned at the beginning of this section, Fig.5 (left). The standard procedure to solve the problem included: firstly, decrements in concentration of the mutual solvent 1 (MS1) initially implemented, in 10 gpt steps, from 50 to 10 gpt and secondly, testing a second mutual solvent (MS2) also at 10 gpt. Both mutual solvents had nearly the same performance in individually compatibility testing and removed most of oil phase as seen in Fig. 5 (right).

As well as in F2, Table 8 shows additives summary for F1 included and optimized throughout this study considering prevention of unwanted sludge reactions, optimum emulsion break times and percentages (100% in less than an hour) and non-oil phase wettability results:
2.3. Final compatibility test results
Once sludge reactions, emulsion break issues and detergency differences became a challenge addressed (sections 2.2.2 & 2.2.3), full compatibility testing was performed for both acid systems (F1 & F2) with selected crude oil sample, that included emulsion break test in 80/20, 50/50 and 20/80 proportions of oil/live-acid, interfacial tension measurement, visual wettability test & finally oil versus acid spent with formation sand test.
2.3.1. F1 Final evaluation: AS1 & MS1
Full emulsion break was observed in 20/80 and 50/50 proportions after 15 minutes of contact between live acid and crude oil at reservoir temperature following API RP-42 procedures [8]. 80/20 compatibility took five more minutes for full phase separation even though live acid took a grey dark coloration. In general, the three proportions broke in less than the expected test time (< 60 minutes) and there was no evidence of incompatibilities or precipitates formed during the test (Fig. 6). Additionally, there was a possible ionic charge balance between all additives as there was no acid blend separation as seen previously seen in Fig. 1 (right).

Next test was acid spent with formation sand, allowing chemical solution to remain in contact with solids for at least 24 hours [8], (simulating sandstone stimulation scenario). 50/50 proportion of spent system with test sand & oil sample fully broke in 15 minutes without any noticeable incompatibilities or solids as seen in Fig 7.

For visual wettability test, F1 acid blend including surfactant was placed in a 50 ml bottle with 10 cm3 of test sand [8]. Then, after 30 minutes of soaking time, apart in a test tub with 50 ml of aliphatic solvent and 50 ml of water, test sand was slowly sifted allowing it to fall through both phases [8]. In this case, sand showed tendency to form clumps in organic phase while it relatively dispersed in aqueous phase, that lead to conclude that particles were water wet after contacting acid solution.
Las but not least, interfacial tension measurement with duNouy tensiometer - Ring Method [8] was 0.392 mN/m (MS1), which was lesser than expected for this study (top limit 2.0 mN/m in accordance with previous studies managing same acid blends and oil samples from the same field object of this work). Table 9 presents a summary of F1 results for this study.
Table 9 Final compatibility test results for F1.
| Compatibily Test type | Comments |
|---|---|
| 20/80 - 50/50 proportions | Zero sludge, 100 % emulsion break in 15 minutes |
| 80/20 proportion | Zero sludge, 100 % emulsion break in 20 minutes |
| Acid + Iron Chloride Fe III (3000 ppm) & Acid spent - Formation sand | Zero sludge, 100 % emulsion break in 20 minutes |
| Visual Wettability test | Water wet |
| System Homogeneity | 100% - No liquid phase separation |
| Detergency | Sand with a few oil traces |
| IFT (mN/m) | 0.392 |
Source: The authors.
2.3.2. F2 Final Evaluation: AS1 & MS2
For F2, compatibility testing in 20/80 and 50/50 proportions showed full emulsion break in less time than test time in F1, taking only 12 minutes to achieve the desired point. 80/20 compatibility took five more minutes for full
phase separation and as well as in F1, the three proportions broke in less than 20 minutes. There was no evidence of incompatibilities or precipitates formed during the test. Even though, there was no acid blend separation because of additive’s polarity, 20/80 and 50/50 proportions also took a dark grey coloration which initially looked like absence of emulsion breaking as seen in Fig. 8.

50/50 proportion of spent system (with formation sand) & oil sample fully broke after 25 minutes in contact at test temperature (180 °F) without any noticeable incompatibilities. For visual wettability test, the same F1 procedure was applied but this time sand showed tendency to form clumps in both organic and aqueous phases. It is important to highlight that this is a methodology for qualitatively determining the wetting tendencies of surface-active agent solutions (acid blends) [8]. However, immediate degrees of wetting features are not easily characterized [8] as in this case. As well as in F1, duNouy tensiometer - Ring Method [8] was implemented obtaining 0.03 mN/m. Table 10 presents a summary of F2 results for this study.
Table 10 Final compatibility test results for F2.
| Compatibily Test type | Comments |
|---|---|
| 20/80 - 50/50 proportion | Zero sludge, 100 % emulsion break in 10 minutes |
| 80/20 proportion | Zero sludge, 100 % emulsion break in 15 minutes |
| Acid + Iron Chloride Fe III (3000 ppm) & Acid spent - Formation sand | Zero sludge, 100 % emulsion break in 10 minutes |
| Acid spent - Formation sand | Zero sludge, 100 % emulsion break in 25 minutes |
| Visual Wettability test | Mix wettability |
| System Homogeneity | 100% - No liquid phase separation |
| Detergency | Sand with oil traces |
| IFT (mN/m) | 0.03 |
Source: The authors.
3. Conclusions
Acid induced sludge become severe in presence of iron dissolved particles (Fe III - 3000 ppm) and some sort of crude oils, especially those with API gravities between 16-25 degrees and asphaltene content from 15 to 45%.
A higher concentration of non-ionic surface-active agent does not mean a higher emulsion break percentage in less time.
The higher the inorganic acid concentration the worst it becomes sludging tendency in presence of iron dissolved particles and some sort of crude oils at 180 °F (15% HCl- 1.1%HF (F1) and 6.5% HCl - 1% HF (F2))
Acid corrosion inhibitor affected sludging tendencies in presence of ferrous/ferric ions and its ionic charge influenced acid blend dispersion.
Ferric iron inhibitor in combination with an anti-sludge agent relatively mitigated sludge forming tendencies in presence of Fe+3, strong acids and asphaltenic oils.
Detergency tests allowed to track cleaning capacity of surfactant present in acid blends as well as other additives implementation effects on wettability properties.
Mutual solvents somehow helped reducing adsorption of additives on silica surfaces, improved acid/oil emulsion separation and sand cleanliness for better detergency tests results.
Increasing anti-sludge agent 2 concentrations did not guarantee a major control of sludging tendency, instead from 60 gpt it showed considerable weight increments of it and therefore less control of sludge precipitates.

