


 Inglés (pdf)
 Articulo en XML
 Referencias del artículo
 Enviar articulo por email
 Citado por SciELO
  Citado por Google
  Similares en
SciELO
Similares en
SciELO  Similares en Google
 Permalink
INTRODUCCIÓN
Celecoxib (CLX, chemical name: 4-[5-(4-Methylphenyl)-3-(trifluoromethyl)-1H-pyrazol-1-yl]benzenesulfonamide, CAS number: 184007-95-2, formula: C17H14 F3N3O2S, molar mass: 381.37 g mol-1, molecular structure shown in figure 1) is a COX-2 selective nonsteroidal anti-inflammatory drug, widely used in the treatment of osteoarthritis, rheumatoid arthritis, familiar adenomatous polyposis and acute pain. When CLX is co-administrated with chemotropic agents in cancer treatment protocols, it has shown preventive activity in colon carcinogenesis, ultraviolet B radiation (UVB) induced skin cancer and breast cancer. CLX can be categorized as class II drugs (poor solubility in water and high gastrointestinal permeability) [1-3].

Solubility analysis of drug molecules in solvent mixtures is becoming increasingly important in the chemical industry of drug design and manufacture. The solubility range comprised among 288.15-308.15 K, it is particularly important because it includes the physiological temperature and temperature changes that are the most usual during storage to prevent precipitation of the solute. Ethanol-water and ethanol-ethyl acetate mixtures cover a wide range of the solubility parameter scale from ethyl acetate (δ 1 = 18.48 MPa1/2) to water (δ 1 = 47.86 MPa1/2) and have been used to study the solubility behaviour in a relatively wide polarity range and to determine the solubility parameters of solid solutes [4-7].
In this paper the solubilities of CLX have been measured between 288.15 K and 308.15 K, to extend the database on experimental solubility for CLX, and as well, to evaluate the effect of the cosolvent composition on solubility and dissolution thermodynamics of CLX in both mixtures solvents. To study the influence of cosolvents, it has been used thermodynamic relationships with some other drugs and cosolvent systems [8-11].
The thermodynamic magnitudes of solution and transfer were obtained to corroborate earlier findings about whether enthalpy-entropy compensation is a general effect for the solubility of drugs in solvent mixtures.
MATERIALS AND METHODS
Materials
CLX was supplied from Laboratorios Normon (Madrid, Spain; with purity of at least 0.990 in mass fraction) it was used as received. All solvents used were of analytical grade. Binary compositions were prepared by volume, 0-100% water - ethanol (Panreac, Monplet, Barcelona, Spain, ethanol absolute, CAS N° 64-17-5) and 0-100 % ethanol-ethyl acetate (Panreac, Monplet, Barcelona, Spain, 99.5%, CAS N° 141-78-6), using double distilled water and Durapore® filters (0.45 µm, Millipore Corp; Darmstadt, Germany).
Methods
Solubility determination
Stoppered glass flasks were prepared adding a small excess of solute to the solvent mixtures, then they were placed into a thermostatized bath (±0.1°C) (HETO® Type SBD50-1 bio. 501828H, Paris, France) shaking continuously at constant highest temperature to obtain the equilibrium of solubility. Furthermore, ultrasonic bath (Branson® B-3200E. C119/86, Urdorf, Switzerland) was used to accelerate the process to attain the saturation. Previously, the dissolution curves of amount dissolved versus time were created to identify the time necessary to achieve the equilibrium in water, ethanol and ethyl acetate (8-10 days).
Once reached the equilibrium, samples of the saturated solutions were filtered (Durapore® membranes 0.45 mm pore size; Darmstadt, Germany) and diluted with ethanol absolute. The concentrations were determined in a single beam spectrophotometer (Agilent® 61030AX, CA, United States) at λmax=253 nm. The densities of the solutions were measured at each temperature in 10-mL pycnometers, to convert the molar solubility into mole fraction units. All the experimental results were the average of at least three replicated experiments, with a coefficient of variation [CV = (SDX2/X2)x100] lower than 5% except in a few measures that were underestimated.
Differential scanning calorimetry (DSC)
The heat and temperature of fusion were measured from differential scanning calorimetry, DSC, (DSC 3 Mettler Toledo, Spain) operating with software version StarE 14. The analysis was performed at a heating rate of 10°C/min, from 30 °C to 300 °C, under nitrogen flow (20 mL/min). Samples were accurately weighed (about 3 mg) into aluminium pan and then the pan was sealed with a corresponding lid. The DSC analysis was performed on the original powders and on several solid phases at equilibrium with their cosolvent mixtures ratios at the lowest temperature. The solid phases were retained on filter papers and the solvent excess was evaporated at room temperature until constant weight to avoid alterations or induce polymorphic changes. The equipment was calibrated using indium as standard [12].
Fourier transform infrared spectroscopy (FTIR)
Fourier transform IR spectra (FTIR) were examined over the scanning range of 5004000 cm-1 using a Spectrum 2000 spectrometer (Perkin Elmer, CT, United States). The resolution was 1 cm-1. The spectra were recorded for CLX and for the same solid phase at equilibrium selected for DSC with their cosolvent-ethanol ratios at the lowest temperature. Samples of around 3 mg were mixed with 297 mg of potassium bromide and gently ground in an agate mortar. The samples were analysed from disks of about 5 mm diameter prepared with potassium bromide and compressed in a hydrostatic press at a force of10 T for 10 secs.
RESULTS AND DISCUSSION
Characterization of the solid state and solubility properties of the original powders: DSC and FTIR studies
All characterization studies were performed in triplicate. Original powder shows an only endothermic effect related to melting point (see table 1, figure 2). The onset and the heat of fusion of single event of CLX Form I were T F=162.68 °C and ΔHF=98.64 J/g. The flat baseline suggested that no phase transitions or excess solvent content was present prior to initial melting. This agrees with previous published results [13]. In this work the onset is used because it is not influenced by mass. The thermograms of the solid phase after equilibrium with the saturated solutions did not differ from that found for the original powder, in all cases, exhibiting curves similar to crystalline celecoxib with identical values of melting points and heats of fusion. It is observed an identical profile indicating solvent mixtures do not induce solid phase changes such as polymorphism or solvates. The literature makes broad reference to polymorphism for CLX [8, 14-15]. It has been identified several polymorphic forms called Forms I, II and III whose melting points are 163.0 °C, 161.5 °C and 160.9 °C, respectively. Form III is a thermodynamically stable crystal at ambient conditions. A new solid form (Form IV) of CLX was prepared in the presence of Polysorbate 80 and hydroxypropyl methylcellulose (HPMC) [16], with an onset at 145-148 °C, which was around 12-15 °C less than the identified melting points of Forms I, II and III. On the other hand, it has been observed the relation between molecular mobility and tendency of the amorphous celecoxib to recrystallize. Grzybowska et al. [17] show that the structural relaxation seems to be responsible for devitrification of celecoxib if stored at room temperature (293 K). It exists a large interest in controlling crystallization in the pharmaceutical industry.
Table 1 Temperature (T F ) and enthalpy of fusion (DH F ) of the CLX and the solid phase equilibrated with saturated solutions in pure solvents.
| Solvent | T F (°C) | DH F (J/g) |
|---|---|---|
| CLXRaw Material | 162.67 | 99.73 |
| CLXWater | 161.55 | 105.41 |
| CLXEthanol | 162.54 | 97.41 |
| CLXEthyl acetate | 162.75 | 97.00 |
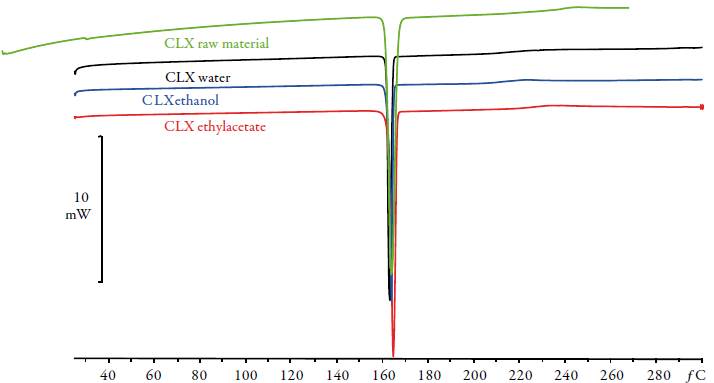
Figure 2 DSC thermograms of CLX and solid phases after equilibrium with pure solvents: water (black), ethanol (blue) and ethyl acetate (red).
FTIR spectroscopies allowed exploring the differentiation in molecular conformations for distinguish polymorphic forms. The FT-IR absorption spectrum (see figure 3) conforms to publish CLX Form I with distinctive peaks at 3340 cm-1 and 3233 cm-1 for the symmetric and asymmetric N-H stretch vibration of the sulphonamide group. The FTIR spectra also showed a characteristic S=O symmetric and asymmetric stretching at 1164 cm-1 and 1347 cm-1, respectively [9, 13, 16]. The results observed by FTIR analysis indicates that the solid phases of CLX after equilibrium with each saturated solution in the different solvent mixtures employed remained unchanged; it agreed with the DSC results.

Relationship between drug polarity and the solubility profile
The experimental mole fraction solubility is included in tables 2-3 at the temperature range studied (288.15-308.15 K). Figure 4 shows the solubility profiles, as a function of the polarity of the binary liquid systems, expressed by their solubility parameters of Hildebrand (δ 1) and covering a wide polarity range from 18.49 MPa1/2 for ethyl acetate to 47.86 MPa1/2 for water. Solubility increases with temperature in aqueous and the non-aqueous mixture indicating that the dissolution process is endothermic. CLX exhibits one maximum at δ 1 = 22.50 MPa1/2 (50% ethanol in ethyl acetate), this value does not change with temperature. This suggests that the overall polarity is mainly responsible for the solubility changes. Solubility profiles with a single peak (usually in ethanol-ethyl acetate) were related to less polar drugs with lower solubility parameters [18, 19].
Table 2 Mole fraction solubility of CLX in ethanol + water mixtures at several temperatures and local atmospheric pressure of 950 hPa.
| Cosolventa | 288.15 K | 293.15 K | 298.15 K | 303.15 K | 308.15 K |
|---|---|---|---|---|---|
| 0.00 | 1.77 x 10⁻⁸ | 2.36 x 10⁻⁸ | 2.72 x 10⁻⁸ | 3.16 x 10⁻⁸ | 3.65 x 10⁻⁸ |
| 0.10 | 5.09 x 10⁻⁸ | 5.97 x 10⁻⁸ | 7.00 x 10⁻⁸ | 9.07 x 10⁻⁸ | 1.01 x 10⁻⁷ |
| 0.20 | 4.71 x 10⁻⁷ | 6.41 x 10⁻⁷ | 8.17 x 10⁻⁷ | 1.12 x 10⁻⁶ | 1.37 x 10⁻⁶ |
| 0.30 | 1.62 x 10⁻⁶ | 1.94 x 10⁻⁶ | 2.26 x 10⁻⁶ | 2.82 x 10⁻⁶ | 3.69 x 10⁻⁶ |
| 0.40 | 1.07 x 10⁻⁵ | 2.16 x 10⁻⁵ | 2.95 x 10⁻⁵ | 4.32 x 10⁻⁵ | 5.92 x 10⁻⁵ |
| 0.50 | 8.63 x 10⁻⁵ | 1.24 x 10⁻⁴ | 1.60 x 10⁻⁴ | 2.23 x 10⁻⁴ | 2.93 x 10⁻⁴ |
| 0.60 | 3.08 x 10⁻⁴ | 4.09 x 10⁻⁴ | 5.47 x 10⁻⁴ | 7.86 x 10⁻⁴ | 1.01 x 10⁻³ |
| 0.70 | 9.16 x 10⁻⁴ | 1.19 x 10⁻³ | 1.48 x 10⁻³ | 2.12 x 10⁻³ | 2.75 x 10⁻³ |
| 0.80 | 2.10 x 10⁻³ | 2.79 x 10⁻³ | 3.62 x 10⁻³ | 5.16 x 10⁻³ | 6.76 x 10⁻³ |
| 0.90 | 5.42 x 10⁻³ | 6.82 x 10⁻³ | 8.50 x 10⁻³ | 1.06 x 10⁻² | 1.30 x 10⁻² |
| 1.00 | 9.34 x 10⁻³ | 1.07 x 10⁻² | 1.25 x 10⁻² | 1.62 x 10⁻² | 2.00 x 10⁻² |
a is the volume fraction of ethanol in the ethanol + water mixtures free of CLX.
Table 3 Mole fraction solubility of CLX in ethanol + ethyl acetate mixtures at several temperatures and local atmospheric pressure of 950 hPa.
| Cosolventa | 288.15 K | 293.15 K | 298.15 K | 303.15 K | 308.15 K |
|---|---|---|---|---|---|
| 0.00 | 9.34 x 10⁻³ | 1.07 x 10⁻² | 1.25 x 10⁻² | 1.62 x 10⁻² | 2.00 x 10⁻² |
| 0.10 | 1.74 x 10⁻² | 2.12 x 10⁻² | 2.44 x 10⁻² | 3.13 x 10⁻² | 3.82 x 10⁻² |
| 0.20 | 2.78 x 10⁻² | 3.23 x 10⁻² | 3.63 x 10⁻² | 4.08 x 10⁻² | 4.91 x 10⁻² |
| 0.30 | 3.58 x 10⁻² | 4.02 x 10⁻² | 4.53 x 10⁻² | 5.38 x 10⁻² | 6.18 x 10⁻² |
| 0.40 | 4.60 x 10⁻² | 5.40 x 10⁻² | 5.91 x 10⁻² | 7.00 x 10⁻² | 8.08 x 10⁻² |
| 0.50 | 6.16 x 10⁻² | 6.89 x 10⁻² | 7.61 x 10⁻² | 8.69 x 10⁻² | 0.102 |
| 0.60 | 7.04 x 10⁻² | 7.60 x 10⁻² | 8.42 x 10⁻² | 9.59 x 10⁻² | 0.109 |
| 0.70 | 7.79 x 10⁻² | 8.52 x 10⁻² | 9.46 x 10⁻² | 0.108 | 0.118 |
| 0.80 | 8.21 x 10⁻² | 9.05 x 10⁻² | 0.101 | 0.112 | 0.120 |
| 0.90 | 7.90 x 10⁻² | 8.88 x 10⁻² | 0.100 | 0.114 | 0.126 |
| 1.00 | 7.23 x 10⁻² | 8.16 x 10⁻² | 8.94 x 10⁻² | 9.92 x 10⁻² | 0.110 |
a is the volume fraction of ethyl acetate in the ethanol + ethyl acetate mixtures free of CLX.

Figure 4 Solubility profile of CLX in ethanol-water (δ1=26.51-47.97 MPa1/2) and ethanol-ethyl acetate (δ1=26.51-18.49 MPa1/2) at several temperatures.
According to the literature, solutes with solubility parameter below (δ 2=25 MPa1/2 will have only one solubility peak [20]. The solubility parameter of CLX, estimated in accordance with the group contribution methods proposed by Fedors [21] is δ 2 = 23.83 MPa1/2, which is slightly greater than the experimental solubility maximum value obtained in this work at δ 2 = 22.50 MPa1/2. What is fascinating about this result is that the value is below 25 MPa1/2. Both values do not always correspond, despite this, this theoretical method offers excellent advantages in the stages of pre-formulation of new drug development. Table 4 explain the application of the Fedors method [21] for estimating molar volume and Hildebrand total solubility parameter for CLX calculated according to values reported by Fedors [21].
Table 4 Application of the Fedors' method to estimate internal energy, molar volume, and Hilde-brand solubility parameter of CLX.
| Atom or functional group | N.° of atoms or functional groups | ΔE (cal/mol) | ΔV (cm 3 /mol) |
|---|---|---|---|
| CF3 | 1 | 1020 | 57.5 |
| CH3 | 1 | 1125 | 33.5 |
| -CH= | 9 | 1030 | 13.5 |
| -C= | 6 | 1030 | -5.5 |
| S | 1 | 3380 | 12 |
| O | 2 | 800 | 3.8 |
| -NH2 | 1 | 3000 | 19.2 |
| -N= | 2 | 2800 | 5.0 |
| Ring 5 atoms or more | 3 | 250 | 16 |
| Double conjugated bonds | 8 | 400 | -2.2 |
| ∑ΔE =35 125 cal/mol | ∑ΔV=258.7 cm3/mol | ||
| δ2 2 = 135.77 cal/cm3 | |||
| δ 2 = 11.65 (cal/cm3)* | |||
| δ 2 = 23.83 MPa½ | |||
Apparent heat of solution changes as related to solvent composition
From the solubility data, the thermodynamic functions of solution were calculated. The apparent enthalpy of solution (ΔH5) and Gibbs free energy of solution (ΔG
S
hm
) of CLX was obtained from linear regressions of ln X2 against
 based on van't
Hoff equation, where T hm is the harmonic mean temperature = 297.98 K of the experimental temperatures used, 288.15, 293.15, 298.15, 303.15, 308.15 K, and R is the gas constant (8.3145 J/K.mol). From this regression, the intercept gives the apparent Gibbs free energy change, ΔG S hm , at the experimental harmonic mean temperature, T hm [22].

Using this approach, Krug et al. [22] demonstrated that the errors of the slope and the intercept are not correlated, and the calculated thermodynamic magnitudes can be used to detect a true chemical compensation relationship. The slopes of the van't Hoff relationships were negative (r2 values range between 0.98 - 0.99), meaning that the heat of solution is endothermic. The straight lines were not parallel indicating that the apparent heat of mixing (ΔH M = ΔH S - ΔH F ) changed with ethanol ratio because the heat of fusion (AH) of the solid phase at equilibrium with the saturated solutions did not differ from the values obtained for the original powder. The standard entropic change for solution process, ΔS S , obtained from the respective ΔH S and ΔG S hm values by using equation 3:

Table 5 explains the apparent thermodynamic quantities of solution of CLX in all the ethanol-water and ethanol-ethyl acetate cosolvent mixtures, at 297.98 K as function of mixtures composition. The standard Gibbs free energy of solution, ΔGS hm, is positive (unfavourable) in all cases as also is the enthalpy of solution, ΔH S ; therefore, it can be assured that the process is always endothermic. Figure 5 presents the standard molar thermodynamic functions for dissolution of CLX in all the cosolvent mixtures; it can observe ΔH S increases from 0 to 40% ethanol (δ1 = 39.40 MPa1/2). Since enthalpy is unfavourable, the initial solubility enhancement at the water-rich region (see figure 4) is entropy driven. The enthalpy increase cannot be due to larger cavity formation energy because this energy should be smaller in ethanol than in water. This is possibly related to the breaking of the ice-like structure of water (hydrogen bonds) around the solute, which increases both the enthalpy of and the entropy of the system. This result shows that ethanol can lower the hydrophobic hydration effect despite being itself a hydrogen-bonded solvent. ΔH S of CLX decreases above 40% ethanol in water (see figure 5).
Table 5 Thermodynamic functions of solution for CLX in ethanol-water and ethanol-ethyl acetate cosolvent mixtures at 298.0 K.
| Cosolventa | ΔG S (kJ/mol) | ΔHS (kJ/mol) | ΔSS (kJ/mol) | TΔS S (kJ/mol) | %ξΔH | %ξTΔH |
|---|---|---|---|---|---|---|
| Ethanol - water mixtures | ||||||
| 0.00 | 43.23 | 25.68 | -58.9 | -17.55 | 59.40 | 40.60 |
| 0.10 | 40.75 | 26.25 | -48.6 | -14.50 | 64.41 | 35.59 |
| 0.20 | 34.70 | 39.98 | 17.7 | 5.28 | 88.07 | 11.93 |
| 0.30 | 32.10 | 29.77 | -7.8 | -2.33 | 92.75 | 7.25 |
| 0.40 | 25.95 | 61.02 | 117.6 | 35.07 | 63.50 | 36.50 |
| 0.50 | 21.61 | 44.75 | 77.6 | 23.14 | 65.91 | 34.09 |
| 0.60 | 18.54 | 44.88 | 88.2 | 26.30 | 63.03 | 36.97 |
| 0.70 | 15.99 | 40.99 | 83.8 | 25.00 | 62.12 | 37.88 |
| 0.80 | 13.82 | 43.58 | 99.8 | 29.76 | 59.42 | 40.58 |
| 0.90 | 11.81 | 32.42 | 69.1 | 20.61 | 61.14 | 38.86 |
| 1.00 | 10.71 | 28.54 | 59.8 | 17.84 | 61.54 | 38.46 |
| Ethanol-ethyl acetate mixtures | ||||||
| 0.90 | 9.08 | 28.93 | 66.6 | 19.85 | 59.30 | 40.70 |
| 0.80 | 8.19 | 20.25 | 40.4 | 12.06 | 62.68 | 37.32 |
| 0.70 | 7.60 | 20.38 | 42.9 | 12.79 | 61.45 | 38.55 |
| 0.60 | 6.93 | 20.47 | 45.4 | 13.54 | 60.19 | 39.81 |
| 0.50 | 6.32 | 18.22 | 39.9 | 11.90 | 60.49 | 39.51 |
| 0.40 | 6.07 | 16.40 | 34.6 | 10.33 | 61.36 | 38.64 |
| 0.30 | 5.81 | 15.72 | 33.2 | 9.91 | 61.33 | 38.67 |
| 0.20 | 5.69 | 14.44 | 29.3 | 8.74 | 62.28 | 37.72 |
| 0.10 | 5.69 | 17.49 | 39.6 | 11.80 | 59.72 | 40.28 |
| 0.00 | 5.97 | 15.21 | 31 | 9.23 | 62.22 | 37.78 |
a is the percentage of ethanol in the ethanol + water or ethanol-ethyl acetate mixtures free of CLX.

Figure 5 Apparent heats of solution of CLX in ethanol-water mixtures (blue) and in ethanol-ethyl acetate (red).
Therefore, favourable enthalpy is the driving force that enhances solubility at the polar region included between (δ1 = 39.40 and (δ1 = 26.51 MPa1/2. These results corroborate other findings about solubility enhancement, which is entropy driven at the water-rich region and enthalpy controlled at the ethanol-rich region [23-29]. The similar pattern observed for drugs of different nature at the water-rich region suggests that the loss of the solvent structure (entropy as the driven force) is responsible for the initial solubility enhancement in aqueous mixtures. The ratio at which the dominant mechanism changes to enthalpy depends on the nature and polarity of the drug. Figure 5 displays the enthalpy curves in the non-aqueous, less polar mixture. The enthalpy changes are much smaller (29 to 16 kJ/mol) than in the aqueous mixture. There are not slope changes, indicating that a single mechanism, enthalpy, controls the solubility enhancement.
Figure 6 displays the Gibbs energy curve behaviour ΔG S hm , values are positive demonstrating apparently non-spontaneity of the liquid solution process and in all cases, the experimental solubilities are lower than the ideal solubilities excepting at 100 % ethanol. In the polar mixture, the enthalpy of solution changed from 61 to 28 kJ/mol and the standard Gibbs energy of solution from 43 to 10 kJ/mol, values demonstrating substantial enthalpy-entropy compensation in a process that is largely enthalpy-driven (see figure 7).

Figure 6 Apparent free energy of solution of CLX in ethanol-water mixtures (blue) and in ethanol-ethyl acetate (red).

Figure 7 Thermodynamic functions of dissolution of celecoxib: ΔG S (blue), ΔH 1 (red), and TASS (green).
This can be verified by calculating the relative contributions by enthalpy (ζΔH S ) and entropy (ζTΔS S ) toward the solution processes are given by equations (4) and (5) [30]. The main contributor to the (positive) standard molar Gibbs energy of solution, in most cases is the (positive) solution enthalpy.

Thermodynamic functions of transfer
The thermodynamic functions of transfer from the more polar to the less polar mixtures are obtained to validate the effect of solvent composition on the solubility increase (see tables 6 and 7). These new functions of transfer (ΔG hmAB , ΔH S A . B and ΔS S AB ) were calculated as the differences between the thermodynamic quantities of mixing obtained in the more polar mixtures and the less polar ones, where ΔH M = ΔH S - ΔH F and ΔS M = ΔH F / T F , at the same time ΔH and T, were obtained by DSC. For the aqueous mixture (see table 6) is favourable (negative values) when going from a more polar to a less polar medium (increasing ethanol concentrations). The addition of ethanol to water decreases the medium polarity (lower solubility parameter values). The solubility process is entropy driven from water to 0.40 volumetric fraction of ethanol. Both are less than zero as the medium polarity is further decreased (0.5-1 volumetric fraction of ethanol) and the solubility process is enthalpy driven.
Table 6 Thermodynamic functions of transfer for CLX from more polar solvents to less polar solvents in ethanol + water cosolvent mixtures at 298.0 K.
| Ethanol / volume fraction | ΔG 0 A →B | ΔH 0 A →B | ΔS 0 A →B | TΔS 0 A →B | |
|---|---|---|---|---|---|
| Medium A | Medium B | kj mol1 | kj mol1 | J mol-1 K-1 | kj mol1 |
| 0.00 | 0.10 | 2.48 | -0.57 | -10.22 | -3.05 |
| 0.10 | 0.20 | 6.05 | -13.73 | -66.35 | -19.78 |
| 0.20 | 0.30 | 2.61 | 10.21 | 25.51 | 7.61 |
| 0.30 | 0.40 | 6.15 | -31.25 | -125.44 | -37.40 |
| 0.40 | 0.50 | 4.34 | 16.27 | 40.00 | 11.93 |
| 0.50 | 0.60 | 3.07 | -0.09 | -10.59 | -3.16 |
| 0.60 | 0.70 | 2.55 | 3.85 | 4.37 | 1.30 |
| 0.70 | 0.80 | 2.17 | -2.59 | -15.97 | -4.76 |
| 0.80 | 0.90 | 2.01 | 11.16 | 30.68 | 9.15 |
| 0.90 | 1.00 | 1.10 | 3.88 | 9.31 | 2.78 |
| 1.00 | 0.00 | 1.63 | -0.50 | -6.77 | -2.02 |
Table 7 Thermodynamic functions of transfer for CLX from more polar solvents to less polar solvents in ethanol + ethyl acetate cosolvent mixtures at 298.0 K.
| Ethyl acetate Volume fraction | ΔG 0 A →B | ΔH 0 A →B | ΔS 0 A →B | TΔS 0 A →B | |
|---|---|---|---|---|---|
| Medium A | Medium B | kj mol1 | kj mol1 | J mol-1 K-1 | kj mol1 |
| 0.00 | 0.10 | 1.63 | -0.39 | -6.77 | -2.02 |
| 0.10 | 0.20 | 0.89 | 8.68 | 26.14 | 7.79 |
| 0.20 | 0.30 | 0.60 | -0.13 | -2.44 | -0.73 |
| 0.30 | 0.40 | 0.66 | -0.08 | -2.51 | -0.75 |
| 0.40 | 0.50 | 0.61 | 2.24 | 5.48 | 1.63 |
| 0.50 | 0.60 | 0.25 | 1.82 | 5.29 | 1.58 |
| 0.60 | 0.70 | 0.26 | 0.68 | 1.39 | 0.41 |
| 0.70 | 0.80 | 0.12 | 1.29 | 3.93 | 1.17 |
| 0.80 | 0.90 | 0.00 | -3.05 | -10.24 | -3.05 |
| 0.90 | 1.00 | -0.28 | 2.28 | 8.60 | 2.56 |
The opposite trends are observed in the case of the non-aqueous mixture (see table 7). The transfer from the more polar (higher ethanol concentrations) to the less polar mixtures (higher ethyl acetate concentrations) is enthalpy driven (ΔH 0 A →B < 0 and ΔS 0 A →B < 0) for 0.0, 0.3, 0.8 and 0.9 mass fraction of ethyl acetate. However, for 0.1, 0.2 and from 0.4 to 0.7 mass fraction of ethyl acetate, ΔH 0 A →B > 0 and ΔS 0 A →B > 0 and the solubility process is controlled by entropy.
Enthalpy-entropy compensation analysis of CLX
There are several reports in the literature that have demonstrated enthalpy-entropy compensation effects for the solubility of drugs in aqueous or non-aqueous co-solvent mixtures. The graph of ΔH S as a function of ΔG S hm at mean harmonic temperature allows us to observe similar mechanisms for the dissolution process according to the tendencies obtained [24, 25, 27, 31-34]. Figure 8 shows fully that CLX in the cosolvent system presents nonlinear ΔH S vs ΔG S hm compensation with positive slope in an interval from pure ethanol to 40 % ethanol in water. On the other hand, from pure water up to 40 % ethanol in water a negative slope is obtained. Accordingly, it follows that the driving function for the drug dissolution process is the enthalpy in the former case; while in the second case, the driving function is mainly the entropy. The results show the usefulness of the enthalpy-entropy compensation analysis to identify changes of the mechanism of co-solvent action.

CONCLUSION
The equilibrium solubility of CLX in ethanol-water and ethanol-ethyl acetate at T= 288.15-308.15 K was reported, mole fraction solubility of CLX increases continuously from neat water to 50% ethanol in ethyl acetate (δ1 = 22.50 MPa1/2) at all temperatures studied. Based on van't Hoff equations the respective apparent thermodynamic quantities of solution and transfer of CLX were calculated. In ethanol-water, the enthalpy of solution curve against solvent composition passes through a maximum at 40% ethanol in water. Non-linear enthalpy-entropy compensation analysis is observed demonstrating different dissolution mechanism with the variation in the proportion of the cosolvent.

