


 Inglês (pdf)
 Artigo em XML
 Referências do artigo
 Enviar este artigo por email
 Citado por SciELO
  Citado por Google
  Similares em
SciELO
Similares em
SciELO  Similares em Google
 Permalink
Introduction
In the global environment, the knowledge economy is the basis for the development and productivity of the leading countries through investment in technology and innovation. However, these countries also have highly technical and innovative defense industries that promote economic dynamics. This study analyzes how the knowledge produced by the security and defense sector (S&D), including its materialization and transfer through inter-organizational relations by the modernization, maintenance, and rationalization of defense, could affect it. This strengthens the transfer of know-how and the knowledge obtained from research, development, and innovation (R+D+i) processes to society and dual-use industries through knowledge-based economies. Information is presented through a knowledge and innovation defense system comprising technological, social, and economic characteristics to overcome future challenges and strengthen a nation’s competitiveness based on this type of public spending (Peñalver, 2013).
Moreover, it is explored if there is a correlation between some indicators that reflect the value-added productivity indicator or VAP with knowledge-based economies, including high-tech exports, research and development (R&D) spending with Gross Domestic Product (GDP), the competitiveness index, and value-added industries. These are associated with the defense economics concept and the defense budget in R&D in the total Government Budget Allocations for R&D (GBARD) (SIPRI, 2019a). The analysis aims to determine whether investments in defense R&D contribute to developing high-value-added products based on three of the strongest economies in the world concerning their GDP: the United States, China, and Japan. Additionally, the data published by the World Trade Organization for 2018, variables analyzed by the World Bank (WB) and the Organization for Economic Cooperation and Development (OECD), and the Datosmacro website of the Spanish newspaper Expansion were used as references for this study.
This document attempts to answer the following questions: Are there relationships between investments in research and development in defense and value-added productivity indicators? Are value-added productivity indicators associated with the budget allocated for defense purposes in R&D in the United States, China, and Japan? These questions seek to establish the effect these investments generate in knowledge-based economies distinguished by the high value-added of their productivity. This productivity is displayed in product and service generation knowledge and is reflected in each country’s respective industries. Furthermore, the existing relationship in defense-focused investments in science, technology, and innovation, with productive factors including competitiveness, the development of high technology, and the generation of high value-added industries in the strongest economies in the world, is also analyzed. For this study, statistical analysis tools, such as Pearson’s Correlation and simple linear regression techniques, are used to establish the correlation between value-added productivity variables, representing the concept of the knowledge economy, and the defense budget variable in R&D, representing defense economics. In addition, a review of the relevant theories that address knowledge and defense economies was conducted to establish how these two concepts are related by analyzing the indicators of investment in S&D and how the literature review performed can be a strategic driver for generating knowledge.
Theoretical Framework
Economy Knowledge
During the 1970s in the United States, industries based on microelectronics and technology experienced significant growth, generating new economic growth paradigms. These integrated aspects, such as technical progress, education, research, experimental development, and innovation, increased knowledge and placed economic capital in the background (Dávila, 2008). Since then, the importance of technological changes in the industry, the economy, and new financing methods in innovative markets has been demonstrated (Porter, 2012; Alam et al., 2017).
This is the basis of knowledge economies, defined by the OECD as those systems that demonstrate dynamism, growth, wealth, and employment originating from the production and intensive use of information, technology, and knowledge to generate high-value-added products to strengthen the competitiveness of nations (Sánchez & Ríos, 2011); value-added productivity -VAP- indicators were used for this definition. In these economies, knowledge must be the center of the strategy, based on four pillars: education and training; infrastructure for information access and telecommunications; innovation systems; and government and business institutions (Sánchez & Ríos, 2011).
Defense Economy (DE)
Defense investments represent essential participation in creating innovation networks and technological infrastructures and promoting national institutional policies to foster the allocation of resources to generate highly technical knowledge. An applied example is described in a case study conducted by Florez Zuluaga et al. (2021) directed to achieve technological sovereignty and the potential savings of a country’s economy in applied defense economics or DE.
DE consists of the efficient management and administration of the human, material, and technological resources necessary to guarantee the interests, security, and defense of all citizens, the integrity of the territory, and national sovereignty while contributing to the general economic wellbeing of the country. It also seeks the articulation of defense with the economic growth (Fernández, 2017), understanding transversality and dual-use de in markets other than a defense that have various products developed in this industry. Furthermore, defense spending enables the formation of new companies due to dual-use innovations and establishes a valuable cycle of knowledge production and the introduction of wealth creation processes (Dávila, 2008). This is also a specialized branch of economic knowledge applied to a state activity that uses interdisciplinary approaches (Viñas, 1984), ranging from the economic effects of defense spending and its relationship with the civil sector to the administration, management, and distribution of these resources. Therefore, it can be inferred that a connection between the VAP of knowledge-based economies and the R&D defense budget exists as they measure intensive activities in knowledge creation. Consequently, analyzing the indicators’ definition, form, and structure is used as representative study variables. These variables are listed below.
Value-added Productivity (VAP)
The VAP indicator is that the additional economic is the fundamental value obtained by goods and services when transformed during production. In other words, it is the monetary value that a given production process adds to intermediate consumption, such as the inputs used in the production and distribution (Fuenzalida, 2002). Based on this indicator, it can be assumed that developing countries are characterized by a labor-intensive industrial sector with low value-added, such as the production of primary goods or their first transformation phase. In contrast, developed countries have a knowledge-intensive economy generating high value-addition; these concepts were created by Adam Smith and David Ricardo, the founders of the classical economic theory of international trade (Fuenzalida, 2002). Consequently, the study indicators used to measure productivity and the capacity to generate value-added included R&D spending concerning the GDP (annual %), the competitiveness index, value-added industries (% of GDP), and exports of high-tech products (% of exports of manufactured products).
National VAP indicators were also considered as they refer to R&D investments, the competitiveness index, value-added industries, and high-tech exports to determine the correlation between the de indicator and the research defense (R&D) budget included in the total government budget allocated to R&D (OECD, s.f., 2019).
R&D Spending Concerning the GDP
On the other hand, R&D spending concerning the GDP (annual %), according to the World Bank, shows that R&D expenditures correspond to current and capital expenditures on creative work, systematically performed to increase knowledge about humanity, culture, and society, and the use of knowledge for new technological applications. The R&D department encompasses basic research, applied research, and experimental development (Banco Mundial, 2019b). This measurement makes it possible to identify the investment capacity of nations in R&D knowledge generation. It is the foundation for establishing perspectives regarding sustainable development and strengthening knowledge economies. This indicator enjoins governments to promote sustainable industrialization and innovation through the rapid increase in spending on R&D and increment in the number of researchers (Unesco, 2016). Innovation has become necessary for transforming productive structures, education, and other social requirements. The OECD highlights innovation as essential to increase productivity, performance, and scientific and technological knowledge, (OECD, 2015).
Global Competitiveness Index (GCI)
In terms of the Global Competitiveness Index (GCI) this instrument measures how a country uses its available resources and its ability to provide its inhabitants with a high level of economic prosperity. In classifying countries according to competitiveness, this indicator analyzes twelve variables, among which the following stand out: infrastructure, macroeconomic environment, higher education and training, market efficiency, technological preparation, and innovation. In this setting, competitiveness is understood as a branch of economics that analyzes the facts and policies that encourage a nation’s capacity to create and maintain an environment that adds more value to its companies and brings prosperity to its population (Álvarez et al., 2012, p. 13). Moreover, competitiveness contributes to factors that determine the growth of a nation as a tool for formulating economic policies and institutional reforms and making strategic and investment decisions. Therefore, the country’s level of competitiveness is essential for its growth and is supported by productivity and investments (Schwab, 2016).
Value-added Industries, as a GDP Percentage
In reference to the value of goods or services acquired in the production chain; that is, the value generated through each new participation in terms of work or processing of a good and can be analyzed in monetary units based on the competitiveness of each economic agent of a country (Banco Mundial, 2021). Value-added is the industry’s net output after adding all outputs and subtracting intermediate inputs. Value-added is calculated without deductions related to the depreciation of manufactured goods or the depletion or degradation of natural resources (Banco Mundial, 2021). Highly developed countries are those that can add more value to their products. This value results in higher life quality for their citizens. In this sense, value-added is a core concept concerning knowledge economies.
High-tech Product Exports
The indicator for high-tech product exports (as a percentage of manufactured products exports) measures high-tech products' exports. These products are highly intensive in R&D, such as those of the aerospace, computer, and pharmaceutical industries (Banco Mundial, 2019a). This technology can provide numerous advantages for developing an economy by creating and generating a critical mass of knowledge. As a result, the production possibility frontiers of a country will improve competitiveness indexes, thus creating participation in new technology-based markets, which, in turn, will strengthen the GDP.
The Defense Budget in R&D of GBARD
Regarding the defense budget in R&D of GBARD (Government Budget Allocations for R&D), the budget is based on analyzing three essential aspects of economic activities: production, allocation, and distribution. The first aspect refers to the determination of goods produced, the second refers to the use of limited resources in production lines, and the third refers to the receivers and beneficiaries of production. When these traditional economic perspectives are applied to defense matters, they are related to the following specific issues (Martín, 1984): determination of security needs of the collective good obtained in defense; allocation of resources towards defense to the detriment of other departments, and the resolution of defense spending beneficiaries.
Defense Spending
It is important to stress that defense spending is a significant accelerator to scientific research, technological development, and innovation (R+D+i) (Fernández, 2017), resulting in a key determining factor for knowledge production. Furthermore, this product can be transferred to other economic sectors, generating value-added in different production processes.
For example, transfers can occur through cooperation agreements between government agencies and industries (Leydesdorff & Meyer, 2003), in which cases based on de are distinctive, exhibiting interdependence between various organizations. Another example is the United States, in which technological developments for non-military purposes are leveraged by investments in military and defense research (Ruttan, 2006). Likewise, investments supported by the North Atlantic Treaty Organization (NATO) in Europe have contributed to economic and industrial developments in the same sectors as the USA (Kluth, 2017). It can be concluded that the defense sector and military acquisitions contribute positively to the development of multiple industries, such as aeronautics, energy, information, and communication technologies (ICT), and are crucial for the world economy.
However, a possible obstacle to military spending investments (Viñas, 1984) is related to defense programs using a significant part of a country’s technological and scientific talent and consuming an actual amount of the goods and services channeled to the nations public sector. This is due to a high degree of productive and technological specializations required, leading to a growth in the activity. As a result, the Statistical Office of the European Communities and the OECD defined the GBARD index to identify the public budget allocated to R&D to determine the financial potential assigned by a public administration to strengthen the national economic development (OECD, 2019).
Methodology
The gathered information was taken from the Frascati Manual guidelines to compare with other countries’ results, (OECD, 2015). This analysis was conducted using descriptive quantitative techniques under a non-experimental study model; no changes in the researched variables related to reactions, results, and consequences occurred. Likewise, a simple linear correlation analysis was conducted based on linear regression and the correlation coefficient to discover the relationship between VAP indicators and defense budget investments in R&D related to the total budget for GBARD.
The correlation coefficient is an index used to measure the relationship between two quantitative variables (Hernández Sampieri et al., 2014). The coefficient has a scale of -1 to 1, where 0 indicates no relationship between the variables, while 1 or -1 indicates a perfect positive or perfect negative correlation between the two variables, respectively (Camacho, 2008). Table 1 displays the correlation ranges of this coefficient.
Table 1. Pearson Coefficient Rating Criteria
| Ranges | Score |
|---|---|
| 0-0.3 (- 0.3)-0 | Short |
| 0.31-0.6 (-0.31M-0.6) | Moderate |
| 0.61-0.9 (- 0.61)-(- 0.9) | High |
| 0.91-1 (-0.91M-1) | Very high |
Source: Data created by this study based on Almaraz (2018).
On the other hand, linear regression establishes the best equation representing the relationship between the selected variables from the equation Y=mx+b determined by the least-squares method, quantifying the differences between the observed values and the predicted values of all possible lines (Reding Bernal et al., 2011; Chavez Leandro, 2013).
For this, the coefficient of determination (R2) represents a quantitative measurement of the adjustment percentage of the model (Hernández Sampieri et al., 2014). In addition, a direct or inverse linear relationship is established between the variables X (independent) and Y (dependent) (Almaraz et al., 2018; Chavez Leandro, 2013).
For the development of the project, the following hypotheses were stated:
Ho and Hi mean that the VAP indicators have and do not have a relationship with the R&D defense budget.
The following were alternative hypotheses (Ha):
Ha1: The R&D defense budget is related to high technology exports.
Ha2: The R&D defense budget is related to spending in R&D.
Ha3: The R&D defense budget is related to the competitiveness index.
Ha4: The R&D defense budget is related to the value-added industry.
The criteria for evaluating the study hypotheses were: if a Pearson coefficient of determination and correlation equal to 0 existed, the Ho (null hypothesis) was accepted. If Pearsons coefficient of determination and correlation differed from 0, Hi and Ha were accepted.
Results
For the construction of the analyzed variables, data were obtained from the World Bank, the OECD, the Spanish website Datosmacro, and the R&D defense budget indicator related to the GBARD total in millions of USD. In China, this indicator is constructed with data on military spending in millions of USD from the World Bank, multiplied by the R&D defense budget, resulting in a percentage of the total GBARD of Chinese Taipei. However, China does not record these measurements in the OECD as it is considered a non-aligned country (Tables 2-4).
Table 2. Variables of the United States
Source: Study calculations.
Table 3. Variables of China
Source: Study calculations.
Table 4. Variables of Japan
Source: Study calculations.
The studied variables are related to the concepts of de and VAP being significant factors in the production process of a developed country; this is a result of contributions to R+D+i as they create dual-use products (military and civil), and these become the primary assets of a nation by demonstrating an ability to generate knowledge as a fundamental element of productivity (Schwab, 2016). Once more, this exhibits the impact of defense investments in dual-use projects, indicating how R&D defense investments can disruptively affect markets and a population s life quality (Yuan et al., 2016).
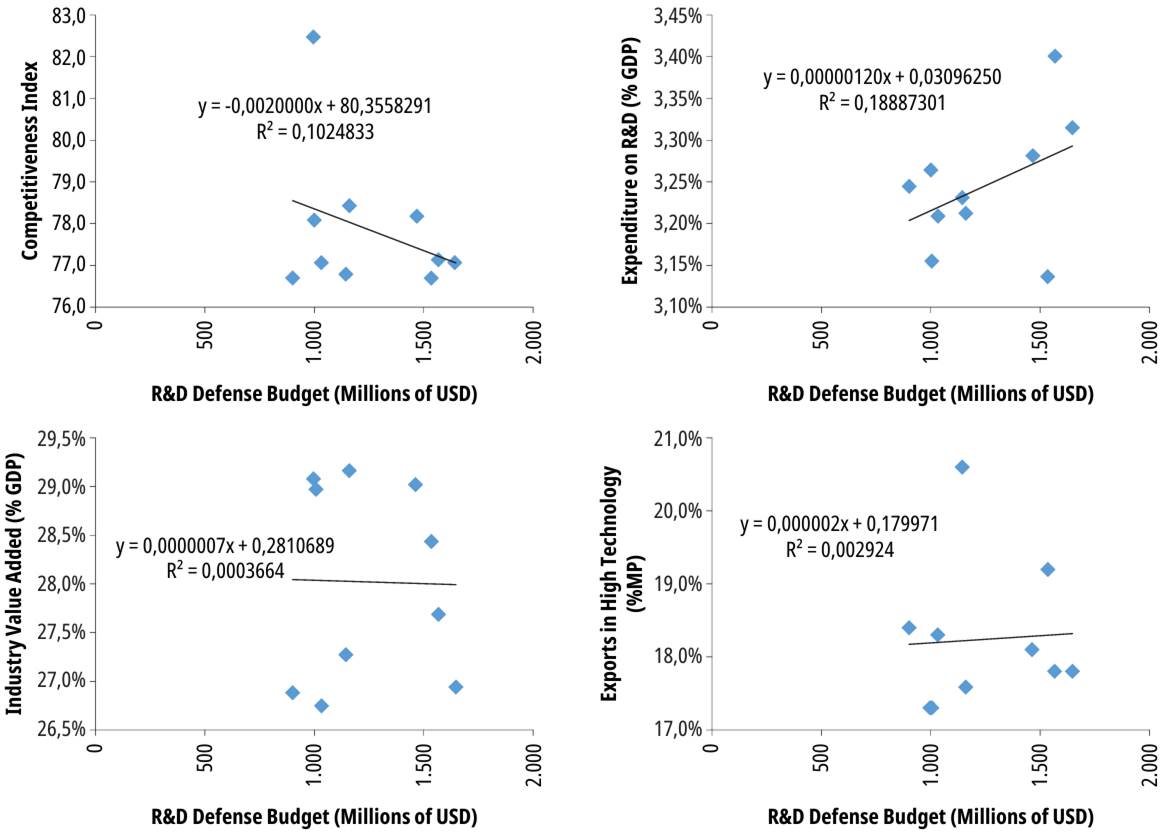
The VAP variables demonstrate vital indicators to define the behavior and impacts of knowledge generation and how this is reflected in the economic development of a nation. The variables of defense R&D demonstrate how these investments contribute to meeting security threats and, simultaneously, solving operational and logistical situations that allow military advantages in the territories of study. When the linear regression and determination of correlation coefficients were performed, the results were obtained per country, as exhibited in Tables 5-7 and Figures 1-3.
Table 5. Results of the United States
| Indicator | Relationship | Straight Line Equation | R2 Coefficient | Multiple Correlation Coefficient R | Score | Pearson Correlation | Relationship Type |
|---|---|---|---|---|---|---|---|
| R&D Defense Budget related to GBARD total (Millions of USD) | High-tech Exports (% Exports of Manufactured Products) | y = -0.00000039x + 0.23594724 | 0.019 | 0.137 | Short | -0.137 | Inverse Relationship |
| R&D Spending (% GDP) | y = 0.00000006X + 0.02458430 | 0.589 | 0.768 | High | 0.768 | Direct Relationship | |
| Competitiveness Index | y = 0.0004x +60.26 | 0.739 | 0.860 | High | 0.860 | Direct Relationship | |
| Value-added Industry (% GDP) | y = -0.00000025x + 0.20245587 | 0.034 | 0.183 | Short | -0.183 | Inverse Relationship |
Source: Study calculations.

Table 6. Results of China
| Indicator | Relationship | Straight Line Equation | R2 Coefficient | Multiple Correlation Coefficient R | Score | Pearson Correlation | Relationship Type |
|---|---|---|---|---|---|---|---|
| R&D Defense Budget related to GBARD total (Millions of USD) | High-tech Exports (% Exports of Manufactured Products) | y = 0.00000024x + 0.30763636 | 0.017 | 0.130 | Short | -0.130 | Direct Relationship |
| R&D Spending (% GDP) | y = 0.0000001x + 0.0192054 | 0.437 | 0.661 | High | 0.661 | Direct Relationship | |
| Competitiveness Index | y = 0.0003x + 67.25 | 0.502 | 0.708 | High | 0.708 | Direct Relationship | |
| Value-added Industry (% GDP) | y = -0.000004x + 0.468430 | 0.395 | 0.628 | High | -0.628 | Inverse Relationship |
Source: Study calculations.

Table 7 Results of Japan
| Indicator | Relationship | Straight Line Equation | R2 Coefficient | Multiple Correlation Coefficient R | Score | Pearson Correlation | Relationship Type |
|---|---|---|---|---|---|---|---|
| R&D Defense Budget related to GBARD total (Millions of USD) | High-tech exports (% Exports of Manufactured Products) | y = 0.000093x + 0.048772 | 0.003 | 0.054 | Short | 0.054 | Direct Relationship |
| R&D Spending (% GDP) | y = 0.00000120x + 0.03096250 | 0.18887301 | 0.436 | Moderate | 0.435 | Direct Relationship | |
| Competitiveness Index | y = -0.0020000x + 80.3558291 | 0.1024833 | 0.321 | Moderate | -0.319 | Inverse Relationship | |
| Value-added Industry (% GDP) | y = -0.0000007x + 0.2810689 | 0.0003664 | 0.020 | Short | -0.019 | Inverse Relationship |
Source: Study calculations.
Discussion
The data obtained enabled us to answer the research question regarding a relationship between R&D defense investments and Value-added productivity, indicating an agreement with the research hypothesis (RH), as expressed by the multiple correlation indicators and correlation coefficients of each country analyzed. Subsequently, the relationship variables with each hypothesis proposed in this research were explored. As a result, Ho was discarded since the VAP indicators studied revealed correlations different than 0 related to the R&D defense budget indicators. Furthermore, a relationship between de and knowledge economies was exhibited, validating the Hi. Therefore, highlighting certain aspects, such as the collaboration between military and civilian R&D, is essential, facilitating a country’s development and strengthening its economy, resulting in beneficial effects (Peñalver, 2013).
Regarding Ha1, the R&D defense budget variable affects high-tech exports with low ratings in correlation coefficients of 0.137, 0.130, and 0.04 for the United States, China, and Japan, respectively. In the case of the United States and China, this situation should be studied further as it is highly significant to DE. Nonetheless, there is a correlation regarding Hal in the three countries studied. Moreover, a direct relationship between the variables analyzed in Hal for the United States was absent. However, the country possesses the leading companies in defense markets and recorded worldwide sales in 2018 of approximately USD 148 040 000 000 (SIPRI, 2019b). This is demonstrated by the decrease in the country’s exports during the ten-year period analyzed (from 2009 to 2018), which experienced a decline from 25.01 % to 18.9 %. However, the defense budget in R&D increased from 57 045 000 000 to 67 494 000 000 USD. Since this indicator considers the exports of high-tech products, deemed R&D-intensive, the relationship between these indicators contributes to the ongoing worldwide demands concerning generating high-tech products and services in global competitiveness.
Various research has been conducted in Japan, another country analyzed in this study, demonstrating the accelerating factors of the economy following World War II. This is related to massive production processes, the exchanging of monopolies for “trade groups,” the influence of education on development, and the creation of the Agency for Industrial Science and Technology. Japan’s success is attributed to the importance given to human capital in its evolution as a country. This implies that Japan’s productive capacity was strongly influenced by its developed capabilities due to World War II’s war economy and its productive alliance with the United States (Uribe Taborda & Mesa- Palacio, 2019).
Regarding Ha2, the correlation coefficient for the United States, China, and Japan permits a direct relationship to be established, showing a high correlation in the cases of China and the United States, with correlation coefficient variables of 0.768 and 0.661, respectively. For Japan, the relationship is moderate, with a coefficient of 0.425. Likewise, there are various studies on the role that R&D has in a nation’s defense, in which different perspectives have developed (Guellec & Van Pottelsberghe, 2003), demonstrating that R&D in science and technology (S&T) in defense has a “crowding out” effect on civil R&D and S&T. Goel, Payne, and Ram (Goel et al., 2008), discovered that the growth impacts of public R&D are more significant than that of private R&D. The impact of public R&D on defense is more important than that of nondefense R&D. For studies performed in Asian and Latin American countries, Morales-Ramos (2002) discovered that R&D in national defense creates a displacement effect on the country’s economic growth due to its adverse impacts on investments. By constructing a production function model containing the stock of “knowledge capital,” Zeng and Yunzhuang (2006) stated that defense R&D production significantly contributes to the growth of total defense productivity factors and creates a positive spillover effect on national economic growth. Yongzhi and Guangming (2010) demonstrated that defense R&D inputs in S&T have a “crowding out” effect on civilian R&D inputs. There is a reasonable proportion of defense R&D with a maximizing impact on national economic growth. Lastly, Yonggang and Xiaofeng (2010) examined the technological diffusion of space technology through a theoretical model based on three factors (the technology return rate, the rate of technology transfer, and industrial connections), combining the idea of “field,” concluding that technological diffusion revealed a state of decline and resembled a “damped wave” with the extension of time, this is also discussed in (Yuan et al., 2016).
In research studies regarding defense innovations performed in China, data from both the aviation and aerospace industries were considered relevant and are primary participants within the defense industry. While R&D data from civil sector operations were included, the influence of shipbuilding, electronics, and other adjacent sectors within the defense industry was not considered (Yuan et al., 2016). Based on the previous studies, a direct connection can be anticipated between knowledge production in the defense sector, and the allocation of public and private R&D resources in the countries researched. This connection is reflected in the size of defense industries, research results, manufacturing patents, and the positioning of universities. As a result, articulating the defense industry with various economic sectors contributes to industrial, economic, and knowledge development. However, the connection of the defense industry with the economic and social growth of a country has yet to be conclusive in various theoretical models, empirical techniques, and research samples in other field studies (Hou & Chen, 2013).
There are efficient technology transfer programs in countries like the United States with solid technological infrastructure. The Department of Defense directly influences the economy through significant investments, allocating over 40 % of the defense research budget. As a result, approximately one-third of the country’s scientists and engineers work in the defense sector activities (Hernández Mosquera, 2011). A similar situation occurred in China. During the last ten years, investments in defense research increased from USD 7 426 000 000 in 2009 to USD 17 390 000 000 in 2018, positioning its military industry among the five most important military sectors worldwide. Lastly, while this trend has remained stable in Japan, the country ultimately reduced its investments in defense research during the same period.
Ha3 is true in the case of the United States and China. These countries exhibit a high and direct relationship with a correlation coefficient of 0.86 and 0.708, respectively. However, in the case of Japan, the relationship is inverse and moderate, with a correlation coefficient of 0.319. The economic model of the United States allows the military industry to influence security and defense market worldwide significantly: the USA maintains 34 % of the global arms market and supplies more than one hundred countries. In contrast, China currently covers 6.2 % of the world market and is the fifth largest country in the global weapons exports (SIPRI, 2019b), thus impacting each Chinas competitiveness index factor.
In the case of China, this is reflected in the articulation of the arms industry development with the State through joining the Chinese productive defense system with the creation of the State Administration for Science, Technology and Industry for National Defense (SASTIND). This entity depends on the Chinese Ministry of Industry and Information Technology, which coordinates with the Peoples Army of China to lead State entities and the country’s defense industrial actors (Department of Defense, 2018). Likewise, the government relies on the National Natural Science Foundation of China (NSFC) and the Chinese Academy of Sciences (CAS) to develop high technology for defense. These institutions work together to resolve conflicts of interest in the university-company-State triad to eliminate adverse effects in pursuing China’s industrial goals and geopolitical interests. Taking this into consideration, it is essential to highlight that the United States has programs, such as the Small Business Innovation Research/Small Business Technology (SBIR/STTR) (SBIR, 2020), to integrate the development of innovative small business solutions and to provide opportunities, guidance, and support in the transfer or transition of technology in the war industry or commercial markets. This is supported by a government policy issued in the Commerce and Trade - US Code, Chapter 15, Article 638: “Research and Development” (Commerce and Trade - US Code). This demonstrates that the competitiveness index in the countries analyzed is positively influenced by the R&D defense budget. Furthermore, although research is conducted in defense-related institutions, knowledge returns escalate this industry, strengthening the factors measured by this index, such as infrastructure, local institutions, the macroeconomic environment, technological readiness, and innovation.
Regarding Ha4, in the United States, China, and Japan, there is an inverse relationship with correlation coefficients of -0.183, -0.628, and -0.019, respectively. This relationship can be explained through industrial systems, which are reflected in the value-added variables of their industries. Therefore, these can be constructive strategic proposals regarding Codes 10 to 45 of the isic (International Standard Industrial Classification of All Economic Activities) and include:
Section C for manufacturing industries (ISIC Divisions 10 to 33)
Section D for the supply of electricity, gas, steam, and air conditioning (ISIC Division 35)
Section E for water supply, sewerage, waste management, and remediation activities (ISIC Divisions 36 to 39)
Construction Section F (ISIC Divisions 41 to 43) and
Section G for wholesale and retail trade and repair of motor vehicles and motorcycles (ISIC Division 45) (IndexMundi, s.f.).
This inverse relationship occurs as representative industries are included, such as automotive, aeronautics, space, naval, information technology, communications, machinery, and equipment, and represent a significant income for economic development. This development relies on large technology-based corporations, such as Huawei™, Tencent™, and Sense Time™ in China, where markets exist due to the significant population size and large manufacturing capacities with a global scope through platforms such as Alibaba™. The United States also has technology- based companies with a worldwide impact, such as Wal-Mart™, Amazon™, Apple™, T&T™, and the Alphabet Group™, companies in the 2020 Fortune 500, ranking among the top ten globally. Japan is listed in this ranking, with companies such as Toyota™, Mitsubishi™, and Sony™, and has most companies in the same ranking (Fortune, s. f.).
Finally, it was demonstrated that de contributes to VAP in the United States, China, and Japan through various relationships and correlation levels in the variables analyzed. It also contributed to the hypotheses validation, as listed in Table 8.
Table 8 Acceptance of Research Hypotheses (Study Calculations)
| Hypothesis | United States | China | Japan | Hypothesis Acceptance | |
|---|---|---|---|---|---|
| Ho | VAP indicators are not related to the R&D defense budget | Relationship Exists | Relationship Exists | Relationship Exists | Hypothesis Not Accepted |
| Hi | VAP indicators are related to the R&D defense budget | Relationship Exists | Relationship Exists | Relationship Exists | Hypothesis Accepted |
| Ha1 | R&D defense budget is related to high-technology exports | There is a Low Relationship | There is a Low Relationship | There is a Low Relationship | Partially Accepted Hypothesis |
| Ha2 | R&D defense budget is related to R&D spending | There isa High Relationship | There isa High Relationship | There is a Moderate Relationship | Hypothesis Accepted |
| Ha3 | R&D defense budget is related to the competitiveness index | There isa High Relationship | There isa High Relationship | There is a Moderate Relationship | Hypothesis Accepted |
| Ha4 | R&D defense budget is related to the value-added industry | There isa Low Relationship | There isa High Relationship | There is a Low Relationship | Partially Accepted Hypothesis |
Conclusions and Recommendations
The literature reviewed reveals that the R&D defense budget impacts each VAP indicator studied. Therefore, for opportunities in the current economic dynamics, knowledge is the primary asset that will generate future wealth. For this reason, the strength of knowledge economies will consist of each nation’s ability to produce this new asset systematically (Kaku, 2011).
Accordingly, social responsibility is placed on those who create decisions on the economic effects of allocating resources for defense activities. This entails opportunity costs placed above other public needs, thus increasing the stock of State capital goods for the country’s economic growth (Viñas, 1984). However, suppose this defense spending is focused on creating national production capacities. In that case, it can become a generator of economic assets, promoting development of high-value-added products and services based on knowledge.
In the context of the fourth industrial revolution, the world economy favors opportunities involving the unsatisfied needs of millions of people through technology and information, then public policies are being designed to support this opportunity like (CONPES 3975 - National Policy for Digital Transformation and Artificial Intelligence, 2019; CONPES 4069. National Science, Technology and Innovation Policy, 2021), documents describing these policies for the case of Colombia. It encourages additional demand for products and services by empowering and connecting people and communities worldwide (Schwab, 2016).
The three countries analyzed have implemented and integrated national strategies. They focus their defense R&D resources to generate a spillover effect in various economic sectors, strengthening intellectual capital and technological infrastructures to develop sustainable competitive advantages.
Currently, the greatest asset of societies is knowledge, and it is a valuable opportunity for both R&D and defense spending to act as generators and stimulators of new technologies in developing countries. By acting as risk investors, the Nations will allow the development of innovations for economic growth and, at the same time, channel the entry of foreign technologies toward eliminating technological gaps.
The current economy and globalization create ties of interdependence by establishing international security and R&D treaties, making a more accessible transfer of knowledge and technologies from developed countries to developing countries. This reinforces the theory of military spending as a value-added mechanism and generates a country’s economic and social development. From this perspective, military R&D spending can be a factor in generating wealth and knowledge to transform the concept of spending into the concept of investment; this can be reflected in S&D improvement, institutionality, innovation, economic growth, and the life quality of citizens, through strengthening other social indicators and positively impacting the economy.
Investments are also reflected in the countries’ multidimensional security as it integrates factors that can affect security in cultural, social, personal, political, economic, and environmental dimensions. Therefore, a nation must plan comprehensive security policies reflected in the Sustainable Development Goals (SDG) programs. This implies adopting approaches of multidimensional security where the defense R&D significantly contributes to obtaining national capabilities in meeting these goals (Barrero et al., 2018).
It can be concluded that the countries of the United States, China, and Japan are submerged in knowledge economies with high rates of competitiveness and value-addition in their industries and have close relationships with competitiveness indicators, directly and indirectly, thus, revealing the influence of expenses on defense R&D in their VAP.
Based on these conclusions and by analyzing the recent history of Colombia, it could also be concluded that in the country, due to the internal conflict, knowledge has been generated that
Economic Effects of Investment in Defense Research and Development and its Impact on Productivity in Developed Countries could be capitalized by the national industry as the analyzed countries have done in a nascent industry of added value in the sector, which would allow reverting the investment in defense into a dynamic of the national economy, which could be consumed both by the national industry and by the regional industry.

