


 Inglês (pdf)
 Artigo em XML
 Referências do artigo
 Enviar este artigo por email
 Citado por SciELO
  Citado por Google
  Similares em
SciELO
Similares em
SciELO  Similares em Google
 Permalink
INTRODUTION
The chayote [Sechium edule (Jacq.) Swartz] is a native species to the mountainous regions of Mexico. It is currently found in the wild in the states of Veracruz and Oaxaca (Lira et al., 1999), where its cultivation is also practiced, and to a lesser extent in western and central Mexico. Because wild populations of chayote and the closely related species Sechium compositum (Donn. Sm) C. Jeffrey and Sechium chinantlense Lira & F. Chiang have only been found in this country, Mexico is considered the centre of origin of S. edule (Newstrom, 1990; Lira, 1995; Cross et al., 2006).
The cultivated and wild populations of chayote in Mexico shows great phenotypic and phytochemical variability in the characteristics of fruit, leaves and flowers. S edule domesticated populations are used for food purposes, while wild populations are used for pharmaceutical research (Cadena-Iñiguez et al., 2008; 2011).
Mexico ranks first in the world production and export of chayote. Around 2972 ha are produced in the country at an average rate of 66 tons per hectare, with Veracruz state contributing more than 90 % of total production (SIACON, 2020). Chayote fruit is used in national gastronomy and its alcoholic extracts are being studied as a potential treatment for various types of cancer (Cadena-Iñiguez et al., 2013b; Aguiñiga-Sánchez et al., 2015; 2017; Salazar-Aguilar et al., 2017).
Ecological niche is the relationship between a species with all biotic and abiotic factors that affect it. Ecological niche modeling predicts the probability of suitability of a species in each geographical area, that is, the necessary or ideal conditions for growth and development of species, where values close to 0 indicate little or no suitability, while values close to 1 indicates high suitability (Ashraf et al., 2017). The distribution of a species is a function of the ecological conditions where it develops and reproduces. Species distribution models (SDM) are based on statistical procedures and Geographical Information Systems (GIS). Using presence-absence data, these models allow the inference of ecological niches. Various algorithms for their calculation are grouped into descriptive, discriminating, and mixed techniques (Mateo et al., 2011). Descriptive techniques such as Bioclim include bioclimatic envelop methods to characterise the sites found within environmental space occupied by the species in question. In this group there are also algorithms based on distances (Domain and Mahalanobis) that evaluate sites in terms of environmental similarity with presence data (Elith et al., 2006). Discriminant techniques such as generalized linear models (GLM) require presence-absence data and could model realistic ecological relationships. Within these techniques are those using machine learning, such as maximum entropy (Maxent), random forest (RF), and support vector machines (SVM). These are widely used due to their ability to process large amounts of information and reconstruct groups for classification, or to generate numerical regressions for prediction tasks (Gobeyn et al., 2019). There are also null geographic models such as geographic distance, convex hulls, circles, and presence-absence that use geographic location of presences, but they are not based on predictive variables and are not commonly used since their performance and reliability has yet to be assessed (Hijmans and Elith, 2013). Maxent algorithm is used more frequently (Phillips et al., 2006), however, more algorithms need to be evaluated for a more comprehensive view.
SDMs have various applications in agriculture. In cultivated species such as Zea mays and Panicum virgatum, Maxent and SVM algorithms have been used to estimate the suitability of geographic regions in which these species can thrive (Evans et al., 2010). Information from SDMs can also provide phylogeographic references and infer historical events that attempt to explain the origin and genetic structure of populations (Carstens and Richards, 2007), although this must also be corroborated with molecular data. SDMs are used to monitor the availability ofpollinating insects, as well as to propose strategies to cope with any adverse changes in the environment that affect them (Polce et al., 2013). It is also possible to predict the suitability of noxious species (weeds and insects), forecast their location and distribution, and formulate strategies to mitigate socioeconomic damage in areas vulnerable to invasion (Lantschner et al., 2018). Other applications to be highlighted are the assessment of species richness, endemism, threatened habitats, protection and conservation of threatened species, diversity patterns, conservation studies, response to climate change, reintroduction of threatened species and the study of anthropic effects on the distribution of the species. Although many of these applications are used in animal species, they can also be applied to plant species (Mateo et al., 2011).
Area Under the Curve (AUC) is the most used statistic to measure the reliability of distribution models. This value corresponds to the probability that, by taking presence/absence data at random, the model assigns higher suitability values to presence data (Mateo et al., 2011). AUC has some limitations in its use, especially in species with a high range of adaptability (Lobo et al., 2007). However, through algorithms adjustments such as cross-validation, correlation analysis, Cohen's kappa, true skill statistic (TSS) and raising the number of presences to 20 or over, its consistency and performance can increase considerably (Hijmans and Elith, 2013).
The recalcitrance of S. edule seed does not allow it to be protected in ex situ germplasm banks, which is why suitable sites must be found to maintain and study S. edule accessions. Currently, work is being done on the creation of new germplasm banks to facilitate the access to genetic diversity for chayote producers, as well as to encourage the exchange of genetic material from farmers (Cadena-Iñiguez et al., 2013a).
The objective of this study was to determine the potential distribution of domesticated S. edule in Mexico using seven algorithms to calculate species distribution models, to efficiently manage the resources of S. edule and aid its conservation, identify geographical distribution patterns.
OCCURRENCE DATA
S. edule occurrence data were obtained from the Global Biodiversity Information Facility (GBIF, https://www.gbif.org/). Worldwide there are 2327 occurrence data, of which 983 are from Mexico. Data from these records were cleaned to remove entries with repeated coordinates, absence of coordinates, georeferencing errors and exclusion of wild specimens, leaving 162 occurrences data. SSDM package (Schmitt et al., 2017) selects pseudo-absences from randomly selected sites where a species is assumed to be absent. 25 % of the records were randomly selected for use in the test, while the remaining 75 % were used for training.
BIOCLIMATIC VARIABLES
The 19 bioclimatic variables of WorldClim version 2.1 from the period 1970-2000 was used, with a spatial resolution of 1 km2 (Fick and Hijmans, 2017). Raster models with spatial resolution of 1 km2 was added for elevation data in meters (Fick and Hijmans, 2017) (Table 1). Köppen-Geiger climate classification (Beck et al., 2018) and soil types from Harmonized World Soil Database version 1.2 (Fischer et al., 2008) were used to group occurrence data. Raster values for 22 layers were obtained using Point Sampling Tool of QGIS version 3.16.2 (QGIS Development Team, 2020). Specific locations of occurrence data were found using Physiographic Subprovinces from Digital Map of Mexico, prepared by National Institute of Statistical and Geographic Information (INEGI) (https://www.inegi.org.mx/temas/fisiografia/).
ANALYSIS AND PROCESSING
All packages mentioned in this paper were run using RStudio (R Core Team, 2020). The qualitative variables of climate and soil types were processed using tidyverse package (Wickham et al., 2019) with data presented in bar graphs, showing descriptive information. They were not included in SDM since climate type is correlated with bioclimatic variables related to precipitation such as bio12 (Table 1) (Evans et al., 2010), and soil type generally does not seem to restrict distribution due to the adaptability of the crop to different soil types (Lira et al., 2019). Pearson's correlation was calculated for raster values of 19 WorldClim bioclimatic variables and elevation. Variables with correlation values greater than 0.8 were eliminated to avoid affecting the models (Phillips et al., 2006) (Table 1).

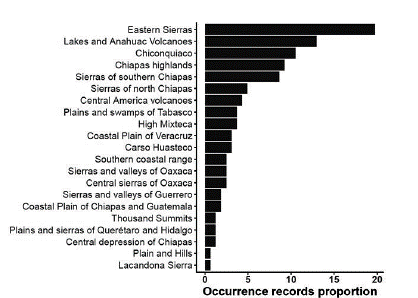
Figure 1 Occurrence data percentage ofS. edule for each physiographic subprovince (https://www.inegi.org.mx/temas/fisiografia/) in Mexico.
DISTRIBUTION MODELS
Seven common algorithms from literature were used: Generalized linear model that uses a weighted linear regression to arrive at the estimated maximum likelihood of the parameters (Hijmans and Elith, 2013); Generalized additive model, which is an algorithm that allows nonlinear responses to be directly modeled by smoothing the predictive variables (Wood, 2017); Generalized boosted regression model which is an algorithm that repeatedly fits many decision trees to improve model accuracy (Greenwell et al., 2020); Classification tree analysis is an algorithm that initiates a non-parametric structured approach for the evaluation and comparison of different options, thus helping to choose the most competitive alternative (Schmitt et al., 2017); Random Forest (RF) which is a regression-based algorithm in which bootstrap is used to select subsamples of the data and generate a large number of regression trees (Breiman, 2001); Maxent which is an algorithm that expresses a probability distribution where each cell of the grid has a predicted suitability of the conditions for the species (Phillips et al., 2006) and Vector Support Machines (SVM) (Vapnik, 1998) which uses a functional relationship called the kernel to map data into hyperspace where patterns can be represented more simply. Additionally, an assembly of the seven aforementioned models was executed through a weighted average of the outputs of the seven algorithms used (Schmitt et al., 2017). Likewise, dependencies gam (Hastie, 2020), stats (R Core Team, 2020), maxent (Hijmans et al., 2017), rpart (Therneau and Atkinson, 2019), gbm (Greenwell et al., 2020), randomForest (Liaw and Wiener, 2002) and e1071 (Meyer et al., 2019) were used. Threshold used was 0.5.
Regarding Maxent algorithm, ENMeval package (Muscarella et al., 2014) was used to optimize the model, hinge and threshold functions were deactivated to avoid overfitting response curves, the regularization multiplier was 0.75 and were activated linear, quadratic and product functions. For running the models, the protocol of Hijmans and Elith (2013) was followed. The model's adjustment was measured using AUC, where values > 0.5 indicate adequate models. However, AUC may present bias and variation in its values with the spatial extension to select bottom points (Lobo et al., 2007). To correct this problem, point distance sampling was used. This involved calculating the distance from the presence records for the training and test data sets, as well as the distance from the absence data for the training and test data sets (Hijmans, 2012; Hijmans and Elith, 2013). To evaluate the performance of the models the TSS was used, where TSS > 0.75 indicates excellent performance, 0.4 < TSS < 0.75 optimal performance and TSS < 0.4 poor performance (Eskildsen et al., 2013). The performance of the models and AUC and TSS calculation were carried out using SSDM package (Schmitt et al., 2017). The output raster layers were exported to QGIS Development Team version 3.16.2 (2020) for final editing of distribution model maps.
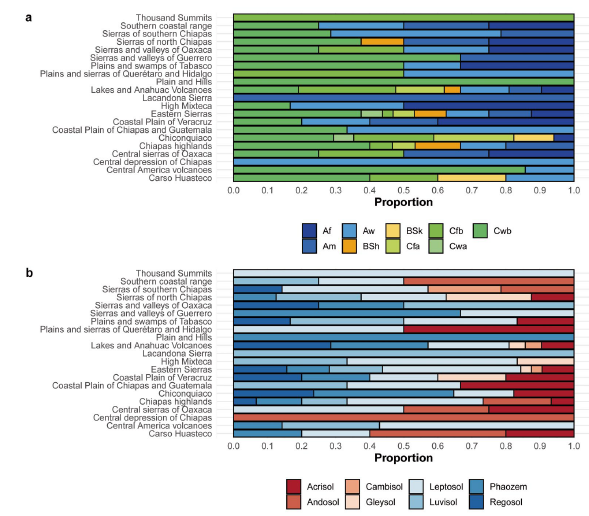
Figure 2 Physiographic subprovinces of Mexico. a. Climate types. Af = Tropical, rainforest; Am = Tropical monsoon; Aw = Tropical savannah; BSh = Arid, step, hot; BSk = Arid, step, cold; Cfa = Temperate, no dry season, hot summer; Cfb = Temperate, no dry season, warm summer; Cwa = Temperate, dry winter, hot summer; Cwb = Temperate, dry winter, warm summer. b. Soil types.
Table 2 Jacknife test for contribution (%) of variables to algorithms and statistics AUC and TSS.
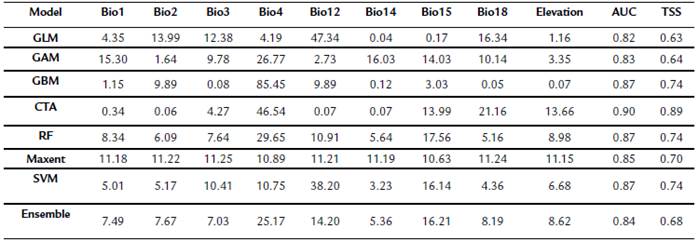
GLM: Generalized lineal model; GAM: Generalized additive model; GBM: Generalized boosted regression model; CTA: Classification tree analysis; RF: Random Forest, SVM: Support vector machines. bio1: annual mean temperature; bio2: mean diurnal range (mean of monthly (max temp - min temp)); bio3: isothermality; bio4: temperature seasonality; bio12: annual precipitation, bio14: precipitation of driest month; bio15: precipitation seasonality; bio18: precipitation of warmest quarter; AUC: Area under the curve, TSS: True skill statistic.
PHYSIOGRAPHY, CLIMATE, AND SOIL TYPES
Twenty-one physiographic subprovinces were registered for the 162 occurrence records, most of which correspond to the physiographic subprovinces of Eastern Sierra (20 %), Lakes and Anahuac volcanoes (13 %), Chiconquiaco (10.5 %), Chiapas highlands (9.5 %) and Sierras of southern Chiapas (8.5 %) (Fig. 1). Three climatic groups were found to be present in the occurrence records of S. edule according to the Köppen classification: tropical (A), dry (B) and temperate (C). The predominant type of climate was Cwb (temperate, dry winter, warm summer, 33.3 %), also known as temperate mountain with dry winter, followed by Aw (tropical monsoon, 17.9 %) and Af (tropical, rainforest, 11.7 %). In the physiographic subprovinces of Lakes and Anahuac volcanoes and Eastern Sierras, up to seven and eight different climatic types were seen, respectively. In Plains and Hills and the Sierra Lacandona, with few points of occurrence, the climates Cwb and Am predominated, respectively (Fig. 2a). Eight predominant soil groups are present in the occurrence records of S. edule, according to raster information from Fischer et al. (2008). Leptosol contributes 33.3 % of the total, phaozem 16.7 %, followed by luvisol and regosol, both contributing 13 % y 12.3 %, respectively. In some physiographic subprovinces, only one type of soil and climate predominated (Fig. 2).
DISTRIBUTION MODELS
The distribution models of S. edule in Mexico were inferred by layers bio1, bio2, bio3, bio4, bio12, bio14, bio15, bio18, and elevation, which were derived from correlation analysis. The AUC and TSS values for training and testing were averaged because they are very similar values. The CTA algorithm obtained the highest AUC score (0.90) In general, the AUC for the seven models was > 0.5 and they showed adequate performance (0.4 < TSS > 0.7) (Table 2).
The GLM algorithm (Fig. 3a) showed low suitability (0.210.40) for the states of Chiapas, Oaxaca, Guerrero, Puebla, Hidalgo y Veracruz. GAM model (Fig. 3b) showed results very similar to GLM algorithm. GBM algorithm showed areas of high suitability for regions of Chiapas, Oaxaca, Veracruz, the Yucatan peninsula and the western coastal zone of Mexico. (Fig. 3c). CTA algorithm showed areas of high suitability for the Mesoamerican region of Mexico (Fig. 3d). Surprisingly, moderate suitability was found in small regions in the north of the country, where the weather is generally drier with little precipitation. This can be explained by the coincidence of the clime arid, steppe and hot (BSh) and clime arid, steppe and cold (BSk) weather in certain occurrence records.
RF, Maxent and SVM algorithms showed very similar results in terms of suitable areas for S. edule (Fig. 4 a-c). The RF and MVS algorithms (Fig. 4a-c) showed similar maps, with areas of high suitability like those seen in the Maxent model but with smaller regions. The Maxent algorithm (Fig. 4b) has high suitability (> 0.81) zones similar to the RF and SVM models, however the high suitability was emphasised in large regions of Veracruz, Puebla, Hidalgo, Guerrero, Oaxaca and Chiapas. The assembly of the seven algorithms (Fig. 4d) showed zones of high suitability very similar to Maxent algorithm (Fig. 4b).
According to Jacknife test, the generalized algorithms (GLM and GAM) and SVM gave greater weight to variables related to precipitation (bio12 and bio14); while the GBM, CTA, RF algorithms had more influence of variables related to temperature (bio4). Maxent algorithm gave a fair percentage to all bioclimatic variables. The assembled model gave more importance to bio4 (Table 2).
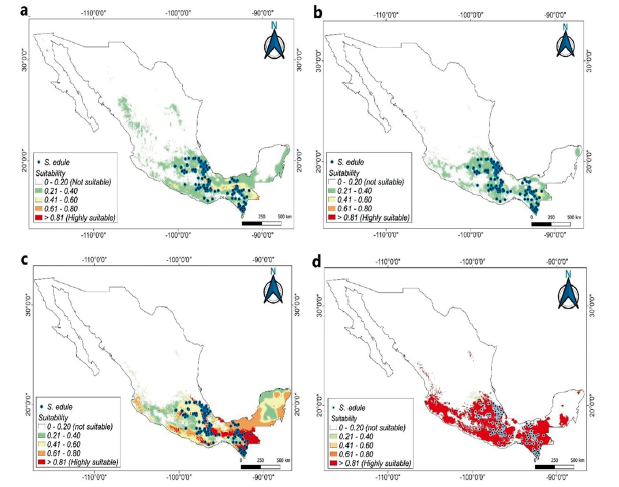
Figure 3 Distribution models for S. edule in Mexico. a. Generalized lineal model. b. Generalized additive model. c. Generalized boosted regressions model. d. Classification tree analysis.

DISCUSION
Annual mean temperature plays an important role in S. edule distribution, with an average of 20 °C across the 162 occurrences data. The optimum temperature range is 1 3-21 °C, as temperatures below this cause damage to the fruits, while those above 28 °C cause problems in flower and fruit retention (Lira, 1996). Wild populations of S. edule generally tend to be distributed in Am and Af climates, however, under growth conditions, cultivated S. edule can thrive in a diverse range of dry and temperate climates (Aung et al., 1990). The calcareous components of leptosols can immobilise the mineral nutrients in the soil and, in the case of chayote, can reduce the productivity and quality of the fruits (Cadena-Iñiguez, 2005). However, some leptosols may have small layers rich in organic matter, which is an edaphic requirement for chayote plantations (Lira, 1996). Phaozem, present in 50 % of physiographic subprovinces, are soils considered ideal for agriculture due to their high organic matter content. Ideal soils for chayote production must be well drained, rich in organic matter and have a pH of 4.5-6.5 (Lira, 1996), however, the different phenotypic variants of chayote enable a high level of adaptability to different types of soil (Lira et al., 2019).
High suitability zones (> 0.76) shown in the seven algorithms coincided with the presence of two species that are closely related to S. edule: S. chinantlense and S. compositum (Cross et al., 2006, Barrera et al., 2021). The varietals virens levis, nigrum spinosum, nigrum xalapensis, albus dulcis and albus minor are also distributed in these regions (González-Santos et al., 2017). When there are different ecotypes or populations of the same species, the species distribution algorithms can be considered representative of the entire species (Mateo et al., 2011). Although distribution models are applicable for wild species, S. edule populations are domesticated and very few of them are cultivated, for example, the case of varietal complexes virens levis and nigrum xalapensis. However, the before mentioned varietal complexes of S. edule are vulnerable in these same areas. The risk of genetic erosion in these places is mainly due to the presence of new improved varieties that are displacing semi-domesticated populations, which generally have fruit with morphological characteristics not suitable for the market, such as the presence of thorns, small size, and bitter flavour. Also, the introduction of crops such as coffee causes a decrease in S. edule populations (Cadena-Iñiguez, 2005). In 2007, to counteract the effects of genetic erosion, the Sechium spp. germplasm bank was created in Huatusco, Veracruz (a geographic site in an area of high suitability according to this study), where domesticated and wild variants from different parts of Mexico and Central America are protected in situ (Cadena-Iñiguez and Arévalo- Galarza, 2011).
In this study, only occurrence data pertaining to cultivated S. edule were considered. However, in a study by Lira et al. (2018) using Maxent algorithm, only occurrence data for wild S. edule were used and their results are very similar to those from this study using Maxent model. This is because ecological requirements of cultivated and wild S. edule are similar. The evolutionary history of S. edule can complement the analysis ofdistribution models. The first wild populations of S. edule originated in the states of Guerrero, Chiapas, and Veracruz. Hybridisation between populations and varietals of S. edule, as well as with S. chinantlense and S. compositum species, together with adaptive specialisation, have led to new phenotypic variants adapted to different environmental conditions and thus have dispersed to new regions with human help.
Regarding S. edule,González-Santos et al. (2017) evaluated 106 occurrence data belonging to five chayote varietals, which were modelled using the 19 bioclimatic layers of World Clim and the Maxent algorithm to forecast the effect of climate change on the distribution of these varietals in the year 2050. Some varieties such as nigrum spinosum will lose around 50 % of their current distribution, while others such as virens levis will maintain and slightly increase their distribution, since this varietal is the very valuable and is commonly used in breeding (Cadena-Iñiguez and Arévalo-Galarza, 2011; Cadena-Iñiguez et al., 2013a). Otherwise, most of the chayote varietals are found semi-domesticated in domestic gardens and cloud forest areas, the latter being highly disturbed by human activities (Lira, 1995).
Sechium edule is a species that can thrive in different climatic conditions. Because of this, the AUC values can be close to one, but are unreliable, as the range of values for each variable obtained from large databases is very wide. Although the chayote varietals differ morphologically, the differences are not very noticeable when the values of the bioclimatic variables are compared (González-Santos et al., 2017). Therefore, the models used may be representative of all S. edule populations (Mateo et al., 2011). Species distribution can also be limited by other factors that must be considered, but it can be difficult to incorporate into distribution models. For example, competition with other species, pollination and human influence can all affect distribution. It is necessary to evaluate different models to gain a broad perspective on the distribution of species.
CONCLUSIONS
Cultivated populations of S. edule thrive in a wide range of climate and soil types. CTA was found to produce the best distribution model according to the AUC statistics. However, all seven models were relatively adequate to explain the distribution of S. edule in Mexico. The areas of high suitability were found in regions of the states of Chiapas, Guerrero, Oaxaca, Veracruz, Tabasco, Puebla, and Hidalgo, which should be considered as high priority areas for conservation and breeding. The distribution of domesticated S. edule in Mexico, according to the algorithms studied, is limited to total annual precipitation and temperature seasonality.
Climatic adaptability of S. edule also allows it to be distributed towards the Yucatan Peninsula and western Mexico.

