


 Inglês (pdf)
 Artigo em XML
 Referências do artigo
 Enviar este artigo por email
 Citado por SciELO
  Citado por Google
  Similares em
SciELO
Similares em
SciELO  Similares em Google
 Permalink
I. Introduction
Since the onset of the 2019 coronavirus outbreak, research has extensively explored the evolution of the pandemic [1]. Public attention has focused on new cases and fatalities, highlighting the need for systematic evidence derivation [2]. The significance of reliably interpreting and modeling pandemic data is evident [2,3], yet gaps persist in understanding virus spread between urban sectors, the impact of risk-mitigating public policies, and subsequent spillover effects [3,19].
Authors have delved into causal factors, emphasizing socioeconomic status, human mobility, and disease dissemination [1-9]. The identified connections resonate with long-established findings [6,7]; however, the availability of extensive data has empowered more precise diagnostic approaches, thus enabling investigations into virus diffusion among distinct social cohorts.
Pre-existing mobility patterns played a pivotal role in potential disease propagation [5,10,32], with extensive mobility and intricate transport network interconnections expediting virus transmission [5]. Mobility restrictions responded to the pandemic, diverting outbreaks, and alleviating healthcare strain. However, measures including curfews, lockdowns, quarantines, and social distancing, not only impinged on freedom but also entailed intricacies and costs. Moreover, efficacy and ramifications were contingent on timing, sector, and scale [9]. Previous research delved into theoretical and empirical mobility restrictions, mainly focusing on international travel [10,11,17,18,26], overshadowing understanding localized virus propagation within communities and urban contexts.
Cities emerge as intricate social constructs, their narratives inscribed in the tapestry of space-time interplay yield a holistic tapestry molded by the choices orchestrated to unravel such intricacies [12-14,28,29,30]. The rapid proliferation of the coronavirus draws a conceivable link to the heterotopic nature characterizing urban areas [19]. Notably, contagion can propagate through direct interactions among individuals within these urban spaces or indirectly via virus-laden droplets that linger in poorly ventilated environments for extended durations [31,32]. Additionally, distinct vectors could serve as conduits, ferrying the virus to distant corners of the city [21,27].
Scrutinizing data on residential segregation, facilitating discernment of interplays amid diverse societal factions within urban landscapes [12,13], alongside an exploration of urban design and interconnectedness, emerges as the linchpin to decipher contagion patterns woven by the coronavirus within urban contexts.
Our investigation focused on the Metropolitan Area of Santiago (SMA), Chile; a Latin-American metropolis with a population of 8,125,072 individuals, which represent roughly 42% of the nation [12-14]. Characterized by pronounced residential segregation across 34 communes [14], the SMA reflects patterns common in global south urban centers [14,19]. Furthermore, certain SMA communes exhibit a heightened concentration of functional activities, fostering the emergence of functional sub-centralities. Even though Chile implemented extensive social restrictions, its crisis management was among the least effective globally [15,16]. We postulate that shortcomings lie in the application of restrictive measures devoid of a comprehensive grasp of the dynamics inherent in a segregated metropolis. Thus, our study provides empirical substantiation of the diminished efficacy of adopting stringent measures, which could potentially have exacerbated contagion in low-income communities [19,20].
Analyzing data on residential segregation unveils potential interactions among diverse social factions within urban landscapes [13,19-21,27,28]. The organizational fabric and interwoven connections within urban environments emerge as pivotal components for unveiling underlying patterns dictating the coronavirus dissemination. The SMA, marked by clear geographical distinctions that separate communes with diverse functionalities from those primarily residential, presents an ideal subject for a comprehensive case study. Such a study aims to unravel the intricate diffusion patterns of COVID-19 within urban areas. Recent investigations have underscored a robust correlation between the social determinants of health and the impact the pandemic had on the SMA [20]. However, these studies adopt a static perspective, overlooking the dynamic interplay of these factors across different urban zones and throughout the pandemic's evolution. Consequently, a profound exploration of the dynamics and varying weights of diverse drivers in COVID-19 spread remains an unexplored avenue.
II. Methodology
We extracted mobility indices from the Telefónica company's cellular telephone antenna network using publicly available data [34]. The Internal Mobility Index measures trips within a commune, normalized by the number of devices, while the External Mobility Index gauges trips across commune borders, normalized by the number of devices. The sum of these is the Mobility Index. COVID-19 case data from the Ministry of Sciences [22] and urban data [35] were also employed. Aggregating the data at the commune level, we compiled a dataset with 80 variables, including socioeconomic, mobility, and epidemiological covariates. Among these, two are identifiers, 77 are predictors, and one is the target variable - cumulative COVID-19 cases per 100,000 inhabitants. Our analysis focuses on understanding the impact of mobility on the cumulative rate of COVID-19 cases by examining its varied influence across different communes of the SMA throughout the pandemic.
The SMA communes are characterized by different socioeconomic indicators and also respond differently to the mobility restrictions imposed by the authorities, thus creating a complex context that we want to understand. First, to extract the contagion patterns, we use time-varying coefficient linear regression models y t =X t β t + ϵ t ; 𝑡=1…𝑇. Where 𝑋 𝑡 = 𝑥 1 𝑡 , 𝑥 2 𝑡 ,…, 𝑥 𝑝 𝑡 , and 𝛽 𝑡 = 𝛽 1 𝑡 , 𝛽 2 𝑡 ,…, 𝛽 𝑝 𝑡 are variable vectors and parameter vectors, respectively, and 𝜖 𝑡 is a normal distributed random variable. We consider the effect of mobility, measured by the internal mobility index 𝑥 1 𝑡 on the cumulative rate of COVID-19 cases per 100,000 inhabitants (the target variable 𝑦(𝑡)), and use two approaches concerning the available data to construct regressions. In the first approach, the commune is established and time runs; hence, we capture the variations of the regression coefficient 𝛽 1 𝑡 over time for each commune. We obtained 34 models, one for each SMA commune, and look for patterns in them. In the second approach, the time is established and a linear regression model is built; each observation represents the mobility index and the rate of accumulated COVID-19 cases per 100,000 inhabitants per commune on the specified day. In this way, the positioning of the communes according to these two variables can be highlighted, thus illustrating the differentiated effect of these variables on each commune. From there, 215 models are obtained, one for each day during the pandemic study period, and we look for patterns in them.
Through our mobility analysis, we identified a three-stage pattern that remarkably aligns with the nuanced impact of socioeconomic variables and interventions governing mobility restrictions. To elucidate these intricate dynamics, we developed stage-specific linear regression models to forecast the cumulative count of COVID-19 cases. Tailored for each of the three identified stages, these models incorporate the entire spectrum of variables as predictive elements, acknowledging the transformative influence of mobility restriction measures on the unfolding context of the pandemic. To avoid poorly determined coefficients with high variance in the applied regressions due to the many and correlated variables, we use the Elastic-Net-Penalty method [23]. It provides feature selection by imposing a size constraint on the coefficients, thus allowing us to build a reduced subset of variables with high predictive value at each stage. The Elastic Net, a combination of L1 (Least Absolute Shrinkage and Selection Operator: Lasso) and L2 (Ridge) penalties, overcomes the limitations of Lasso in handling highly correlated features by integrating the L2 penalty. It retains Lasso's property of inducing sparsity for automatic feature selection. The flexibility to adjust L1 and L2 contributions via hyperparameters makes Elastic Net preferable when balancing feature selection and managing correlated predictors is crucial. Cross-validation optimizes hyperparameters for peak performance. We used the R package GLMNET [33] for computations. In comparison to other methods such as Support Vector Regression (SVR), Elastic Net offers greater interpretability. While Principal Component Regression (PCR) effectively addresses multicollinearity by transforming variables into components; however, the resulting linear combinations are less interpretable. Elastic Net, with its coefficient-based interpretability, emerged as a pragmatic and ad hoc choice for our dataset.
At each stage, we observed a distinct subset of variables with varying importance indicators, underscoring the differential drivers that show up in each phase. After feature selection, three types of variables persist: 1) mobility descriptors; 2) indicators of social vulnerability; and 3) metrics reflecting economic conditions. Employing this subset, model parameter estimation is performed through cross-validation. Coefficient values from the best cross-validated model (minimizing cross-validated residuals) are then scaled up to 100, providing a measure of the variables' importance or predictive power at each stage.
II. Results
A. The Role of Human Mobility and Spatial Segregation on COVID-19 Spread
The high-income communes, within the 80th percentile or higher, exhibited an average Mobility Index of 12.13, while the low-income communes recorded an average mobility of 8.35 (adjusted for commune population). We validated the difference between means using the Welch two-sample t-test with a 95% confidence interval. The test result yields an interval that does not contain zero and a p-value = 2.2(10-16. These findings indicate that high-income communes have a considerably higher mobility index than those of low-income.
As of October 30, 2020 (the last date analyzed in this study), the total rate of cumulative COVID-19 cases per 100,000 inhabitants in high-income communes was 3,148 (7,255 cases), compared to 6,377 (27,323 cases) in low-income communes - indicating a rate twice as high (or almost four times more cases).
While mobility is a crucial factor in virus spread, these numbers suggest the involvement of factors beyond mobility. These drivers may act at different stages of the pandemic, and their influence can be altered by control measures, modifying the complex and adaptive context of virus spread.
The initial COVID-19 cases emerged in the wealthiest communes of the SMA. As of March 30, 2020, communes with the highest rates in the country included Lo Barnechea (54.8, 68 cases), Las Condes (54.7, 181 cases), and Providencia (52.0, 82 cases) - all characterized by the highest income per capita and a concentration of essential urban functions, generating functional sub-centralities [14].
Pre-existing mobility patterns delineate potential routes for disease transmission [14,21,25]. Before the pandemic, the Santiago Metropolitan Area (SMA) exhibited well-defined and regular mobility patterns. Origin-Destination matrices of public transport [21,24,25] reveal that 4% to 8% of the population in low-income SMA communes daily commute to four higher-income communes (Las Condes, Vitacura, Lo Barnechea, and Providencia) using public transport. In the case of Puente Alto (the low-income commune with the highest cumulative COVID-19 cases to date), over 25,000 people move daily to high-risk areas and back. This underscores the role of urban public transport as a significant vector in the initial phase of the pandemic [21].
Collected and analyzed data allowed us to define three stages of the pandemic's progression in the Santiago Metropolitan Area (SMA): (A) the initial phase in March 2020; (B) around the peak at the end of May 2020; and (C) in October 2020, where cases had stabilized concerning their earlier rising rates. Fig. 1 presents the median Mobility Index against the median cumulative number of cases for the entire SMA, calculated across all communes from March 26 to October 30, 2020 (refer to Fig 1 for illustration).
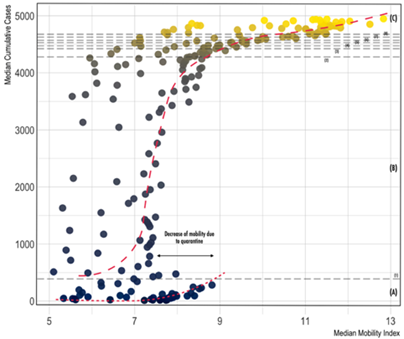
Fig. 1 Three-stage pattern of the pandemic evolution in SMA (A, B, C) in relation to cumulative cases and Mobility Index.
Figure 1 incorporates intervention events marked by dashed lines, primarily mobility restrictions, detailed in supplementary material Appendix A. The dashed red line depicts the trend of the relationship between mobility and the cumulative number of cases at each stage. As the cumulative cases are a non-decreasing function of time, the vertical axis can also represent the time axis, indicating the sequential occurrence of stages (A), (B), and (C) during the analysis period.
The impact of mobility varies across communes throughout the pandemic. To investigate, we set the date and observe the commune distribution based on the internal mobility index and the rate of accumulated cases per 100,000 inhabitants. This analysis is conducted daily, accompanied by a regression model, and the coefficient of determination (R2) is calculated. Fig. 2 presents the results, with thick broken lines denoting stages (A), (B), and (C) of the pandemic. Notably, at the beginning of stage (A), mobility accounts for over 50% of the variance in the target variable. However, R2 declines just before stage (B), where mobility initially loses predictive value but gradually recovers with signs of quarantine fatigue. At stage (C), without quarantine, the coefficient of determination peaks and stabilizes (see Fig. 2 for details).
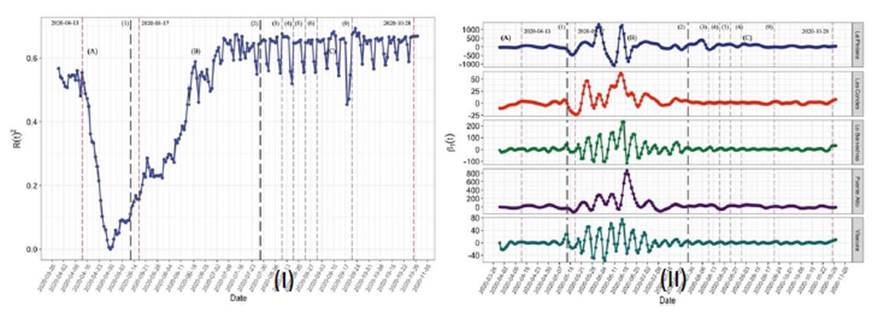
Fig. 2 (I) The coefficient of determination R2 for a linear regression model with the internal mobility index as a predictor variable and the rate of accumulated cases per 100,000 inhabitants as the target variable constructed for each day of the observation period. (II) Temporal evolution of the regression coefficients corresponding to the explanatory variable - Internal Mobility, and the target variable - Rate of accumulated cases per 100,000 inhabitants for a sample of the SMA communes. The panel shows three stages of the pandemic in dashed lines and relevant dates in the mobility restriction measures.
To analyze the different behaviors in each stage, we took three dates and studied the distribution of the communes at each stage of the pandemic. The dates are marked with the dashed red lines in Figure 2.
First stage (A): First contagions in the Metropolitan Area and the dynamic quarantine strategy. During the initial stage of the pandemic evolution, a positive correlation between human mobility, quantified by the Mobility Index, and the cumulative cases of COVID-19 is evident. A distinct pattern emerges, where high-income communes exhibit both elevated mobility and a higher number of cases. Therefore, they are particularly influential in virus dissemination and designate high-risk communes. Concurrently, low-income communes experience minimal or no instances of COVID-19 cases (refer to Figure 3-I).
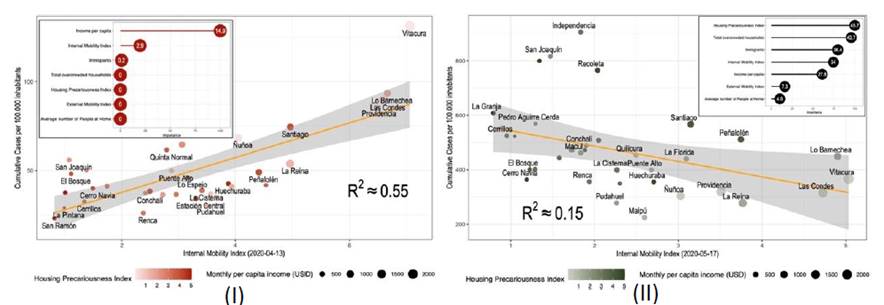
Fig. 3 Mobility Index in relation to cumulative cases of COVID-19 per communes in SMA. Panel I represent March 2020, Panel II represents May 2020. For both panels, the size of the bubbles is proportional to the income per capita at each commune, and the color represents the commune Housing Precariousness Index.
It could be inferred that total and effective isolation of these high-risk communes at this early stage of the pandemic would have significantly reduced contagion [17]. A regression model indicates that mobility alone explains about 55% of the observed cases’ variability (R2 ( 0.55) in this phase of the pandemic, becoming a major driver of contagion. Figure 3-I shows a scatter diagram in which the horizontal axis stands for the Internal Mobility Index, and the vertical axis represents the cumulative number of COVID-19 cases per 100,000 inhabitants. The size of the bubbles is proportional to the income per capita at each commune, and the color represents the commune Housing Precariousness Index (Synthetic Index that indicates the material quality of the housing in walls, floors, and roofs according to their construction attributes recorded in the 2017 National Census). Figure 6 panel (I) presents a geographical view of this stage. As can be seen, the highest-income communes (on the eastern side of SMA) concentrate practically all COVID-19 cases at this initial stage of the pandemic. The absolute coefficients of the optimal Elastic-Net model are scaled up to 100, highlighting the importance of model variables. The inset in Figure 3-I reveals crucial variables (with the highest predictive power) during this stage, with Income per Capita and Mobility emerging as the most influential. Subsequently, from March 26, 2020, the start of partial and dynamic quarantines leads to a diminishing correlation between the number of cases and mobility.
Second stage (B): Total quarantine. In this stage, human mobility plays a less important role in the spread of contagion. Indeed, although the internal mobility in each commune is still a relevant factor, the correlation between mobility and the COVID-19 cumulative cases is significantly lower for this period. The mobility only explains 15% of data variance (see Figure 3-II). The socioeconomic inequities are evident in the SMA communes at this stage. Even though mobility restriction measures are being applied, the number of cases rises steadily and sharply in the poorest communes. Therefore, other determinants (for example, Housing Precariousness Index) play a predominant role in spreading the virus. The inset in Fig 3-II shows the importance of the explanatory variables in this period, and an indicator of social inequality in the SMA, such as the Housing Precariousness Index, clearly acquires more relevance. This index alone explains 41% of the variance of the accumulated cases (R2 ( 0.41). By May 15, 2020, a complete quarantine is enforced. Initially, there is a marginal reduction in mobility with the implementation of these restrictive measures; however, as depicted in Fig. 1, a gradual and persistent increase in mobility persists throughout this period. The delayed application of restrictions, influenced by the spread of infection to the lowest-income communes, appears evident. A convergence of social vulnerability, continual internal mobility, and the inability to mitigate exposure in high-risk zones [17,19-21] renders the restriction measures ineffective in positively impacting the poorest communes. Figure 5, panel (II), provides a geographical representation of this scenario. The pandemic's focal point shifts towards the central and southern communes of the city, unfortunately affecting those areas with the highest vulnerability. This marked a turning point in the pandemic progression in the Santiago Metropolitan Region, after which the spread became irreversibly extensive.
Third stage (C): Critical situation in vulnerable areas of the city. By October 2020, the situation has changed. The mobility has been increased. The wealthiest communes have the highest values in the Mobility Index, while the number of cases in these communes was decreasing. Figure 4 shows a scatter diagram illustrating this stage of the pandemic.
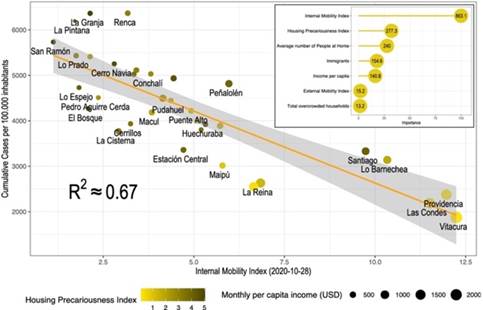
Fig. 4 Mobility Index in relation to cumulative cases of COVID-19 per communes in SMA by October 2020.
Again, clear patterns can be seen in the distribution of the communes. On the right, with high mobility and a low number of cases, there are the communes with the highest income; on the left, with less mobility but with a much higher number of cases, the low-income communes. In this period, internal mobility is a variable that explains 67% of the variance for the observed cases (R2 ( 0.67); besides, other determinants, such as socioeconomic conditions and vulnerability, are fundamental to explain the observed contagion patterns. Indeed, in the inset of Figure 4, the Internal Mobility Index, Housing Precariousness Index, and Average number of People at Home appear as the most important variables at this stage. The last two indices are social indicators, but they also point to the spread of the virus where overcrowding is a very high-risk factor.
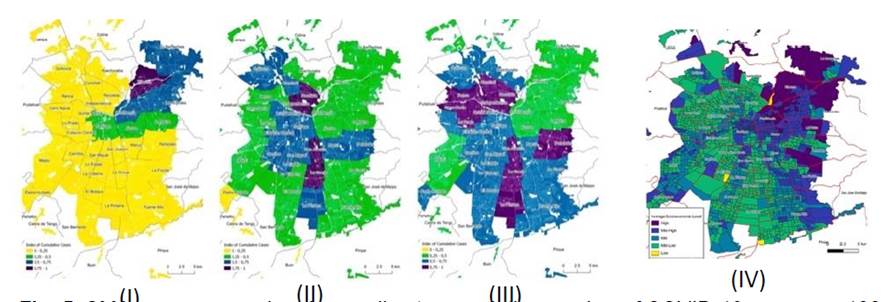
Fig. 5 SMA communes colored according to cumulative number of COVID-19 cases per 100,000 inhabitants atat each stage. (I) corresponds to stage A, (II) to stage B, and (III) to stage C (Source: created by the authors). (I) SMA communes with color that represents the average socioeconomic level per census tract, 2017 [35].
Figure 5, panel (III) presents a geographical view of this situation, which shows the spread of contagion in all SMA communes, but with an apparent decrease in the number of cases in the wealthiest communes located in the eastern sector of the city. The sustained increase in mobility and the presence of a significant number of cases trigger a regrowth or “second wave.” The first signs of this outbreak can already be seen in Fig 1. The curves at the top (corresponding to the end of October 2020) show an increase in the growth rates of COVID-19 cases.
Mobility in each commune and through time: Examining the impact of mobility on the cumulative case rate per 100,000 residents over time, with a focus on individual communes, is crucial. Figure 2-II illustrates the dynamic evolution of the regression coefficient across different stages of the pandemic for a selected set of five communes. The highlighted stages delineate the pandemic's progression, with noticeable coefficient variability, particularly at stage (B). During this stage, the effects of mobility restriction measures exhibit heterogeneous impacts across communes, characterized by diverse scales and trends, often displaying opposing signs. The interventions by authorities yield intricate and unpredictable scenarios, making the ordering or categorization of communes based on mobility and case rates challenging. This observation underscores the complexity of mobility's role at this stage (see Figure 2). The influence of interventions triggers a contextual response, adapting to new conditions. Additionally, factors beyond mobility, associated with the distinct socio-economic conditions of each commune (such as overcrowding and precarious living conditions), contribute to the altered reality. This dynamic fosters pathways for virus propagation within low-income communes.
IV. Discussion
In this study, we delved into the socio-spatial intricacies of the Metropolitan Area of Santiago (SMA), a vast Latin-American metropolis with pronounced residential segregation, mirroring traits common in global south cities. Leveraging Telefónica-Movistar Call Details Records data from 1.4 million users, our analysis encompassed comprehensive evaluation of SMA's human mobility patterns. Augmented by socio-economic and epidemiological covariates, our investigation successfully unraveled the nuanced dynamics steering virus transmission. Contrary to conventional perspectives, which primarily view mobility as a vector for contagion, our study transcends this limitation. It reveals that factors such as disparate service distribution, overcrowding, inadequate housing, and public transport routes act as hidden catalysts, playing pivotal roles in virus transmission. Our dynamic socio-spatial assessment breathes new life into traditionally static analyses of social inequality, capturing the rhythmic cadence of urban life and showcasing the nuanced interplay of social determinants across time and space, influencing virus transmission differentially among societal segments. The nexus between socially segregated groups navigating unequal urban access emerges as a focal point. Affluent residents in wealthy communes, benefiting from self-contained hubs of diverse services, can effectively circumvent infection risks. In contrast, impoverished areas face challenges due to limited services and increased overcrowding risks. Dependency on public transit, which is inhospitable to social distancing, further amplifies these risks. Recognizing cities as intricate systems, our study emphasizes the need for swift, targeted interventions supported by financial assistance, highlighting the failures of delayed quarantine measures that allowed the virus to infiltrate distant essential worker communities.
Our findings underscore the significance of mobility-centric policies in segregated urban contexts, revealing diverse contagion outcomes. The study's implications extend to global crisis management assessments, untangling COVID-19's spatial spread across epidemiological, socio-economic, geospatial, mobility-related, and intervention-related domains. Critical intervention timing emerges as a pivotal consideration, providing a blueprint for future pandemics or potential COVID-19 resurgences. The intricate cascade of consequences resulting from the interplay of different drivers across contagion stages defies facile predictions, emphasizing the variable impact on diverse population segments.

