


 Inglês (pdf)
 Artigo em XML
 Referências do artigo
 Enviar este artigo por email
 Citado por SciELO
  Citado por Google
  Similares em
SciELO
Similares em
SciELO  Similares em Google
 Permalink
1. Introduction
In the period between 1980 and 2000 the total world population went from 4,400 to 6,000 million people, and by 2015 that total had increased to approximately 6,900 million [1]. This reflects how population growth has accelerated in recent years and it is expected that by the year 2050 there will be a total of 9 billion people worldwide [2]. These figures show that population growth will continue increasing in the coming years, which, as a direct consequence, would lead to an unprecedented degradation of land resources if not used properly [3]. One of the reasons why this environmental deterioration occurs as the population increases are the different changes in land use, induced mainly by humans, such as the use of tropical forests to food production, i.e. for agricultural use. It is thus, that soil transformations for agricultural purposes, given by the expansion of arable land and plantations, have come in recent decades with a large consumption of energy, water, fertilizers and pesticides, which in turn cause losses on biodiversity and environmental impacts on different ecosystems [4]. Because of this, it is necessary to establish preventive and mitigating measures that allow efficient use of land, which would imply maintaining a balance between human activities undertaken in the agricultural sector and the environment, reducing the environmental footprint as much as possible [2].
Regulatory bodies responsible for enforcing environmental legislation, like the Environmental Protection Agency - EPA and the European Commission, together with the increasing sensitivity of community to this problems, pose challenges for the supply of agri-food chains. In 2015, EPA proposed stricter standards to certify restricted-use pesticides applicators [5], helping communities to remain safe while environmental risks are reduced [5]. On the other hand, the European Commission, through the Common Environmental Policy -CAP, promotes the development of agricultural practices that preserve the environment, while the field benefits from it [6]. In this way, it is essential to generate high quality products with added value, at the same time natural resources are protected and there is sustainable development [7,8].
Plantain is considered a commodity in the standard basket and a source of employment and income in tropical countries such as Uganda, where there is a 27.2% of involvement in world production, followed by Nigeria, Ghana and Colombia with 8.8%, 8.6% and 8.2% of production respectively [9]. In Colombia, this crop predominates in association with coffee, cocoa, yucca and fruit trees (87%) and the remaining 13% as monoculture, with an estimated total area of 840,765 ha [10,11]. Specifically, in the department of Antioquia, plantain producing regions are Uraba and the Southwest. In Urabá it is cultivated under the modality of monoculture plantations while in the Southwest as crops associated with coffee [12].
Taking into account the importance of plantain in the standard basket and in Colombian economy, it is essential to implement tools that allow, first to assess the environmental impact along the chain and, second, to propose sustainable strategies in order to minimize the impact associated with it in the plantain sector in Colombia. Therefore, in this research the environmental burden was evaluated using LCA as a management tool for three plantain agroecosystems associated with coffee, located in the municipalities of Jardín and Hispania in Southwest Antioquia (Colombia), contributing this way to establish environmentally and economically sustainable crops for small farmers in these regions. Using the cradle to gate scope for a functional unit of 1 kg of plantain and 1 kg of dry parchment coffee, global warming, aquatic eutrophication, soil acidification, aquatic ecotoxicity and land use were assessed using Umberto NXT software 7.1.8XT impact methodology 7.1.8. RECIPE 2008.
2. Materials and methods
The analysis was carried out following the phases proposed in ISO 14040 (2006): (1) objective definition and scope, (2) inventory analysis, (3) environmental impact assessment and (4) interpretation of results.
2.1. Characterization of productive systems
Three plantain in association with coffee agroecosystems were selected in the municipalities of Hispania and Jardín in the Southwest of Antioquia (Colombia) based on plantain productivity categorized according to the weight of the bunch as follows: Between 10-15 kg of plantain cluster weight, the agroecosystems located in the municipality of Hispania were classified as low productivity; between 15-20 kg on average, and between 20-25 kg, both located in the municipality of Jardín, were classified as high productivity [13]. The processes, formed by inputs and outputs, were established depending on each agroecosystem and on the final product.
2.2. Objective definition and scope
The average production was monitored during one year and it was limited to all input and output data, from the acquisition of raw materials needed for crops establishment in the three agroecosystems selected, until the plantain and dry parchment coffee were taken to the market, that is, from cradle to gate (Fig. 1) [14]. In addition, 1 kg of plantain and 1 kg of dry parchment coffee were taken as a functional unit, and the identified impacts were classified and characterized from these data.

2.3. Inventory analysis
A survey that took into account general questions of the family structure, crop management and the number of lots and the area of planting, followed by a series of sections referring to the use of the water, energy and final disposal of organic and inorganic waste in crops was designed for the capture of primary information. The second section included variables such as fuel consumption for transport and equipment, organic and inorganic waste generation and use of agricultural supplies. In order to corroborate the information, each farm was monitored weekly via telephone and visited every month. The survey was carried out during five months by the owner and/or employees [14,15]. Along with the applied survey, staff related to the plantain and coffee production chain sectors, such as suppliers and cooperatives were interviewed. The interview included questions about the distribution in product markets and waste management. On the other hand, secondary information of the processes such as production of fertilizers and other agricultural supplies was taken from Ecoinvent v3.1 database [16].
Collected data were converted to kg/ ha/year through specific ratios for each input and product, and were processed in Umberto NXT Universal 7.1.8 software that allows modeling, calculating and visualizing material and energy flows along of the life cycle in production systems. In this way, environmental results were obtained [17,18].
Since crops were associated in the agroecosystems, each crop percentage of representativeness was estimated into itself, associating the number of plants with respect to the total.
2.4. Environmental impact assessment
Global warming, aquatic eutrophication, terrestrial acidification, aquatic ecotoxicity and land use were selected as impact categories [19,20].
These categories were calculated using RECIPE 2008 methodology, which includes the determination of environmental impacts of mid-point and end-point [21]
This method was selected because it gives the possibility to assess the environmental burden in different impact categories [22,23].
2.5. Description of the process
The stages considered for both crops, plantain and coffee were: establishment, production, postharvest and distribution. The following are the considerations taken into account for each of these stages in the respective crops:
2.5.1. Plantain
At establishment stage for plantain crop the vegetative phase was taken into account [24]. Among the supplies needed for the establishment of the crop, there are correctives, fertilizers and disinfectants, as well as the fuel used in transport and equipment operation (Table 2). For each agroecosystem, the number of plantain seeds established per ha/year was taken into account, which along with survey records, allowed to calculate each input and output of the necessary process to establish 1ha of plantain crop.
Table 1 Categorization of agroecosystems based on plantain production
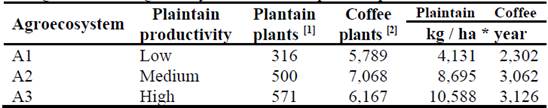
[1] Number of plants per ha. [2] kg cps
Source: The Authors.
On the other hand, at production stage, the floral and fruiting phase of the plantain were took in consideration [24]. Inputs to the process consisted of fertilizers, disinfectants, polyethylene bags, fibers, tapes, elastic bands and the fuel consumption used in the transportation needed to purchase these materials and supplies (Table 2).
Table 2 Consumption of materials, inputs and energy, and distance traveled to transport them at each stage [1]
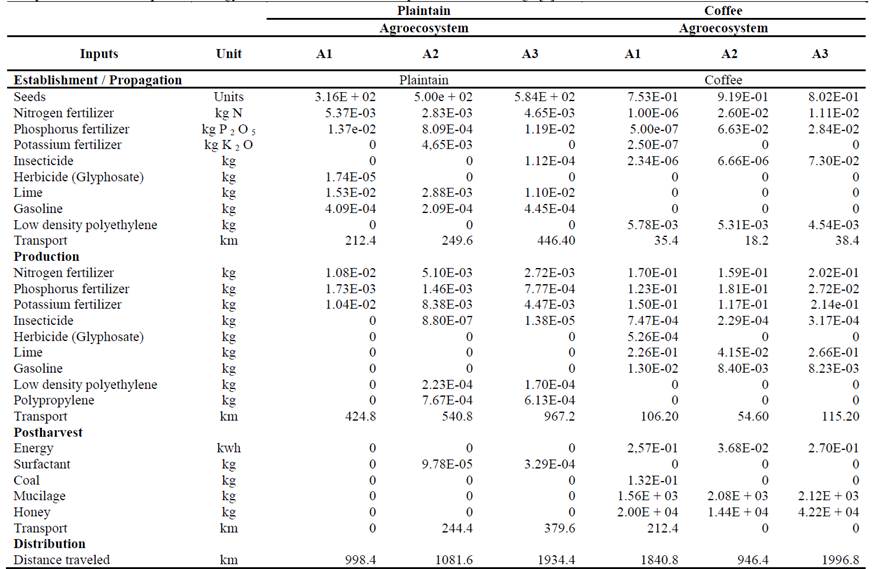
[1] Functional unit: 1 kg of plaintain and 1 kg of dry parchment coffee
Source: The Authors.
For the postharvest stage, the application of a shampoo necessary to remove the latex - a milky substance produced during the plantain cuts [25]- was considered as well as the stem, the sheath and the refusal of the fruit. The final product yielded the kg of fruit sold per ha / year (Table 2).
Finally, distance was calculated in the distribution to determine the fuel consumption from each agroecosystem to the marketer who is in charge of placing the plantain in the market (Table 2).
2.5.2. Coffee
At establishment stage in the coffee crop, the germinator and seedling phases were taken into account [26]. Based on the coffee seeds used in each agroecosystem expressed in ha/year and the results of the surveys, the identified supplies were fertilizers, pesticides and low density polyethylene needed to establish 1ha of a coffee cultivation (Table 2). At the production stage activities since the establishment of the crop to the manual harvesting of cherry coffee [26] were included. Inputs such as fertilizers, correctives, pesticides and gasoline necessary for mowing were taken into account (Table 2). The post-harvest stage involved all the operations performed in the humid benefit: pulping, fermentation, washing and drying (Table 2). The correlation between cherry coffee and parchment coffee was 4.5, while pulped coffee involved 60% of cherry coffee [27]. The pulp and the mucilage were organic wastes that were quantified because they are highly contaminant [28]. Finally, in the distribution, the distance was calculated to determine the fuel consumption from the location of each agroecosystem to the marketer (Table 2).
3. Results and discussion
3.1. Characterization of productive systems
The variables taken into account in productive systems characterization were the level of productivity (low, medium and high), planting density (number of plants per ha) and productivity (k /ha* year) (Table 1). On the one hand, although the production systems were initially classified by plantain productivity level as low, medium or high, there was a correspondence in the classification by production categories for both crops, plantain and coffee (Table 1). With respect of planting density, due to the crops of the present research are associated, the densities of the plantains are lower than in monoculture, where there are approximately 1,500 to 3,000 plants per ha [29]. For this same variable, studied agroecosystems showed higher planting densities for both plantain and coffee crops compared to other studies reported in the literature. In this way [30] indicates that in a coffee system which is interleaved with plantain, the plantain may have a density of 278 plants per ha whereas coffee may have 5,000 plants per ha (Table 1). Finally, for the production variable, expressed in kg / ha * year, it was found that in spite of the higher density of coffee plants, lower yields were obtained in this crop in all productive systems compared to what was reported by [30]. This author mentions that annual production in associated crops was between 4,500 kg / ha and 4,900 kg / ha for plantain and 3,940. 5 kg / ha for dry parchment coffee, thus showing that plantain production is lower for the low productivity agroecosystem and higher in the medium and high productivity crops in the present study (Table 1).
3.2. Inventory Analysis
The inputs chosen for each crop and stage are presented for each agroecosystem in Table 2. For agroecosystems in associated crops it is recommended an independent agronomic management for each one in order to reduce potential competences and obtain additional income without affecting any of them [26]. However, in selected agroecosystems, in general for those associated with coffee, the focus is centered in coffee cultivation since it is considered the main product, while plantain receives less rigorous management.
• Establishment / propagation
For plantain, results showed that A1 and A3, low and high productivity respectively, mainly applied fertilizers based on nitrogen and phosphorus, while A2, medium productivity, used nitrogen and potassium based fertilizers. For coffee, A1 applies small amounts of the major elements: nitrogen, phosphorus and potassium, whereas A2 and A3 fertilizations are only performed with nitrogen and phosphorus (Table 2). Phosphorus is applied in all agroecosystem, since it is an essential nutrient for seedling rooting; Nitrogen is important in protein formation during growth, while potassium is not as essential for it, it participates in the transport of plant ions [31-33]. The composition of the applied nitrogen fertilizers was based on ammoniacal nitrogen, urea nitrogen and nitrates. Pests were controlled with pesticides on Barker ly when necessary, therefore, their use was limited in the agroecosystems. At this stage, this agricultural supply was only used by A3 to establish plantain cultivation. For coffee, the three agroecosystems used it, being at A3 the most common. Glyphosate herbicide, is used only by A1 (Table 2).
• Production
In general, at the production stage, the amount of fertilizer applied per hectare to both crops was higher than at the establishment stage for plantain and propagation stage for coffee, except for A3(high yield), which used a higher dose of fertilizers for the establishment. The European Commission suggests that the maximum amount of nitrogen in the soil should not exceed 170 kg N / ha / year [34]. The values obtained in the application of nitrogen fertilizers for both crops and in the three agroecosystems are lower than those reported by the EU, taking 1 kg of plantain and 1 kg of dry parchment coffee as a functional unit (Table 2).
The insecticide used in some of the agroecosystems at production stage was chlorpyrifos, present in the polyethylene bags used to protect plantain bunches. However, A1 (low yield) when not using these bags in their plantain crop, does not have this insecticide in stock. On the other hand, approximately 90% of the bags used by A2 (medium production) do not include a treatment, for this reason, it has a lower amount of chlorpyrifos than A3 (high production) which uses treated bags only. It should be noted that these bags are not reused (Table 2). A1 did not record any polypropylene, the base component of the mooring fibers in plantain culture, as it does not perform this activity. A2 and A3 use this fiber and do not reuse it. On the other hand, the only agroecosystem that reports herbicide use is A1, and it is mainly directed to the management of arable crops.
• Post-harvest
The low-production agroecosystem A1, does not carry out any activity for the plantain case at harvest stage, since this producer essentially sells it directly in the local market, which has lower quality requirements. Therefore, he delivers the entire bunch without any processing. Medium and high productivity agroecosystems, A2 and A3 respectively, use a special shampoo to remove the latex. In the case of coffee, farmers use electricity for pulping. It should be noted that A1 shows the highest amount of energy consumed at this point since it shares the pulper with another farmer, and its followed by A3.
In the following steps, the processes of fermentation and washing produce the mucilage [35,36]. This organic waste can lead to contamination of water sources if it is thrown there, causing physicochemical and biological changes in water [37]. It was found that the amount of mucilage generated in the wet benefit increased proportionally with productivity (Table 2). Furthermore, A2 and A3 presented the highest amount of mucilage defined as water plus mucilage [26]. Since A2 used less water in the rinse, it generated less mucilage.
A2 is the only agroecosystem out of the selected, that performs a basic pre-treatment of mucilage before making a final disposal to the soil and bodies of water, and it consists of small reactors. There is not preparation of compost using the mucilage in any agroecosystem.
Subsequently, coffee is dried outdoors with the exception of A1 that uses coal to do it.
• Distribution
Plantain and coffee are distributed by cooperatives responsible for marketing them in local and national markets. However, in the case of plantain, A1 does not meet the standards demanded by the marketer, so the distribution of this product is made directly by the farmer in the local market. With respect to distances traveled to distribute the products, these are always longer in A3, high productivity, due to the location of the agroecosystem (Table 2).
3.3. Environmental impact assessment
A good agronomic management is reflected directly in the levels of production and the quality of the harvest. However, crop management affects the soil, both as a natural resource and as a provider of ecosystem services. Hence the importance of evaluating not only the effects of agricultural practices on the surrounding environment, such as global warming, aquatic eutrophication, terrestrial acidification and aquatic ecotoxicity, but also the environmental damage to fields during the use of soil.
Fig. 2 details the impact for each agroecosystem with a cradle to the gate approach. Productivity, usually driven by the intensive use of agricultural inputs, is expected to be directly related to the environmental impact produced in an agricultural system [38]. Generally, in plantain-coffee agroecosystems, coffee cultivation is responsible for most of the environmental impact for all the evaluated categories: global warming, aquatic eutrophication, terrestrial acidification, aquatic ecotoxicity and land use.
Since coffee crop is the main product of the agroecosystem, all strategies for improving yields are focused on it. In the specific case of coffee cultivation, the level of productivity also reflected the environmental impact it caused. There was no correspondence for plantain cultivation, since the lowest productivity agroecosystem, A1, had the highest value in impact categories, while A2 and A3 presented similar values. This is probably due to the expansion process agroecosystem A1 has in this crop, where it also implements inadequate agricultural practices with higher consumption of agroinsumers than A2 and A3.
If the agroecosystem is analyzed as a whole, specifically the environmental impact caused by the sum of individual impacts for each crop category, the expected behavior between productivity and impact can be observed.
In this case, for global warming, land acidification, aquatic ecotoxicity and soil use categories, the impact caused by low (A1) and medium productivity (A2) is similar, while high productivity agrosystem (A3) is causing much more impact for these categories. For the aquatic eutrophication category, A1 and A2 presented very different values, which is the reason why it does not fulfill what was previously described. It can be noticed that in addition to the greater impact generated by A3, A1 is incurring in inefficient practices and uses of supplies bringing negative environmental effects (Fig. 2 and Fig. 3).
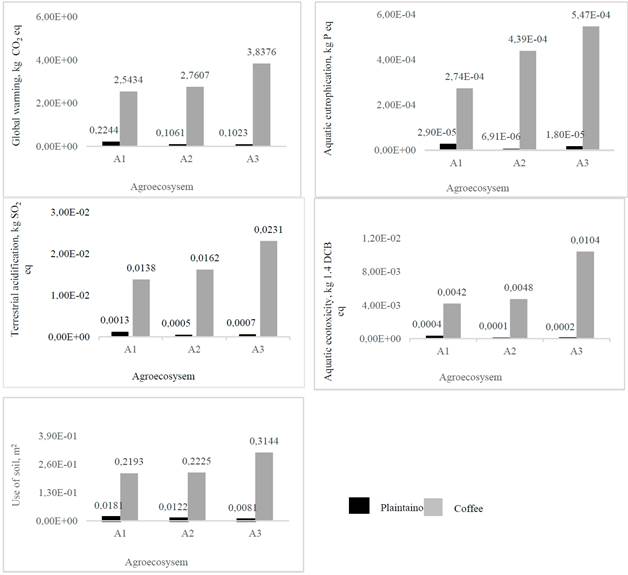
Source: The Authors.
Figure 2 Impact categories analyzed for the production of 1 kg of plantain and 1 kg of dry parchment coffee in each of the selected agroecosystems. A. Global warming; B. Aquatic eutrophication; C. Soil acidification; D. Aquatic ecotoxicity and E. Land use A1, A2 and A3, low, medium and high productivity respectively
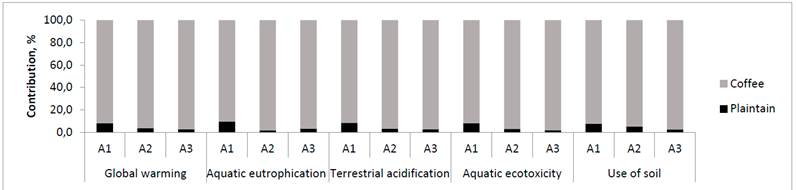
[1] The contribution percentage was calculated as the ratio between each impact category in the given agroecosystem and the total in relation to the sum of the two crops. Source: The Authors.
Figure 3 Contributions of impact categories in plantain and coffee crops [1].
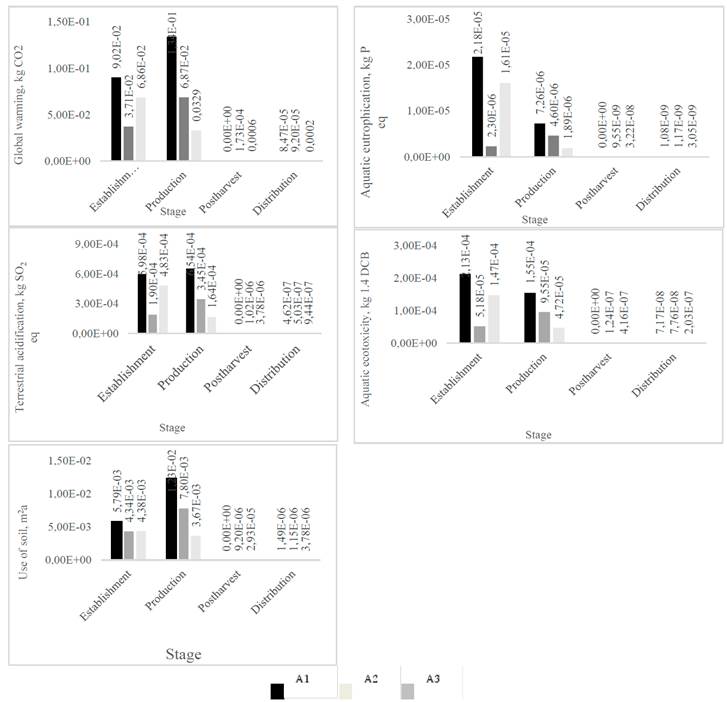
Fig. 4 shows the environmental burdens for each impact category at plantain production cycle stages, that is, establishment, production, postharvest and distribution.
Source: The Authors.
Figure 4 Impact categories for the production of 1 kg of plantain in agroecosystems categorized into three levels of productivity. A. Global warming; B. Eutrophication; C. Acidification; D. Ecotoxicity, and E. Land use
In plantain production, the stages with the greatest environmental impact in all categories are establishment and production; for the others, it can be said that it is not relevant. As mentioned above, the agroecosystem with the greatest impact in these two stages and for the evaluated impact categories, is the one with low productivity (A1).
In the case of agroecosystems of medium and high productivity, A2 and A3 respectively, an inverse behavior is observed, that is to say, a lower impact is evident at establishment stage for A3, and greater at production stage for A2, which causes a compensation in global impacts and these are similar for these two agroecosystems (Fig. 4).
Compounds were presented for each impact category, most of which were the main contaminants caused by the fertilization activity. In the case of global warming, carbon dioxide and nitrogen oxide contributed the most to emissions in the atmosphere. In eutrophication, leaching of phosphates and nitrates appeared. For acidification, sulfur dioxide, ammonia and nitrogen oxide were emitted mainly. Finally, for ecotoxicity, aluminum and copper ion were mainly present. On the other hand, for the land use impact category, occupancy factors are also affected by the fertilization activity, especially by the use of potassium, nitrogen and phosphorus based fertilizers. Although pesticides are considered to contribute to acidification of soils and water [39, 40], they did not have a significant contribution since they are applied in small quantities in the productive chains contemplated in this research.
4. Conclusions and recommendations
For both plantain and coffee crops, the stages that contributed the most to environmental burdens were establishment and production, mainly due to the manufacture and use of fertilizers. In plantain specifically, A1 agroecosystem (low productivity) was the one that caused the greatest impact due to the inadequate environmental and agricultural practices. The values presented for the establishment were: 9,02E-02 kg CO2, 2,18E-05 kg P eq, 5,98E-04 kg SO2 eq, 2,13E-04 kg 1,4 DCB eq, and 5,79E-03 m2, and for production:1,34E-01 CO2, 7,26E-06 kg P eq, 6,54E-04 kg SO2 eq, 1,55E-04 kg 1,4 DCB eq, and 1,23E-02 m2 in global warming, aquatic eutrophication, terrestrial acidification, aquatic ecotoxicity and soil use impact categories respectively. In the case of coffee, agroecosystem A3 (high productivity) contributed the most to the environmental burdens. Thus, at establishment stage, values of 9,99E-01 CO2, 2,37E-04 kg P eq, 0,0085 kg SO2 eq, 6,86E-03 kg 1,4 DCB eq, and 5,04E-02 m2 were obtained, and in the production stage values of 2,64E+00 CO2, 2,05E-04 kg P eq, 0,0135 kg SO2 eq, 3,48E-03 kg 1,4 DCB eq, and 2,52E-01 m2. In global warming, aquatic eutrophication, terrestrial acidification, aquatic ecotoxicity and land use impact categories respectively.
For the selected agroecosystems, nitrogen fertilizers level of application did not exceed the maximum allowable by the European Commission (170 kg / ha / year) for the chosen functional units. However, management strategies that allow farmers to make efficient use of these agricultural supplies, while reducing the risk factors of environmental contamination have to be designed. One of these strategies is based on the application of the correct dose of fertilizers, which can be accurately known through a soil analysis. Following the recommendations of this analysis farmers will be able to avoid environmental problems due to an excessive application, while the crop takes advantage of this adequate nutrition. In addition, results showed that in associated crops.
Agroecosystems show bigger environmental impacts in the crops that demand greater agronomic management. In this case, coffee contributed to higher values in the evaluated impact categories than plantain, with rates between 90.5% and 98.0%. On the other hand, coffee crop reflected a direct relationship between the level of productivity and the environmental impact, which is not the case for plantain. However, taking the agroecosystem as the sum of the impacts of each crop, it effectively generates greater impact as productivity increases.
As recommendations it is suggested that the focus of the study be expanded from "cradle to grave" in order to know in an integrated way the impacts along the productive chains. This is due to the fact that in the scope of the "cradle to the gate", the distances traveled from the agroecosystems to the distributor in charge of distributing the products were short, and therefore the impact in the different categories was not significant for the distribution stage. On the other hand, it is recommended that for future research, carbon emissions avoided in plantations should also be taken into account, since in the present study, in the global warming impact category, only GHG emissions, produced in the systems, were considered.

