


 Inglês (pdf)
 Artigo em XML
 Referências do artigo
 Enviar este artigo por email
 Citado por SciELO
  Citado por Google
  Similares em
SciELO
Similares em
SciELO  Similares em Google
 Permalink
1. Introduction
A catalytic process can be analyzed from a set of perspectives, such as a purely chemical kinetic approach, macroscopic balances of matter and energy, chemical master equation, and population balances. The implementation of one approach depends on the kind of available data and on what type of information it is expected to obtain about the system. In many cases, using more than one approach would be advisable [1-3]. Due to the vast implementation of heterogeneous catalytic-based processes, there is a great interest in understanding them through mathematical modeling and simulations.
The derivations of kinetic expressions for catalytic cycles constitute a well-developed area in the context of chemical catalysis. However, works performed in this field do not include the influence of the transitions states or reactive intermediates [4]. Moreover, additional processes should be considered to analyze the changes of catalyst properties under reaction conditions. For instance, one of the components can diffuse into the subsurface layers of metallic catalyst, causing surface modification [5].
Kozuch and Shaik [4] proposed a combined kinetic-quantum chemical model to estimate the overall net rate of a catalytic cycle called turnover frequency (TOF) in terms of the energetics of its individual steps; furthermore, this procedure allows a straightforward estimation of the cycle efficiency by computational means. Although this initiative to analyze the cycle performed by the catalyst represents significant progress, it is necessary further studies that lead to a deeper understanding of the phenomenon of catalysis [6].
Heterogeneous catalysis is a complex multiscale process. On the macroscopic scale, computational simulations based on continuum theories (such as the Navier-Stokes equations) are the most widely used approach to describe heat and mass transport [7]. However, with particulate processes, an additional balance is required to describe how the particle population changes during the process. In general, particulate systems are more difficult to describe than systems comprised of one or more bulk phases [8,9]. Population balances are frequently used to describe and control many-particulate processes such as crystallization, granulation, flocculation, combustion, polymerization, and catalysts deactivation [10]. According to [11], "the catalytic process is a sequence of elementary steps that form a cycle from which the catalyst emerges unaltered". However, it is known that the kinetic cycle performed by the catalyst is irreversible by nature, meaning that there is a partial reconstruction of the catalyst before the next cycle begins [12]. This fact influences the global performance of the process. Population balances reveal that, after a chemical reaction, the catalyst does not return to its initial state because there are chemical or physical processes happening simultaneously with the main reaction causing the catalyst deactivation, which is understood as the loss of catalyst activity since there are fewer active sites in each cycle.
This work aims to understand and describe a generic heterogeneous catalytic reaction by implementing two complementary approaches. Thus, the paper is organized as follows. In section 2.1, we describe the system under consideration which is composed of two subsystems. In section 2.2, we propose macroscopic balances for each subsystem based on the specific phenomena that take place in each of them. In section 2.3, we implement population balances to describe the temporal evolution of a population of particles, that is, the number of active sites of the catalyst. After deriving a generic model, in section 2.4, we introduce a case study corresponding to the catalytic oxidation of carbon monoxide. In section 3, we present the results and discussion of the case study. In section 3.1, we assume isothermal and pseudo-steady state conditions; in section 3.2, we consider a non-isothermal reaction-diffusion system; finally, we study catalyst deactivation in section 3.3. Section 4 corresponds to the conclusions.
2. The model
2.1. The system
Fig. 1 represents a generic heterogeneous catalytic system. In the diagram presented on the left-side, there is a gas stream crossing over the catalyst where δ corresponds to the height of the gas film and

Source: Own elaboration.
Figure 1 (left-side) Gibbs ideal interface where phases α, and β, are separated by a plane σ which corresponds to the interface. (right-side) Schematic diagram of temperature variations in a heterogeneous catalytic system. Adapted from [14]. The catalyst temperature differs from the adjacent homogeneous phase due to the exothermic reaction, and it is assumed to be constant at the surface. In the left-side scheme, the active zones area is assumed to decrease. The catalyst surface has some active zones of area Aj. The zones in dark gray have smaller areas since, after the chemical reaction, there is incomplete desorption of the chemical species. Additionally, the reactants flow is a mixture of CO, CO2, O2 and inerts. The latter acts as a poison. Inert compounds do not react but can occupy a fraction of the active zones, thus reducing their area.
The presence of an interface influences all thermodynamic parameters of the system. According to Gibbs's description, both phases α and β are separated by an infinitesimal thin boundary layer called Gibbs dividing plane or ideal interface. In this model, an interface is an imaginary plane placed at an arbitrary position parallel to the phases [13]. In the idealized system, the chemical compositions of phases α and β are assumed to remain unchanged right up to the imaginary dividing surface.
The study of systems involving multi-component mass transfer to\from a catalytic surface is made employing the film model. However, in the frame of this model, some questionable assumptions are made. First, it is assumed that the temperature and chemical potentials of the surface are equal to those in the adjacent homogeneous region. Second, coupling effects between mass and heat fluxes are neglected [14,15].
The interface is explicitly considered a system in the description to propose a realistic model and not just to establish boundary conditions. Fig. 1(right-side) corresponds to a schematic diagram of the temperature variation in the heterogeneous exothermic catalytic reaction. This variation has been demonstrated experimentally [15,16] and theoretically [16,17]. In this diagram, the catalyst temperature differs from the adjacent phase, and the temperature on both sides of the surface may differ; in addition, it is assumed that the catalyst temperature is uniform over the surface [18].
2.2 Macroscopic balances
If the temperature or the concentrations of chemical species in a system are perturbed, then they become nonuniform, and their respective gradients appear and vanish over time [18,19].
The basic form of the conservation equation for specie i is given by the following expression [20]:

The source term νi is the net formation rate of specie i by chemical reactions per unit volume. The sign convention is such the rate is positive if there is the net formation of species i, and negative if there is net consumption. The rates of heterogeneous reactions appear only in interfacial conditions. In addition, Ci is the molar concentration of the specie i (in units of mol/m3). The total molar flux Ni involves the convective and diffusive fluxes of species i:

The first term in Equation (2) corresponds to the convective flux and the second term is the diffusive flux with Ji being the molar flux of specie i relative to the mass-average velocity, ν. When density and diffusivity are constant, the conservation equations for species i can be written as:

where the differential operator, D/Dt is the material or substantial derivative. Alternatively, Equation (1) can be expressed in rectangular coordinates as follows:

Specifically, in the bulk phase, there is no reaction, but there is convection over x-direction and diffusion over y-direction (see Fig. 1(left-side)). In this case, the mass transfer occurs in two dimensions. To reduce the problem's complexity, we made an average over the

Where Jy is an average diffusive flux over y-direction and corresponds to the net velocity of adsorption and desorption, Jy ≈ υads + υdes, being υads the adsorption rate and υdes the desorption rate. These quantities depend on the reaction mechanism. The second term on the left-hand side of Equation (5) is the convective contribution in the mass balance, and the first term on the right hand is the diffusive term, both in x -direction.
In the catalyst, there is no convection, but reaction and diffusion occur in two dimensions. Like done in the previous case, an average diffusive flux is calculated by integrating Equation (4) with respect to y. Then, if the diffusion across y-axis is given by a net adsorption-desorption rate of the species i, the conservation of mass of adsorbed species j is given by:

Note that in Equation (6), there is no convective contribution; instead, there are diffusive terms: the first and second terms on the right hand of the equation, and the source term contribution, νi due to the chemical reaction at the interface. Moreover, recalling the catalyst is another study system then, a dynamic balance of the number of active sites per volume of catalyst, Ψ, is made as follows:

where the subscript Z indicates an active site in the catalyst. Note again that the first and second terms on the right-hand side of Equation (7) are the diffusive contributions, and the last term accounts for the chemical reaction.
On the other hand, the general form of the multi-component energy equation in terms of partial molar enthalpies
 is:
is:
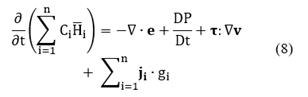
The partial molar enthalpy is defined as follows:

where Tref = 298.15K and Cp.i is the heat capacity of species i. Replacing Equation (9) into Equation (8) and neglecting pressure, viscous, and Dufour effects, the following expression for the energy conservation is obtained:

It is important to note that the last two terms on the right-hand side of Equation (8) were not included in the previous deduction. However, the terms
 is related to the energy transfer due to the chemical reactions and q is the transferred heat between phases which is defined by an expression analogous to Newton's cooling law [20,21]:

where U is the global heat transfer coefficient per unit area of the catalyst, and Tcat is the catalyst temperature.
Finally, the general expression of conservation of linear momentum is written as:

where

Viscous stresses, τij are given by the following expressions:
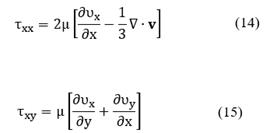
With

The goal is to calculate the velocity variation over time, but it is important to note that velocity is a function of two spatial coordinates: υx = υx (x,y), however for the sake of simplicity, it is possible to assume that velocity changes only depend on the x-coordinate and taking an average over y-axis, the velocity is given by Stokes flow:

Integrating Equation (17) with respect to γ between ο and δ, the average velocity on γ-coordinate is obtained:
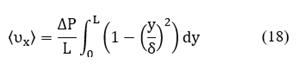
Equation (18) is solved to calculate the velocity changes over time, and it is valid only for the bulk phase. On the other hand, a pressure gradient is associated with concentration changes. In this case, the ideal gas model was used

2.3. Population balances
The population balance equation accounts for the various ways in which particles of a specific state can either form or disappear from the system [9,22-24]. A population balance for particles in some fixed subregion of particle phase space is given by the balance (accumulation)=(input)-(output)+ (net generation).
Consider a given subregion R1 that is moving with the particle phase-space velocity ν, then the population balance for particles in R1 is given by:

The term on the left-hand of Equation (20) can be expanded using Leibnitz's rule as follows:

Where x is the set of internal and external coordinates comprising the phase space R. Recalling that

The population balance can be written for the region R1 as follows:

As the region R1 is arbitrary then, the integral must vanish identically. Therefore, Equation (23) is written as:
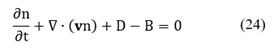
By expanding Equation (24) in terms of the m+3 coordinates, the population balance becomes [8,22]:

The term which depends on
Since the catalyst activity is related to the population of the available active sites [23], the catalyst deactivation process can be considered to decrease the number of available active sites at the catalyst surface. In this sense, population balance equations are a valuable tool for analyzing the loss of catalyst activity since an internal coordinate can describe the active sites. It is assumed that over the catalyst surface, many active sites are grouped in "active zones" of area Aj (see Fig. 1). Catalyst deactivation occurs because the area of the active zones is decreasing over time.
2.4 Application case
We study the catalytic oxidation of carbon monoxide. Such reaction is typical when understanding the concepts of heterogeneous catalysis (see Fig. 2) and is one of the key reactions in cleaning automotive exhaust. This process occurs in car engines to reduce emissions of toxic gases, which are products of incomplete combustion of fuels [24,25].
Source: Own elaboration.
Figure 2 Reaction cycle and scheme of potential energy diagram for the catalytic oxidation of CO. Adapted from [11]. The catalytic oxidation of CO is described according to the Langmuir-Hinshelwood mechanism, molecules of O2 are chemisorbed onto the catalyst surface, whereas CO molecules are physisorbed. Once the reactant molecules are adsorbed, they react to produce adsorbed CO2, the cycle finishes when the product is desorbed, and the catalyst returns to its initial state.
To describe the process, we assume that the metal surface consists of active sites, denoted as Z. The catalytic reaction cycle begins with the adsorption of CO (A) and O2(B) on the surface of platinum, where molecules of O2 dissociate into two oxygen atoms:

The components ZA and ZB correspond to adsorbed complex, i.e., atom or molecule bounded to the site Z. The adsorbed oxygen atom and the adsorbed carbon monoxide molecule then react on the surface to form CO2 (C), which interacts only weakly with the platinum surface and is desorbed almost instantaneously [26]:

Fig. 2 shows the reaction cycle and the potential energy diagram sketch. From the Langmuir-Hinshelwood mechanism, it is known that there are two steps of adsorption (

where ki is a reaction constant and Cj is the concentration of the specie i, Ψ is the number of active sites per volume of catalyst. The Arrhenius expression gives these reaction constants:
 , where ki,0 is a pre-exponential factor and Ea is the activation energy in kJ/mol.
The forward kinetic constants that are used in this work are given by Rawlins et al. [27], and the backward constants are proposed to be fractions of the forward constants:

To analyze the catalyst deactivation, consider a fraction of a surface catalyst with active zones, as shown in Fig. 1. It is assumed that the reactants flow is a mixture of CO, O2, CO2 and inert compounds, specifically sulphur (S) and carbon (E), which do not participate in the chemical reaction but can be adsorbed into the active sites and prevent the reactants from being adsorbed. Thereby, inert compounds block the active sites and reduce the active zones area. Additionally, it is assumed that, after the chemical reaction, the desorption of the species is incomplete, i.e., a portion of the product and the reactants remain adsorbed, and hence, there is a decrease in the area of the active zones. Thus, to account for this phenomenon, besides the main steps of the carbon monoxide oxidation mechanism over a platinum catalyst, an additional reaction step to describe catalyst deactivation by poisoning and coking is considered, as follows:

These reaction steps correspond to the coking and poisoning processes, respectively. To deduce the population balance equation is necessary to determine the internal coordinate. In this case, it is convenient to choose the active zones area A as the internal coordinate. Therefore, the general form of the population balance (see Equation (25)) is given by:

where

Equation (30) is solved using the Moments Method [28-30], which is defined, for this study system, as:
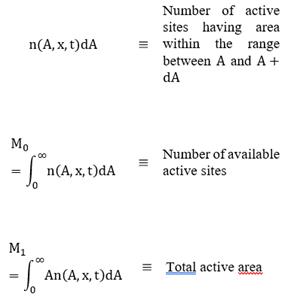
where x represents the spatial coordinate and t is time. Moreover, using this method, a mean area of the active zone (average active area) can be defined as follows:

The temporary change of the average active area can be defined as a function of the rates of each mechanism step. In other words, the temporary change of the internal variable depends on the rate of adsorption, desorption, reaction, poisoning, and coking. Thus, we write the following expression:


The terms νi, B and D are assumed negligible since the active zones are stationary. Moreover, neither the active sites are created nor disappear, but the active zones' area decreases. The temporary changes of moments are given by:

Note that M0 is conserved because there is no birth or death of active sites. Irreversible or reversible mechanisms are considered when studying poisoning and coking processes over the catalyst activity. According to νcoke and νpoison, for each mechanism, there are two specific rate constants: k+ and k_, if the process is considered irreversible, then k_ ≈ 0.
Finally, by assuming a normal distribution, the probability density function (PDF) is given by:
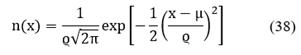
where μ and ϱ are calculated as follows:

3. Results and discussion
Once the study system is well described, balances of energy, mass, momentum, and population are solved to analyze the dynamic behavior of this catalytic reaction. The analysis is made under different scenarios, and the results are shown below.
3.1. Pseudo-steady state approximation
According to Fig. 2, in the last mechanism step, the active sites on the catalyst are liberated and become available for further reaction cycles. In this sense, the active sites and the concentrations of adsorbed species do not change in time [3,31]. Considering a purely reactive system (without convection or diffusion), the mass balances of non-adsorbed species and active sites, in one dimension, can be written as:

For reactive complex AZ and BZ, there is no temporal change according to the pseudo-steady state approximation:

After solving the above algebraic equations, expressions for the concentration of adsorbed species CAZ and CBZ are obtained:

Fig. 3 compares the chemical species' dynamic behaviors when pseudo-steady approximation (that is, ZA and ZB are constants) and non-steady sate (when all chemical species have temporal change) are considered. This comparison is made under isothermal and isobaric conditions (T = 300 K).
According to Fig. 3(a), when a pseudo-steady state of adsorbed species is assumed, the amount of CO2 produced during the chemical reaction is overestimated since such assumption implies that all adsorbed species react to produce CO2. Moreover, as shown in Fig. 3(b), the concentration of active sites does not decrease as fast as in the non-steady approach; in the latter, the active sites do not completely regenerate since there is a temporal decay known as catalyst loss of activity. Such behavior is consistent with the theoretical and experimental data reported in [32], in which an alumina-supported platinum catalyst exhibits deactivation (also called catalyst aging) when considering a diffusion-reaction model during the carbon monoxide oxidation in an isothermal, integral reactor under controlled conditions.

Source: Own elaboration.
Figure 3 Concentration of chemical species comparing pseudo-steady state and non-steady state. (a) Molar concentration of CO2 produced during the reaction. We compared the pseudo-steady (dashed line) and non-steady (solid line) assumptions. (b) Number of active sites per volume of catalyst. Under pseudo-steady state assumption, the number of active sites (dotted line) does not decrease faster than the non-steady profile.
3.2. Non-isothermal reaction-diffusion system
In this case, Equations (6) and (7) are solved when the diffusion term

were Ψ1 < Ψ2. The following figures show the spatial profile (the x-axis) of a specific variable (the y-axis) for each time step.
Fig. 4(a) shows the oxygen concentration in the gas phase, which temporarily decreases due to adsorption. It is worth noting that the transition due to the staircase-type initial conditions is smooth when the diffusion phenomenon is considered in the model. Additionally, the system's evolution is influenced mainly by the chemical reaction, and diffusion does not have a significant effect, at least from a macroscopic point of view. On the other hand, Fig. 4(b) shows the number of active sites per catalyst volume, which increases initially since the reactants are being adsorbed and immediately desorbed. In the end (x > 0.5 m), contrary to what is expected, the available active sites decrease due to the incomplete desorption of the species, which shows the loss of activity of the catalyst.

Source: Own elaboration.
Figure 4 Concentration of chemical species for a non-isothermal reaction-diffusion system. (a) Molar concentration of adsorbed 02. In each step, the adsorbed oxygen concentration increases since this reactant is adsorbed into the surface catalyst. (b) Number of active sites per volume of catalyst. When 0 ≤ x ≤0.5, the number of active sites increases since the reactants are being adsorbed. Then, the available active sites decrease due to the incomplete desorption of the species.
Figs. 5(a) and (b) show the temperatures profiles in the gas phase and the catalyst, respectively. The adsorption steps of the chemical mechanism consume energy, and for this reason, the catalyst and gas temperatures decrease. Nonetheless, when the adsorbed species react, the temperature increases due to the exothermic nature of the reaction.

Source: Own elaboration.
Figure 5 Temperature profiles for a non-isothermal reaction-diffusion system. (a) Gas temperature. When 0 ≤ x ≤0.5, the gas temperature decreases because the reactants are adsorbed; however, the temperature increases due to the exothermic nature of the chemical reaction. (b) Catalyst temperature (surface). When 0 ≤ x ≤0.5, the temperature decreases in every step of time. After that, the temperature increases because of the chemical reaction.
3.3. Catalyst deactivation
We consider two cases in which a catalyst could lose its activity, that is, deactivation by coking (νpoison = 0) and by poisoning (νcoke = 0).
Fig. 6(a) and (b) show Moment 1 (which is related to the total active area) for poisoning and coking deactivation, respectively. From Fig. 7(a), the total active area decreases from 1500m2 (initial value) to 1500m2 approximately. In the case of deactivation by coking (Fig. 7(b)), the transition due to the staircase-like initial condition is more significant compared to the poisoning case. In other words, for each step of time, the average area of active sites has a significant decrease for x > 0.5 nm.

Source: Own elaboration.
Figure 6 Moment 1 - Catalyst deactivation. (a). Deactivation by poisoning. The total active area decreased from 1500m2 to 1150m2 at the end of the chemical reaction. (b). Deactivation by coking. The total active area decreased from 1500m2 to 1180m2 at the end of the chemical reaction.

Source: Own elaboration.
Figure 7 Active site area distribution. (a) Deactivation by poisoning. The light colors indicate that, along the spatial coordinate, most of the active sites have an area between 1.10 - 1.15 nm2 while the dark colors indicate that a small portion of the population of active sites has an area between 2.5 - 4.0 nm2. (b) Deactivation by coking. The light colors indicate that, along the spatial coordinate, most of the active sites have an area between 1.18 - 1.20 nm2 while the dark colors indicate that a small portion of the population of active sites has an area between 2.5 - 4.0 nm2.
Fig. 7 shows the active site area distribution, which is the average area of the population of active sites. In Fig. 7(a), the light colors indicate that, along the spatial coordinate, most of the active sites have an area between 1.10 - 1.15 nm2 while the dark colors indicate that a small portion of the population of active sites has an area between 2.5 - 4.0 nm2. In Fig. 7(b), the light colors indicate that, along the spatial coordinate, most of the active sites have an area between 1.18 - 1.20 nm2 while the dark colors indicate that a small portion of the population of active sites has an area between 2.5 - 4.0 nm2. The average area of active sites in both scenarios is statistically equal, so it is impossible to establish with certainty which mechanism has the most significant influence on the catalyst deactivation process.
4. Conclusions
In this work, we have implemented two complementary approaches: macroscopic balances and population balances, to analyze a heterogenous catalysis reaction. When deriving the macroscopic balances of the system under consideration, we have proposed two different modeling domains with their respective equations set: one for the bulk fluid surrounding the catalyst cell without the catalytic reaction term, and one for the catalyst cell or interface system (see Fig. 1). Moreover, there is continuity in concentration and fluxes of chemical species within the subsystems' internal boundaries. We also have assumed the homogenized approximation at the macroscopic level [34], which is accurate given the relative size of the interface compared to the whole system. Additionally, since we have assumed a net adsorption-desorption rate across the y-axis, we can describe the macroscopic system with a 1D model along the system, from the inlet to the outlet. Thus, we obtained a model with two independent variables: position along the x-direction and time. A similar approach is implemented in [34].
Subsequently, we have studied and presented the results for a case study corresponding to the catalytic oxidation of carbon monoxide. For this case study, we have considered two scenarios: pseudo-steady state approximation and the more realistic case of a non-isothermal reaction-diffusion system.
According to the simulation results, under the pseudo-steady state approximation and when the catalyst deactivation was not considered, the amount of product at the end of the chemical reaction is overestimated. This fact is consistent with the results reported in [32], and indicates that the temporal changes of the reactive complex have a significant influence on the reaction yield.
Additionally, the proposed formalism allows us to evaluate and determine which of all the considered transport phenomena has the most significant influence over the catalyst performance. For the application case of carbon monoxide oxidation (section 3), the system's evolution is not affected when diffusive phenomena are taken into account at the catalyst surface. In this sense, the system's evolution is mainly governed by chemical reaction, and the effect of the diffusion is just softening the transition according to the staircase type initial condition.
It is worth noting that, when facing the challenge of studying heterogeneous catalysis processes, software packages come in handy. For instance, COMSOL is an extensively used tool that implements models from the microscopic particle level to the macroscopic reactor level. Overall, the results we have reported are in accordance with the findings reported in [35,36], where the authors used COMSOL for heterogeneous catalysis under unsteady-state conditions [35], and in dynamic state at particle scale [36].
Finally, regarding the population balances, the average area of the active sites and the total active area of the catalyst decreases by coking and poisoning. However, it was not possible to determine the phenomenon that has a more significant influence during the catalyst deactivation process from the statistical information.

