


 Inglês (pdf)
 Artigo em XML
 Referências do artigo
 Enviar este artigo por email
 Citado por SciELO
  Citado por Google
  Similares em
SciELO
Similares em
SciELO  Similares em Google
 Permalink
INTRODUCTION
Alfalfa is perhaps one of the most beneficial forages grown in dairy farms because of its high nutritional quality (Broderick, 1995) and its ability to fi x soil nitrogen (Russelle, 2004). Alfalfa forage, however, is difficult to ensile because of its high crude protein content (Muck, 1988), low soluble carbohydrate concentrations (Owens et al., 1999) and high buff eringcapacity (Muck and Walgenbach, 1985). These characteristics, combined with inadequate DM content and difficult compaction during ensiling, lead to production of silages with high ammonia-N concentration (Muck, 2011).
Ammonia-N concentration in alfalfa silage has sparked interest as an indicator to evaluate silage quality; however, its potential utilization by the cow is still debated. High degradation rates of protein into silage ammonia-N contribute usually to increase rumen ammonia concentrations (Givens and Rulquin, 2004). Rumen ammonia is recovered in the crude protein fraction together with amino acids and peptides; however, the site of utilization in the cow differs (Buchanan-Smith and Yao, 1978). In fact, rumen ammonia is an essential nutrient for fiber-digesting microorganisms, although the extent of its utilization varies depending on the amount and solubility of the carbohydrates present in the rumen (Van Soest, 1994). Some studies have reported the influence of ammonia-N in grass silage on dairy cow performance. Van Os et al. (1995) demonstrated a significant DMI reduction and a trend for decreased milk production in cows fed grass silages with 13 vs 6% ammonia-N. In their study, rumen ammonia was higher in cows fed silage with 13% ammonia-N. Dry matter intake dropped 0.3 Kg/d when ammonia-N in grass silage fed to dairy cows increased from 7 to 20% (Wright et al. 2000). The analysis of 47 experiments indicated that high concentrations of ammonia-N in grass silage fed to dairy cows had a negative effect on DMI, milk production and milk composition (Huhtanen et al., 2003).
Although high ammonia-N concentrations in grass silage have been demonstrated to reduce milk production, there is limited information on the effects of its presence in alfalfa silage fed to dairy cows. Therefore, the objective of this study was to evaluate through a meta-analysis the effects of the concentration of ammonia-N in alfalfa silage on the performance of lactating dairy cows.
Materials and methods
A literature search was performed in PubMed, Google Scholar, and Agricola-USDA using the keywords “alfalfa silage” and “dairy cows”. This search was complemented by using the citations in scientific papers for a more comprehensive database. A total of 59 papers were found, but only 10 (Kung et al., 1987; Kent et al., 1988; Kung et al., 1989; Fredeen et al., 1991; Nagel and Broderick, 1992; Colombari et al., 2001; Kung et al., 2003; Broderick et al., 2007; Krizsan et al., 2007; Broderick and Muck, 2009) met the following criteria: 1) diets including alfalfa silage were statistically compared; 2) ammonia-N concentration in alfalfa silage was clearly reported; 3) similar percentage of alfalfa silage was maintained across diets; 4) alfalfa silage was not mixed with other forage sources; 5) alfalfa silage was harvested at the same stage of maturity; 6) physical form of alfalfa silage was not altered in the diets; and 7) individual lactating dairy cows were used as experimental units to evaluate the effects of alfalfa silage.
The studies reported by Kung et al. (1987; 1989) were evaluated as separate experiments since alfalfa silage was from two different crop years, resulting in different silages and cow information. In all studies production analysis included fat-corrected milk. One study was not considered in the analysis of milk fat and milk protein percentages due to lack of information (Fredeen et al., 1991). Other studies did not include milk fat and milk protein yields (Kung et al., 1987; Kent et al., 1988; Kung et al., 1989), and were thus calculated from their milk fat and milk protein percentages.
Data for DMI, milk production, milk component percentages and yields were weighted according to their standard errors as proposed by St-Pierre (2001). In the three studies where milk fat and protein yields were calculated, a standard error from their respective milk fat and protein percentages was considered. The assessment of ammonia-N concentration in alfalfa silage on cow performance was evaluated by the mixed-effect models approach of R program (R Core Team, 2015); specifically, the nlme package was used (Pinheiro et al., 2016). Linear and quadratic effects of ammonia-N in alfalfa silage were modeled using study as a random effect (St-Pierre, 2001) according to the following models:
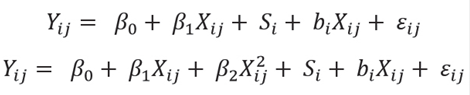
Where:
Yij = dependent variable representing DMI, milk production or milk composition at level j of the variable X in the study i.
β0 = overall fixed intercept across studies.
β1 and β2 = the overall fixed regression model coefficients of Y on X across studies.
Xij = independent variable representing ammonia at level j of the variable X in the study i.
Si = random effect of study i (i = 10).
bi = random effect of study i on the regression coefficient of Y on X in study i.
ɛ ij = unexplained residual error.
When a quadratic effect was statistically significant, a break point was estimated in the adjusted data to determine the inflection point in which the response variable changes. The prediction was tested using piecewise generalized mixed models with the lme4 package (Douglas et al., 2015) with a break point range between 0.17 and 10.94% ammonia-N. The lowest Akaike Information Criterion (AIC; Akaike, 1974) and the level of significance (p<0.05) were used for selecting the best fitted broken-line regression model.
Since the analysis was performed using mixed effect models, it was necessary to calculate the marginal R2 ( m ) (proportion of variance explained by the fixed factor) and conditional R2 ( c ) (proportion of variance explained by both fixed and random factors) to quantify the goodness-of-fi t of the models according to Nakagawa and Schielzeth (2013). Evaluating goodness-of-fi t of a model generated by the mixed model procedure with the simple R2 does not account for the proofs of the asymptotic distributions of the cumulative sum and the consistence of the tests derived from the random effects (Pana and Lin, 2005).
Heteroscedasticity of the models was evaluated by checking the residual vs fitted values plot and normality through the Q-Q plot. Significance was set at p<0.05 for all variables evaluated, and trends were established at 0.05<p ≤ 0.10.
Results
The database included mostly 34 comparisons reported in 10 papers published from 1987 to 2009 (Table 1). Ammonia-N concentration in alfalfa silage averaged 5.20% across studies with a range between 0.17 and 10.94%. Substantial ranges were also observed for DMI, milk production and milk components. Similar mean and median values for all variables indicated that data was normally distributed.
Parameter estimates for linear and quadratic mixed effect models are shown in Table 2. Outcomes of the current meta-analysis indicated that DMI declined (p = 0.0007) and milk production tended to decrease linearly (p = 0.08) in response to the linear function of increasing ammonia-N concentration in alfalfa silage.
Coefficients of prediction equations for DMI and milk production suggested that for every additional percentage of ammonia-N in alfalfa silage, DMI and milk production can be reduced 0.42 and 0.47 Kg/d, respectively (Figures 1 and 2). Marginal R2 for DMI and milk production were 0.31 and 0.07, whereas conditional R2 for both models were 0.92 and 0.89, respectively.
Increasing ammonia-N in alfalfa silage did not affect milk fat nor protein percentages (Table 2), although there was a trend to decrease milk fat (p = 0.08) and protein yields (p = 0.07); it is important to note, however, that milk protein yield was best fitted to a quadratic regression model.
Table 1 Summary statistics of the experiments included in the meta-analysis
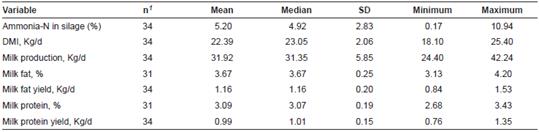
1Number of experimental treatments; SD: Standard deviation.
Table 2 Linear and quadratic regression models for DMI, milk yield, milk fat, and milk protein to assess ammonia-N concentration in alfalfa silage and its effects on the performance of lactating dairy cows
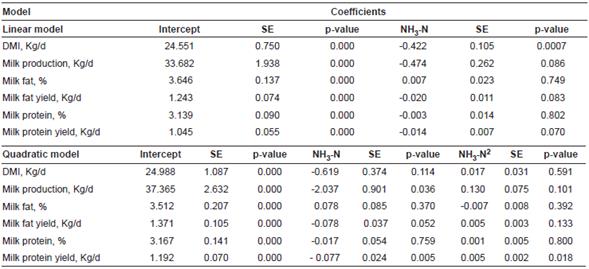
SE: Standard error; NH-N3: Ammonia-N.
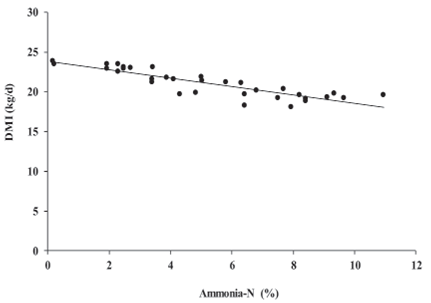
Figure 1 Linear DMI response to increasing ammonia-N concentration in alfalfa silage. Plot reports 34 observations adjusted for the random effect of trial. DMI = 24.551 - 0.422 × ammonia-N ( R2 ( m ) = 0.311, R2 ( c ) = 0.924, p = 0.0007).

Figure 2 Linear milk production response to increasing ammonia-N concentration in alfalfa silage. Plot reports 34 observations adjusted for the random effect of trial. Milk production = 33.682 - 0.474 × ammonia-N ( R2 ( m ) = 0.070, R2 ( c ) = 0.894, p = 0.086).
Similar to DMI and milk production models, a decrease of 0.02 Kg/d milk fat is expected for each percentage point increase in ammonia-N in alfalfa silage (Figure 3). Marginal and conditional R2 for the milk fat yield model were 0.11 and 0.85, respectively. The quadratic responses related to DMI, milk production, milk fat and protein percentage, and milk fat yield were not altered by increasing ammonia-N concentration in alfalfa silage (p˃0.05; Table 2).However, milk protein yield responded quadratically to the increase in ammonia-N of alfalfa silage (p = 0.01). According to the quadratic broken-line regression model, milk protein yield was reduced 0.077 Kg/d until ammonia-N in alfalfa silage was 6.81%, then milk protein yield increased 0.005 Kg/d (Figure 4). Marginal and conditional R2 for the milk protein yield model were 0.30 and 0.90, respectively.
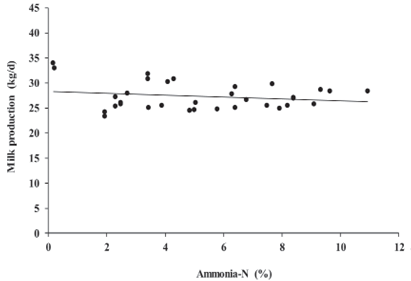
Figure 3 Linear milk fat yield response to increasing ammonia-N concentration in alfalfa silage. Plot reports 34 observations adjusted for the random effect of trial. Milk fat yield = 1.243 - 0.020 × ammonia-N ( R2 ( m ) = 0.105, R2 ( c ) = 0.854, p = 0.083).
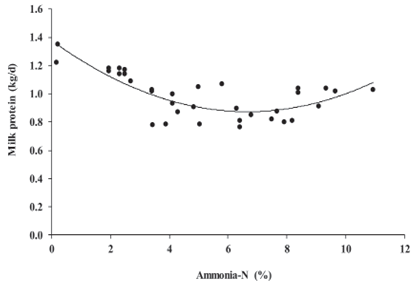
Figure 4 Quadratic milk protein yield response to increasing ammonia-N concentration in alfalfa silage. Plot reports 34 observations adjusted for the random effect of trial. Milk protein yield = 1.192 - 0.077 × ammonia-N + 0.005 × ammonia-N2 ( R2 ( m ) = 0.296, R2 ( c ) = 0.902, p = 0.018). Break point = 6.81% ammonia-N (Estimate = -0.0077, SE = 0.0029, p<2e-16***, AIC = -81.77).
The statistical differences and trends observed in linear and quadratic models indicate that after adjusting for differences between studies, ammonia-N concentration in alfalfa silage significantly contributed to the analysis of the productive variables in this meta-analysis. Marginal and conditional values were higher in significant models compared to models with significant trends, indicating that there was more variability associated to the random effect along with residuals and the variance distribution in models with significant trends.
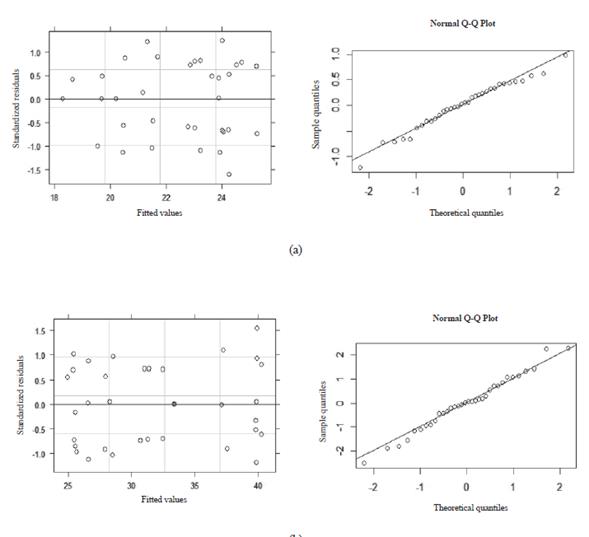
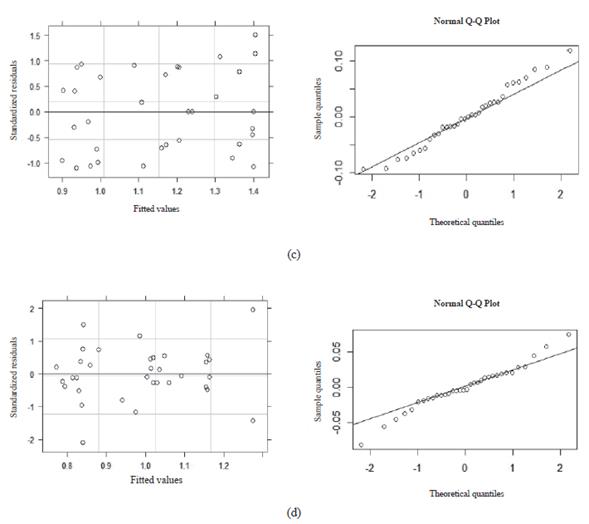
The diagnostic of the heteroscedasticity and normality for the models shown in Figures 1, 2, 3, and 4 are presented in Figures 5 and 6. Residuals vs fitted plots for DMI (Figure 5a), milk production (Figure 5b), and milk fat yield (Figure 6c) show that residuals are symmetrical and their errors are, at least, normally distributed. In addition, the Q-Q plots of these models indicate that residuals followed a straight line, so errors for DMI, milk production, and milk fat yield models belong to a normal distribution. However, residual vs fitted plot and Q-Q plot of the milk protein yield model (Figure 6d) indicates that residuals are asymmetrical and deviated from the straight line, respectively. Therefore, it was demonstrated that a linear model is not a good fi t for this variable.
Discussion
Information of increasing ammonia-N contents in alfalfa silage and productive parameters were analyzed by a meta-analytical procedure in an effort to elucidate the effect of ammonia-N concentration on dairy cow performance. To accomplish this goal, data from published papers were analyzed using study as a random effect and weighted observations to account for the heterogeneity across studies. St-Pierre (2001) indicated that ignoring the study effect and avoiding weighting the observations would severely skew the estimated parameters and affect the normal distribution of the residual errors in the regression models, respectively. In addition, this meta-analysis used R2 for mixed-effect models for explaining the variance of the models (Nakagawa and Schielzeth, 2013), and heteroscedasticity and normality were evaluated through a graphical method. It has been demonstrated that marginal and conditional R2 are the best statistics to quantify the variance explained in a model when the mixed-model procedure is utilized (Nakagawa and Schielzeth, 2013; Johnson, 2014). Besides, the assessment of heteroscedasticity and normality by residual plots guarantee that coefficients of the regression model are not being biased (Altman and Krzywinsky, 2016). Therefore, findings in this meta-analysis are interpreted with a good degree of reliability.
Ammonia-N in silages results from protein breakdown by plant proteolytic enzymes or clostridial microorganisms (Ohshimaa and McDonald, 1978). An intensive clostridial action or a slow drop of pH in the silo can be responsible for producing silages with more than 12% ammonia-N concentration (Kung and Shaver, 2001). Ammonia-N concentrations of alfalfa silages used in this meta-analysis were not greater than 12%. However, even concentrations from 0.2 to 11%, showed a negative impact on DMI (Figure 1). The specific mechanism by which ammonia-N affects DMI is not well understood. Ammonium salt injected in goats (Conrad et al., 1977) or urea dosed in the rumen of Holstein steers (Bartley et al., 1981) resulted in cellular acidification and high ammonia concentration in the carotid artery, respectively, which affected the central nervous system and reduced feed intake. In this meta-analysis milk production just tended to decrease linearly in response to increasing ammonia-N concentration in alfalfa silage (Figure 2). In dairy cows, a depression of DMI reduces nutrient uptake, and decreases milk production since intake is the single most important factor affecting it (Weiss, 2015). Therefore, the inverse weak relationship between ammonia-N and milk production observed in this meta-analysis may be due to the ammonia-N concentration in alfalfa silage indirectly reduced milk production through a DMI depression. Similar to the findings of this meta-analysis, Van Os et al. (1995) reported DMI was reduced 0.8 Kg/d and milk production tended to decrease 2.2 Kg/d, in response to an increase in grass silage ammonia-N from 6 to 13%.
Milk fat and protein percentages were not affected by ammonia-N concentration in alfalfa silage (Table 2). However, increased ammonia-N in silage tended to decrease milk fat (Figure 3) and protein yields, but with a highly significant quadratic effect on milk protein yield (Figure 4). Huhtanen et al. (2003) found that ammonia-N concentration in grass silage is negatively correlated with the percentages and yields of milk fat and protein in dairy cows. They also observed that for milk protein yield a quadratic effect had a slightly better fi t than a linear model. In the current meta-analysis, milk fat yield may be reduced because milk production declines in response to ammonia-N concentration in alfalfa silage. The quadratic response of milk protein yield might be related to a combined effect of decreased milk production and the incorporation of ammonia-N from silage (>6.81% ammonia-N in this meta-analysis) into microbial protein or into the N flowing to the small intestine. It has been reported that soluble N from grass silages escapes ruminal degradation and contributes up to 10% to the intestinal amino acids supply in dairy cows (Volden et al., 2002), which can be later used for milk protein synthesis in the mammary gland (Doepel et al., 2002). Nevertheless, there is not firm evidence that high ammonia-N from silage contributes to milk protein synthesis through its integration into the pool of N used by the cow.
In conclusion, prediction models in this metaanalysis demonstrated that increased ammonia-N in alfalfa silage had a negative linear effect on DMI, but tended to reduce milk production, milk fat and protein yields. Milk production may be indirectly affected because DMI was reduced and milk fat yield declined in response to decreased milk production. Additionally, increasing ammonia-N in alfalfa silage had a significant quadratic effect on milk protein yield, which might be related to the reduced milk production and a possible contribution of high ammonia-N from silage to the nitrogen used by rumen bacteria, which is later used by the cow to produce milk protein.

