


 texto em
  Inglês (pdf)
 Artigo em XML
 Referências do artigo
 Enviar este artigo por email
 Citado por SciELO
  Citado por Google
  Similares em
SciELO
Similares em
SciELO  Similares em Google
 Permalink
Introduction
Early warning scores (EWS) are a group of clinical prediction rules based on physiological parameters which have been developed to alert to patients with a high risk of experiencing a serious adverse event during their stay in hospital wards 1. Throughout the coronavirus disease (COVID-19) pandemic, two of these scales have been used to try to guide the frequency of monitoring and disposition of patients: the U.K.'s National Early Warning Score (NEWS)-2 2, a 2017 update of a widely used and validated scale 3; and Liao's proposed modification of the previous scale, adding age greater than or equal to 65 years, which we will refer to here as mNEWS 4.
These clinical prediction rules assign 0-3 points to each of eight clinical variables for mNEWS and seven for NEWS-2. Based on the score obtained, the patients are divided into four risk groups. Recently, Huespe et al. 5 at Hospital Italiano de Buenos Aires (Argentina) developed a clinical prediction rule based on NEWS-2 called the COVID-19 Severity Index, adding another 10 variables produced by a two-round Delphi process in which experts from several countries participated. Its application in a cohort of 220 pa tients found that its ability to predict the need for intensive care admission at 24 and 48 hours was better than that of mNEWS, and NEWS-2.
We have witnessed the major efforts made to develop COVID-19 specific prognostic tools 6; currently, more than 22 models have been developed 7. However, a significant number of them had limitations in their development: poor reporting, excessive optimism and a high risk of bias 8. On the other hand, a COVID-19 application has been extrapo lated from scales designed for pneumonia 9,10, sepsis 11 or critical illness 12. The challenge lies in externally validating these rules to guarantee their generalization before recommending their use 7. This study aims to validate the mNEWS and NEWS-2 early warning scores, along with the COVID-19 Severity Index in a Latin American population of hospitalized patients.
Methods
A prospective, multicenter observational study was carried out which included patients hospitalized for SARS-CoV-2/COVID-19 infection, confirmed by a real-time polymerase chain reaction (RT-PCR) nasal swab test, from April 15 to November 30, 2020, in three quaternary care hospitals in Bogotá, Colombia. Patients who were directly admitted to the intensive care unit (ICU), were referred after 72 hours at another institution, in whom the study outcome was not known, or pregnant women and patients with any condition which seriously affected their short-term survival were excluded.
Patients were screened from the inpatient census at the three institutions and their data were recorded on a virtual form constructed with the data recommended by the WHO's International Severe Acute Respiratory and Emerging Infec tions Consortium (ISARIC) form. Scores for the three scales were calculated for each patient and the corresponding risk groups were determined for each scale.
Statistical analysis
Qualitative variables are reported as absolute frequencies and percentages. Quantitative variables are summarized with measures of central tendency and dispersion according to the distribution of the variables. An ROC curve was constructed for each of the prediction rules with regard to predicting clinical worsening (defined as transfer to the intensive care unit) and inpatient death, calculating the area under the curve (AUC) and its respective 95% confidence intervals (CIs). Taking seven as the cut-off for mNEWS and NEWS-2, and eight for the COVID-19 Severity Index (CSI), contingency tables were constructed and the operating characteristics (sensitivity, specificity, precision, positive and negative predictive values, positive and negative likelihood ratios) were calculated for the described outcomes.
The calibration of each of the rules for predicting ICU admission or death was verified, plotting the scores obtained (x-axis) against the proportion of events observed (y-axis) using locally estimated scatterplot smoothing (LOESS) curves, and the Brier score was also calculated. The analyses were conducted with the R version 4.0.2 (R Foundation, Vienna, Austria) statistical program, using the "pROC" and "ROCit" packages.
This study was approved by the ethics and research com mittees of each of the institutions and informed consent was not considered to be necessary due to the retrospective nature of the study. Financing was received from the Research Stimulus call number DI-I-0631-20 of the research division at Fundación Universitaria de Ciencias de la Salud.
Results
Between April 15 and November 30, 793 patients were included, 711 of whom had complete data for this analysis. A total of 124 were from Hospital El Tunal, 248 from Hospital San José, and 339 from Hospital Infantil Universitario de San José. Clinical worsening requiring ICU transfer occurred in 186 patients (26.2%) and 120 patients (16.9%) died. Table 1 describes the population's characteristics and laboratory results; in summary, 274 patients were female (38.5%), the average age was 59.7 years (SD 15.9) and the duration of symptoms prior to admission was 7.7 days (SD 6.1). The most common comorbidities were hypertension in 262 (36.8%), diabetes in 139 (19.1%) and chronic pulmonary disease in 90 (12.6%); 32.8% of the patients were obese and 20.8% were smokers; 629 (88.5%) had infiltrates on chest x-ray. The average lymphocyte count was 1,200 cells/μL (SD 1,800), average ferritin was 1,112 (SD 1,315), average lactate dehydrogenase was 544 (SD 318) and average LDH was 476 (SD 276). Troponin was positive in 142 of the 654 patients in which it was measured (21.7%).
Table 1 General characteristics of the population.
| Characteristic | Study population (n= 711) | Admitted to ICU (n= 186) | Non-survivors (n= 120) |
|---|---|---|---|
| Female sex, n (%) | 274 (38.5%) | 64 (34.4%) | 45 (37.5%) |
| Age (years), n (%) | 59.7 (15.9) | 60.5 (14.1) | 70.7 (13.5) |
| Comorbidities, n (%) | |||
| Hypertension | 262 (36.8%) | 74 (39.8%) | 58 (48.3%) |
| Diabetes mellitus | 139 (19.1%) | 41 (22.0%) | 26 (21.7%) |
| Chronic heart disease (except hypertension) | 72 (10.1%) | 24 (12.9%) | 18 (15.0%) |
| Chronic kidney disease | 37 (5.2%) | 13 (7.0%) | 13 (10.8%) |
| Smoking | 148 (20.8%) | 49 (26.3%) | 28 (23.3%) |
| Chronic pulmonary disease | 90 (12.6%) | 21 (11.3%) | 18 (15.0%) |
| Active cancer | 16 (2.2%) | 2 (1.1%) | 3 (2.5%) |
| Obesity (n/number of patients in which it was measured, %) | 117/357 (32.8%) | 40/106 (37.7%) | 17/55 (30.9) |
| Duration of the disease prior to hospitalization (days), mean (SD) | 7.7 (6.1) | 8.0 (8.0) | 8.8 (10.4) |
| Laboratory tests | |||
| White blood cell count (x103 cells per ¡¡L), average (SD) | 9.1 (4.9) | 10.3 (4.5) | 10.0 (5.2) |
| Lymphocyte count (x103 cells per ¡¡L), average (SD) | 1.2 (1.8) | 0.9 (0.5) | 0.9 (0.7) |
| Lymphocytes under 1.0 x10 cells per ¡¡L (n, %) | 411 (57.8%) | 126 (67.7%) | 84 (70.0%) |
| Creatinine (mg/dL), average (SD) | 1.3 (3.7) | 1.3 (1.6) | 1.6 (1.8) |
| Ferritin (ng/mL), average (SD) | 1,112 (1,315) | 1,380 (1,397) | 1,258 (1,403) |
| D-dimer (¡ig/mL), average (SD) | 1,616 (5,030) | 1,749 (3,564) | 2,396 (4,400) |
| Lactate dehydrogenase (U/L), average (SD) | 476 (276) | 567(323) | 542 (258) |
| Positive high-sensitivity cardiac troponin I (n/number of patients in which it was measured, %) | 142/654 (21.7%) | 56/178 (31.4%) | 46/113 (40.7) |
| Severity scales, average (SD) | |||
| SOFA on admission | 2.5 (1.7) | 3.0 (1.9) | 3.4 (2.2) |
| qSOFA on admission | 0.4 (0.6) | 0.6 (0.6) | 0.6 (0.7) |
| CURB-65 | 0.8 (0.9) | 1.0 (1.0) | 1.5 (1.0) |
| Length of hospital stay (days), average (SD) | 11.0 (10.8) | 19.4 (14.8) | 13.7 (9.8) |
| SD: Standard Deviation, SOFA: Sequential Organ Failure Assessment, qSOFA: Quick Sequential Organ Failure Assessment. | |||
Table 2 shows the results of the areas under the ROC curve of the different clinical prediction rules for the two outcomes, and Figure 1 shows the ROC curves. In general, the predictive ability may be considered modest for all the explored contexts. The table indicates that the risk group form of the scales performs worse than their numerical counterpart. The CSI scale showed a slight advantage for predicting intensive care unit admission (AUC of 0.66 with a 95% CI of 0.61-070), although the confidence intervals overlap. In predicting death, both mNEWS and CSI per formed similarly (AUC of 0.68). NEWS-2 had the worst performance, with an AUC of 0.63 and 0.58 for predicting ICU admission and death, respectively.
Table 2 Results of the areas under the ROC curve of the various early warning scores.
| ICU admission | Inpatient death | |||
|---|---|---|---|---|
| Score | AUC | 95% CI | AUC | 95% CI |
| MNEWS | 0.6116 | 0.5659-0.6573 | 0.6836 | 0.6311-0.7362 |
| Categorized mNEWS | 0.5992 | 0.5574-0.641 | 0.6397 | 0.5942-0.6852 |
| NEWS-2 | 0.6298 | 0.5840-0.6755 | 0.5792 | 0.5210-0.6374 |
| Categorized NEWS-2 | 0.6131 | 0.5695-0.6567 | 0.5691 | 0.5145-0.6236 |
| COVID-19 Severity Index | 0.6561 | 0.6098-0.7024 | 0.6810 | 0.6274-0.7346 |
| Categorized COVID-19 Severity Index | 0.5460 | 0.5169-0.5751 | 0.5544 | 0.5232-0.5855 |
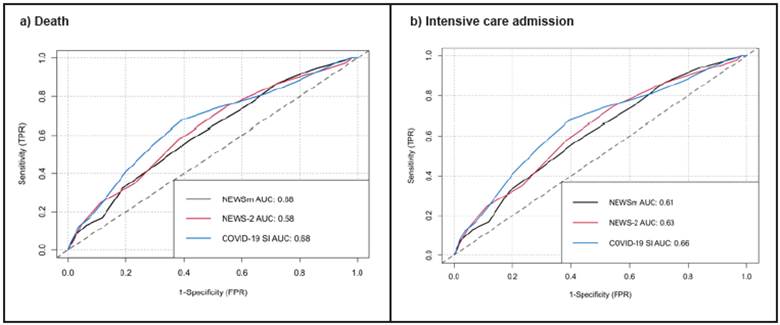
Figure 1 ROC curves of the different scales: a) for death, b) for intensive care admission. AUC: Area under the ROC curve, mNEWS: modified National Early Warning Score, NEWS: National Early Warning Score, COVID-19 SI: COVID-19 Severity Index.
The calibration of the different scales was good for admission to intensive care, while for death it was poor to moderate (Figure 2). The Brier score for death was 0.41, 0.31 and 0.68, and for ICU admission was 0.42, 0.34 and 0.61 for mNEWS, NEWS-2 and CSI, respectively. Table 3 displays the operating characteristics for each clinical prediction rule. NEWS-2 showed the greatest precision in predicting ICU admission and death (65.8% and 68.6%, respectively), as well as the best specificities (76.8% and 75.5%, respectively). The CSI scale had the highest sen sitivity for predicting ICU and death (87.6% and 90.0%, respectively), but with the lowest specificities.

Figure 2 Calibration through LOESS curves of the various clinical prediction rules for predicting intensive care admission or death. mNEWS: modified National Early Warning Score, NEWS: National Early Warning Score, CSI: COVID-19 Severity Index, ICU: Intensive Care Unit.
Table 3 Operating characteristics of the clinical prediction rules for each prespecified cut-off point.
| Prediction rule | MNEWS cut-off point: 7 | NEWS-2 cut-off point: 7 | COVID-19 SI cut-off point: 8 | |||
|---|---|---|---|---|---|---|
| Outcome | ICU admission | Death | ICU admis sion | Death | ICU admission | Death |
| True positives | 107 | 79 | 65 | 42 | 163 | 108 |
| True negatives | 305 | 343 | 403 | 446 | 111 | 122 |
| False positives | 220 | 248 | 122 | 145 | 414 | 469 |
| False negatives | 79 | 41 | 121 | 78 | 23 | 12 |
| Precision (%) | 57.9 | 59.4 | 65.8 | 68.6 | 38.5 | 32.3 |
| Sensitivity (%) | 57.5 | 65.8 | 34.9 | 35.0 | 87.6 | 90.0 |
| Specificity (%) | 58.1 | 58.0 | 76.8 | 75.5 | 21.1 | 20.6 |
| Positive predictive value (%) | 32.7 | 24.2 | 34.8 | 22.5 | 28.2 | 18.7 |
| Negative predictive value (%) | 79.4 | 89.3 | 76.9 | 85.1 | 82.8 | 91.0 |
| LR+ | 1.373 | 1.569 | 1.504 | 1.427 | 1.111 | 1.134 |
| LR- | 0.731 | 0.589 | 0.847 | 0.861 | 0.585 | 0.484 |
Discussion
COVID-19 has become a public health challenge in our times, having been declared a pandemic a year ago already 13. By April 2021, close to 140 million cases had been reported, reaching three million deaths worldwide 14. Most countries have faced a healthcare crisis regardless of the public health policies adopted to mitigate contagion; since we are still in a very incipient vaccination phase, we continue to be vulnerable to new crises of this type. In this context, identifying the variables related to a negative clinical outcome is key for conducting timely triage and adapting the intensity of care to the needs of each patient, allowing an effective strategic planning for better use of the resources 5. A scoring system can help emergency room, ward or intensive care physicians quickly and accurately identify patients with a greater risk of clinical worsening or death 15.
This study presents the validation of three early rating scales in a large population of Latin American patients hos pitalized for COVID-19. We documented a poor to moderate ability to predict clinical worsening (AUC of 0.61, 0.63 and 0.66) and death (AUC of 0.68, 0.58 and 0.68) for mNEWS, NEWS-2 and CSI, respectively. This result contrasts with what the Huespe group found in the article introducing CSI 5, which reported AUCs of 0.88, 0.80 and 0.94 for mNEWS, NEWS-2 and CSI, respectively, when applied 24 hours before intensive care admission, and of 0.84, 0.62 and 0.88 when applied 48 hours before. Carr et al.'s study evaluated mNEWS in 1,276 hospitalized patients, finding an AUC of 0.70 (95% CI 0.68-0.72) for ICU admission or death at 14 days 16.
Fan et al.'s study recorded a NEWS-2 AUC of 0.81 (95% CI 0.77-0.85) for inpatient death among 654 patients; tak ing a cut-off point of five, they found a sensitivity of 0.79 (95% CI 0.72-0.86), specificity of 0.69 (95% CI 0.65-0.73), positive predictive value of 0.40 (95% CI 0.34-0.46) and negative predictive value of 0.93 (95% CI 0.90-0.95), con firming that this last parameter is very high, as we recorded in our study 17. A study by Hu's group validated an early EWS known as the Modified Early Warning Score (MEWS) in 138 patients with critical COVID-19, finding a 0.68 AUC for predicting death (95% CI 0.54 to 0.81), very similar to our group's findings 18.
To our knowledge, this is the first validation of the COVID-19 Severity Index, a Latin American effort which opted for a less-used methodology for creating prediction rules today: the Delphi process. Variables selected and weighted through a survey of experts in various areas and with diverse backgrounds were added; although it requires 10 additional variables, only D-dimer could be a limitation to its application on admission. It is hard to consider CSI as, essentially, an EWS, but since it is based on NEWS-2, we decided to evaluate it in this study. While it had the highest performance of the three scales, the number of false posi tives was very high, giving it the lowest specificity (21.1% and 20.6%), thus limiting its potential clinical usefulness.
Despite the wide use of this type of clinical prediction rules, the use of EWSs is not free of controversy; in the United Kingdom, their use has been proposed for decision making regarding ambulance transfers and admissions from the emergency room, as well as pediatric evaluation, without sufficient validation yet 19. It is argued that the use of common scoring systems helps generate appropriate communication in the patients' different care settings 20, but decision making is a complex issue which is not always easy. No score can communicate an experienced physician's intuition, and summarizing clinical observations in a simple score may risk becoming a cognitive shortcut leading to biases and medical errors 21. In light of this, there must be sufficient studies to validate these tools, and the results to date do not seem to support their adoption as a single strategy for determining risk.
This study has several limitations: the populations in cluded came from quaternary care institutions, which could introduce selection bias, as these patients have a greater baseline severity. The variables were evaluated on admission to the ward, while the outcome was evaluated at any time during hospitalization; EWS evaluations generally describe short-term (24-72 hour) outcomes, which could affect the performance presented. Furthermore, the indications for intensive care admission versus actual transfers may have varied between the various centers or over time, depending on the status of the pandemic or the availability of intensive care beds. As strengths, we recognize its multicenter nature, the large number of patients and outcomes, and having included calibration of the various scales.
Conclusions
Early warning scores have been used to identify patients at risk for negative COVID-19 outcomes. In this study, we showed that the three scales had low to moderate discrimination for the study outcomes: an AUC of 0.68, 0.58 and 0. 68 for death and 0.61, 0.63 and 0.66 for ICU admission for mNEWS, NEWS-2 and CSI, respectively. The addition of laboratory and imaging parameters in the CSI scale im proved its predictive capacity at the expense of a high rate of false positives. Thus, we cannot support the decision to transfer a patient to intensive care based solely on one of these prediction rules.

