


 Inglês (pdf)
 Artigo em XML
 Referências do artigo
 Enviar este artigo por email
 Citado por SciELO
  Citado por Google
  Similares em
SciELO
Similares em
SciELO  Similares em Google
 Permalink
1. Introduction
Road traffic accidents (RTA) represent one of the most important health and social policy issues around the world. Approximately 1.35 million people die annually due to RTA, and between 20 and 50 million people are seriously injured, requiring costly and long-term treatment [1]. WHO predicts RTA will be the fifth leading cause of death worldwide in all age intervals by 2030. RTA also causes enormous social and economic losses, absorbing between 1% and 3% of the gross domestic product of most countries. Moreover, about 93% of road traffic fatalities (RTF) occurred in low and middle-income countries, where reported road traffic mortality rates are three times higher compared to high-income countries [1].
According to the WHO, more than 100,000 deaths occur in Latin America every year, and approximately more than 5 million people are injured due to traffic accidents. Multiple studies have shown a significant increase in traffic accidents in the region. A study that explored the epidemiology of traffic accidents in Medellin, Colombia, evidenced that between 2010-2015 an average of 45,000 accidents per year were reported, approximately 135 accidents per day, with 50% of the accidents associated with injuries, and that the number of unreported accidents maybe even 4 times higher than the official Figures [2].
Evidence from road safety research is very limited in America Latina. Although there are official accident Figures available for most countries in the region, regulatory institutions usually do not delve into the information and generally only carry out descriptive analysis [1,3,4]. Also, in many Latin-American countries, there may be a serious underreporting of RTA [1,5]. Indeed, many RTA are excluded from or not captured by official surveillance systems, especially when, during the event, the persons involved did not suffer any injury or only mild injures, or when they did not have the resources to receive private medical care or had limited access to public health care [6,7]. Furthermore, published research findings, within the field of road safety, are available mostly from gray literature (project reports, academic thesis, and papers published in non-peer-reviewed journals). Very few studies from the region are published in peer-review journals [1,4], and there is a lack of studies focused on identifying traffic accident typologies in Latin America. This type of information is relevant to designing, implementing, and evaluating community and country-level interventions.
Over the years, researchers have used a wide range of methodological tools to assess RTA occurrence and risk factors [8]. Most frequently, regression techniques like linear, multi-linear, logit, and Poisson regression have been used for statistical modeling [9]. Recent methodological advances have enabled the development of more sophisticated models [10]. The feasibility of applying these approaches for RTA research in Latin American countries and the validity of their results are limited or affected by several factors such as deficiencies of the existing registry and data collection systems at local and national levels, nature and characteristics of measured variables, research infrastructure, and funding, and lack of trained personnel [6,11,12]. Therefore, there is a need to identify statistical tools and technics that are both valid and feasible to be implemented in low resource settings, focusing not only on assessing RTA occurrence and risk factors but on identifying individual typologies of those at most risk of suffering an RTC. Previous studies from Latin America have proved the value of using exploratory tools to investigate RTA patterns; For instance, a study carried out in Medellin, Colombia, implemented a geographical approach to perform spatial and exploratory analysis to identify RTC patterns based upon a K-means clustering model [13].
Over the years, one of the techniques that have proved to be useful in identifying RTC patterns and typologies in several regions of the world is the multiple correspondence analysis (MCA) [14,15]. MCA is a statistical visualization method for picturing the association between the levels of categorical variables (CVs). Specifically, MCA is used to analyze multiway data, contributing to detecting and representing underlying structures in a data set. In social sciences [16], marketing [17], economy [18], and health sciences [19], MCA has been used to detect individual and event profiles or typologies, alone or in combination with another technic such as hierarchical clustering. Several studies on road safety have highlighted the value of MCA in studying persons and events (accidents) typologies [14,15]. Some of the advantages of MCA that make it suitable for RTA research in low resource settings are the following: 1) it is specifically designed to deal with nominal or ordinal categorical data, the type of information usually collected in community-based surveys; 2) the availability of several low-cost or even free licensed statistical software that allows its application, and 3) the MCA low learning curve. Moreover, from the statistical point of view, MCA represents an unsupervised (driven by data) approach relatively free from assumptions, and it may represent linear and non-linear relationships equally well [20].
Toward addressing the aforementioned issues, we investigated self-reported RTA and associated factors among drivers from Ecuador, where RTA represents the sixth leading cause of death (Between 2008 and 2019, 327,154 traffic accidents were registered in Ecuador, causing 242,767 injuries and 25,133 deaths). WHO estimates RTF rate for Ecuador (21.3 deaths per 100,000 inhabitants) is significantly higher than the overall rate estimated for Latin America (15.6 deaths per 100,000 inhabitants) [1]. We selected as a case study the city of Loja, capital of Loja province, located in southern Ecuador, and conducted a web-based survey aimed to estimate the proportion of drivers who have been involved in a traffic accident at least once at any time in life (accident rate) and to explore the typology of both the people involved in the accidents and the events through MCA. Additionally, we studied selected relevant factors that may significantly increase the risk of being involved in a traffic accident.
2. Method
2.1 Study design, setting, and source population
We carried out a descriptive cross-sectional study by implementing a web-based survey on self-reported traffic accidents among people with a valid driver's license, from the city of Loja, the most populated and largest city of the province of Loja, with an estimated population of 181,000 inhabitants [21] and 745,93 km of road infrastructure [22]. According to data provided by authorities of the National Transit Agency (ANT in Spanish) in Loja, the current number of people residing in the city with a valid driving license is 95,973 [23].
2.2 Sample size and participant enrollment
The required number of respondents was established by multiplying the sample size needed under simple random sampling by a design effect factor of 2, for prevalence estimate since there is evidence that for studies using respondent-driven sampling or snowball sampling, a sample size twice as large as would be needed under simple random sampling, would approximate an unbiased prevalence estimate [24].
The study sample size was calculated using the following equation (1) for estimating a population proportion, with a finite population correction.
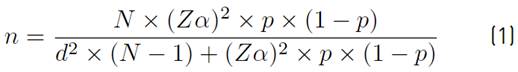
The survey’s margin of error (d) and confidence level (Zα) were set at 0.05 and 95% (Zα=1.96), respectively. The expected proportion of the event of interest (p), corresponding to the expected life prevalence of RTC was set at 0.35 based on previous reports for a similar population [1,25,26]. After applying a design effect of 2, a sample size of 696 was obtained as the minimum number of individuals required to estimate the prevalence of self-reported RTC. All calculations were done using the sample size calculator for population surveys contained within the module STATCAL of the software Epi Info™ 7.2.5.0. [27] StatCalc algorithms and formulas were provided by www.OpenEpi.com [28].
Potential subjects were identified and invited to participate by non-probability virtual snowball sampling [29,30], a sampling method frequently applied for online surveys through social networks (Facebook, WhatsApp, Instagram, LinkedIn), which consisted of inviting a core group of participants, whom then invited another second-level core of individual and then each member of the second level invited another core group until the required number of positive responses was reached. This procedure was carried out through a specific invitation algorithm for social networks known as online advertising directed to an interest group (online targeted advertising) by using Facebook’s advertising ads and Google Ads, a method described elsewhere [31-33].
Everyone who met the following criteria was invited to participate in the study: 1) age ≥16 years; 2) regularly residing in the city of Loja; 3) having a valid driver's license issued by the ANT; 4) having access to the internet services; and 5) participating in a web-based social network (Facebook, WhatsApp, Instagram, LinkedIn). Overall, 83 questionnaires were excluded (21 did not reside in the city of Loja, 43 did not fully complete it and 19 reported not having a currently valid driving license) and 754 respondents completed the questionnaire satisfactorily.
The sex and age distribution of the study sample were compared to demographic information reported by the National Transit Agency (ANT) in Loja. This comparison suggested that the sample was representative of the population of drivers from Loja concerning age and sex distribution.
2.3 Data collection method and questionnaire
Data collection was conducted from April to June 2021. Subjects were asked to answer in a single occasion an online self-administered questionnaire, which was made available on Google Forms and distributed through popular online social networks (Facebook, WhatsApp, Instagram, LinkedIn), following procedures, previously described.
A structured 15-items questionnaire was constructed based on the literature review as well as on selected questions adapted from The Road Risk Perception Survey in the City of Bogotá carried out in 2019 [34] and from the E-Survey of Road Users Attitudes (ESRA 2018) [35]. The questionnaire addressed questions about respondent involvement in traffic accidents, demographic characteristics, driving habits, self-perception of roads infrastructure conditions, event-related characteristics, and perception of causal factors of the accident.
Once respondents completed the questionnaire, information was exported in real-time to a database in a .csv file in the cloud and stored in a Google Drive account for further processing.
2.4 Study variables
Self-reported participation or involvement in RTC at least once at any time in life (yes/no) was considered the primary outcome variable, regardless of the type of participation during the event (driver, passenger, or pedestrian). Based on this variable, we determined the lifetime prevalence of RTC (accident rate), which corresponds to the proportion of a population that, at some point in their life, has experienced a particular life event, risk factor, or disease [1,36].
The secondary outcome variable was the type of accident [Table 1]. Major categories of types of accidents were extracted and adapted from the glossary for transport statistics developed by the United Nations Economic Commission for Europe (UNECE), the International Transport Forum (ITF) and the Statistical Office of the European Union (Eurostat) [36].
Three groups of exposure (independent) variables or factors potentially associated with the occurrence of RTC were investigated in all respondents: 1) sociodemographic characteristics; 2) driving habits (behavioral factors), and 3) perception of road infrastructure conditions.
Those respondents who reported participation or involvement in RTC provided information on circumstantial or event-related factors. When respondents suffered more than one accident, they were asked to provide information only regarding the most recent accident or event [Table 1].
2.5 Statistical analysis
All statistical analyses were carried out with IBM® SPSS® Statistics version 25. Descriptive statistics, including frequencies and proportions, were used to summarize the data. The lifetime prevalence (LP) of RTC and its respective 95% confidence interval (CI), were also estimated. We explored potential relationships between multiple categorical variables through MCA, to identify a typical person who would likely be involved in RTC at least once in life and a typical road traffic crash. MCA is used to represent and model data sets as "clouds" of points in multidimensional Euclidean space by locating each variable, category, or unit of analysis as a point in a low-dimensional space (MCA plot) [20]. The results are interpreted based on the relative positions of the points and their distribution along the dimensions. Points (categories) that are close to the mean are plotted near the MCA plot's origin, and those that are more distant are plotted farther away. Categories with a similar distribution are near one another on the map as groups, while those with different distributions stay farther apart [20,37]. In a two-dimensional graphical display of the data, categories sharing similar characteristics are located close together, forming point clouds. In other words, points located in the same direction of the origin and the same region of the space present more chances of being associated with each other [20]. A detailed discussion of principles, concepts, and procedures are published elsewhere [20,37,38].
Here we performed two MCA, one to explore the typology (profile) of people who have suffered an RTC, including in the analysis all respondents (n=754) (MAC1), and another one to explore the typology of RTC (based on event characteristic) including in the analysis only those who reported involvement in an RTC (n=313) (MCA2). For MCA1, the following variables were included as active variables in the MCA: 1) Participation in a RTC 2) age; 3) gender; 4) principal mean of transportation; 5) habit of speeding; 6) alcohol consumption; 7) frequent sensation of distraction when driving; 8) frequent sensation of urgency when driving; 9) frequent use of the mobile phone when driving; 9) lack of use of seat belts and other safety restraints, and 10) perception of road infrastructure condition at the municipality. For MCA2, the following variables were included as active variables:1) type of RTC; 2) Location of the accident (according to the road speed limit), 3) time of the accident; and 4) aggregated (grouped) categories of reported RTC causal factors. No supplementary variables were included as part of the MCA, neither for MCA1 nor MCA2.
In both MCA1 and MCA2, all variables have multiple nominal scaling levels, and we used variable principal as the normalization method and grouping as the discretization method. The discretization option automatically categorizes a fractional-valued variable by grouping its values into categories with a close-to-normal distribution. For MCA1 and MCA2, the first solution included the maximum number of possible MCA dimensions, calculated from the difference between the sum of variables categories and the number of variables. For MCA1 it corresponds to 27 minus 12, to yield 15 MCA dimensions. For MCA2 it corresponds to 16 minus 4, to yield 12 MCA dimensions [39]. To define the number of dimensions to retain, the following criteria/considerations were employed: 1) scree test; 2) eigenvalue (inclusion of MCA dimensions with inertia above 0.2); and 4) although no defined number of dimensions is firmly established, some authors recommend two-dimensional pictures of data (which facilitates and allows for data interpretation).
Table 1 List of variables and corresponding categories
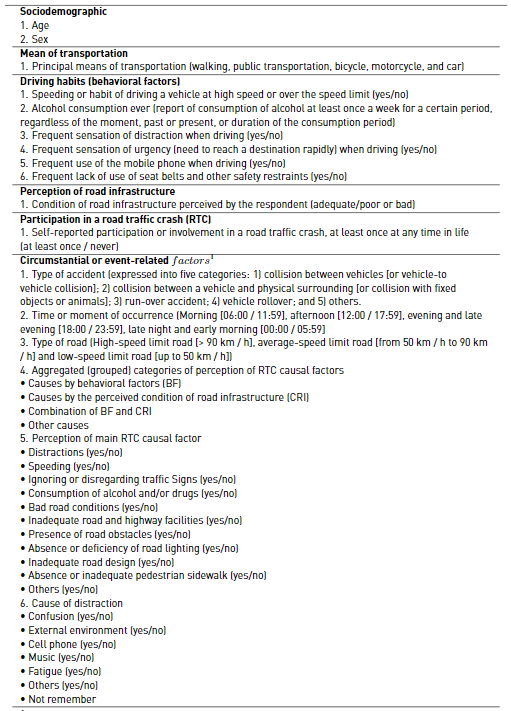
1Data corresponds to the latest event or RTC reported.
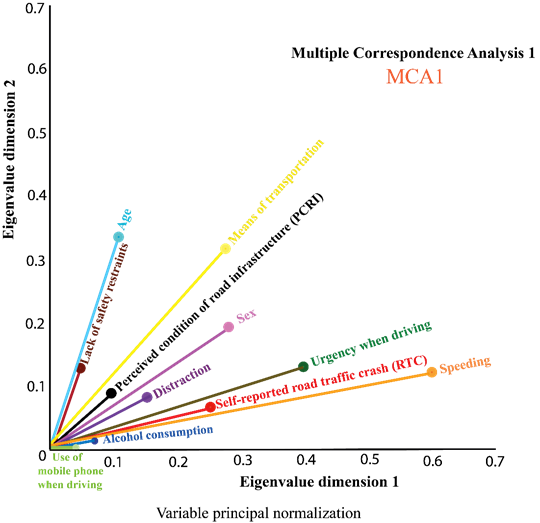
Based on these criteria, we obtained a second solution with just two dimensions for both MCA1 and MCA2. We report model summary and discrimination measures for each MCA with a two-dimension solution. The results are illustrated through two plots: 1) discrimination measures plots that represent the proportion of the variance that is explained by the variable in each dimension, reflecting how much each variable discriminates in each dimension, indicating thus the importance of variables for each of the dimensions; and 2) joint category plots, to represent the position of variable categories with respect to the point of origin and the axes of the coordinate plane, here the distance between the categories suggest the presence or absence of association between the categories.
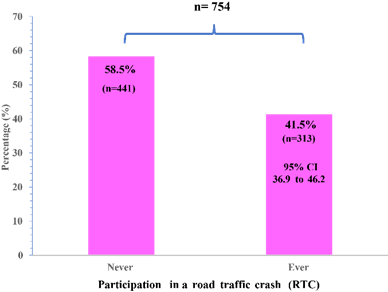
Figure 1 Lifetime prevalence of self-reported road traffic crashes among drivers from Loja, Ecuador.
We additionally explored factors that may be associated with the lifetime prevalence of Self-reported RTC among drivers through bivariate and multivariate binary logistic regression to further evaluate the consistency of MCA findings. The Chi-square test was used to assess statistical significance for all potential predictors. Next, we performed a binary logistic regression analysis to estimate unadjusted odds ratios (OR) for all variables, including in the model one variable at a time. Then we estimated adjusted OR, introducing all variables in the model, simultaneously (enter method). We reported p values (based on the Wald test) and 95% CI for all OR. Assumption and procedures for binary logistic regression are described elsewhere [40,41].
3. Results
3.1 Lifetime prevalence of self-reported RTC
A total of 754 drivers with a valid license from the city of Loja agreed to participate in the study and satisfactorily completed the questionnaire. Overall, 313 respondents reported participation or involvement in an RTC at least once at any time in life, corresponding to a lifetime prevalence of self-reported RTC of 41.5% (95% CI 36.9 to 46.2) [Figure 1].
3.2 Typology (profile) of people who have suffered an RTC (MCA1)
Table 2 summarizes the frequency distributions of selected variables (demographic characteristics, principal means of transportation, driving habits, and perceived condition of road infrastructure) that are included in the MCA1 model aimed at identifying the typology of people who have suffered an RTC among drivers from Loja, Ecuador. Participation of both women (51.5%) and men (48.5%) were similar. Most of the participants belonged to 25 to 60 years (72%). Principal means of transportation were car (69%), public transportation (17.1%), and walking (8,6%). A considerable proportion of drivers reported risky habits such as driving above the speed limit (39.4%), distraction when driving (27.7%), urgency (19.1%), use of the mobile (11.3%), consumption of alcohol (7.6%) and lack of use of safety restraints (5.6%). Also, most of the respondents considered road conditions in Loja are deficient (70.6%). The joint plot of category points of MCA1 suggests the presence of 4 category clouds [Figure 2]:
The First cloud corresponds to the association of the following categories: Experience an RTC at least once, 25 to 40 years of age, frequent sensation of distraction when driving (yes), frequent use of the mobile phone when driving (yes), car as the principal mean of transportation, and perceived condition of road infrastructure as poor.
The Second cloud corresponds to the association of the following categories: male sex, the habit of driving a vehicle at high speed or over the speed limit (yes), alcohol consumption ever (yes), and frequent sensation of urgency when driving (yes).
The Third cloud corresponds to the association of the following categories: never experience an RTC, 16 to 24 and >60 years of age, no frequent sensation of distraction when driving (yes), walking as the principal mean of transportation, and perceived condition of road infrastructure as adequate.
The Fourth cloud corresponds to the association of the following categories: female sex, no habit of driving a vehicle at high speed or above the speed limit, and no frequent sensation of urgency when driving.
Table 2 Frequency distributions1 of selected variables that are included in the MCA12 model.
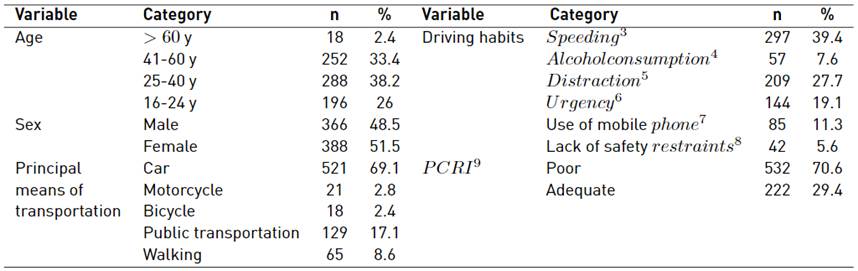
1Frequencies are based on information provided by all surveyed drivers from Loja Ecuador (n=754).
2The multiple correspondence analysis 1 (MCA1) aimed at identifying the typology of people who have suffered a road traffic crash (RTC).
3Habit of driving a vehicle at high speed or above the speed limit.
4Report of consuming alcohol at least once a week for a certain period, regardless of the moment, past or present, or duration of the consumption period (consumption ever).
5Frequent sensation of distraction when driving.
6Frequent sensation of urgency when driving (need to reach a destination rapidly).
7Frequent use of the mobile phone when driving.
8Lack of use of seat belts and other safety restraints.
9Perceived condition of road infrastructure (PCRI) at the municipality, referred by the respondent.
In Table 3, we present variables included in the model, model summary and discrimination measures of the MCA carried out to identify a typology of people who have suffered a RTC, at least once, at any time in life (MCA1). In MCA1, we included information from all respondents (n=754). The total inertia of our model was 33.6%, the first dimension explained 20.7% of the variance, and the second dimension was 12.9%. The ACM revealed an average Cronbach's alpha coefficient for the model of 0.505. Cronbach's alpha for the first and second dimensions were 0.616 and 0.327, respectively. Based upon eigenvalues, the variables that best discriminate dimension 1 are: 1) self-reported RTC (0.254); 2) sex (0.279); 3) speeding (0.626) and 4) frequent sensation of urgency when driving (0.383). The variables that best discriminate dimension 2 are: 1) age (0.335); 2) principal means of transportation (0.334); and 3) lack of use of seat belts and other safety restraints (0.127).
We can observe in the discrimination measures plot, that the variable representing RTC occurrence is close to the following variables: alcohol consumption, use of mobile phone, speeding, frequent sensation of urgency, and distraction [Figure 3].
3.3 Typology of RTC (based on event characteristics)
Table 4 shows RTC or event-related characteristics referred by those reported having been involved in an RTC (n=313). Type of accident, time of occurrence, location, and cause category of RTC were included in the MCA2 to explore the typology of RTC (based on event characteristics) among drivers from Loja, Ecuador. Collision vehicle-to-vehicle (71.6%) and collision with fixed objects or animals (20.8%) were the most common type of RTC. The most frequent places and times of event occurrence were low-speed limit roads (59.7%) and afternoon hours (39.9%), respectively.
Additionally, we summarize in table 4 specific causes of RTC and causes of distraction, reported by the drivers. However, these variables were not included in the MCA2 analysis. The most common causes of accidents were distractions (42.5%), ignoring traffic signs (26.5%), speeding (20.4%), and consumption of alcohol or drugs (15%). Likewise, in relation to "reason for distraction" section, respondents indicated confusion (73.7%), external environment (44.4%), mobile phone (25.6%), music (12.8%) and fatigue (9.0%), as the most frequent ones.
The joint plot of category points suggests the presence of 2 distinctive category clouds [Figure 4]. The first cloud suggests an association between the following categories: collision vehicle-vehicle as the type of RTC, behavioral factors as the group of causes of RTC, low-speed limit roads as the location of occurrence, and afternoon as the moment of occurrence. The second cloud indicates an association between the following categories: collision with fixed objects or animals as the type of RTC, average-speed limit roads as the location of occurrence, and evening/late evening as the moment of occurrence [Figure 4].
We can observe in the discrimination measures plot that the variables representing the time of occurrence and type of RTC are close to each other (and probably associated), while cause and location seem to be associated [Figure 5].
In Table 5, we report model summary and discrimination measures of the MCA carried out to identify a typology of event or road traffic crash (MCA2). Here we included in the model information only from respondents who have suffered a RTC, at least once, at any time in life (n=313).
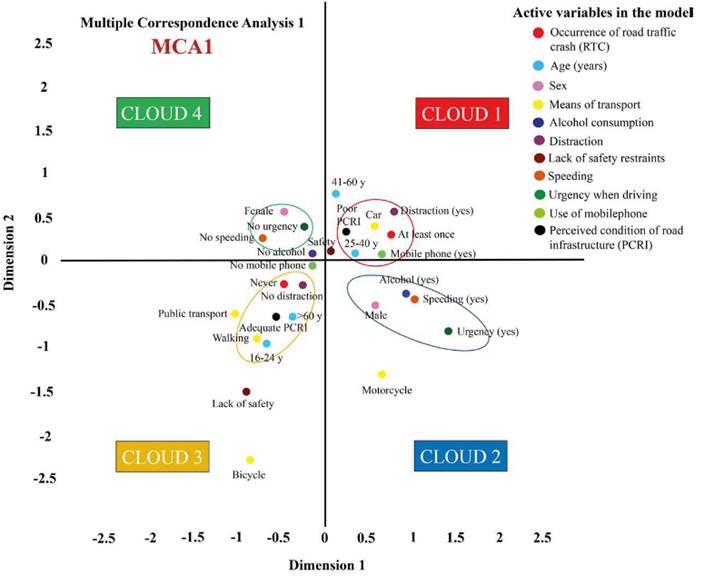
Figure 2 MCA1 joint plot of category points. MCA1 aimed at identifying the typology of people who have suffered a road traffic crash (RTC). Clouds represent groups of potentially associated categories.
Results correspond to a 2-dimensional solution. The total inertia of our model was 72.9%, the first dimension explained 40.9% of the variance and the second dimension was 32%. The ACM revealed an average Cronbach's alpha coefficient for the model of 0.419. Cronbach's alpha for the first and second dimensions were 0.519 and 0.292, respectively.
Based upon eigenvalues, the variables that best discriminate dimension 1 are the location of occurrence (0.470), and the cause of RTC (0.371). The variable that best discriminates dimension 2 is the time of occurrence (0.496). Type of RTC contributes similarly to dimensions 1 (0.546) and 2 (0.539) [Table 5].
Table 6 shows the results of crude and adjusted odds ratios (OR) estimation carried out by bivariate and multivariate binary logistic regression analysis.
The model suggested that age between 25 and 40 (OR 2.3; 95% CI 1.5-3.6; p< 0.0001) and 41 to 60 (OR 2.4; 95% CI 1.5 - 3.9; p<0.0001) of age, the habit of speeding (OR 2.3; 95% CI 1.4-3.6; p=<0.0001), alcohol consumption (OR 7.9; 95% CI 3.7-16.8; <0.0001), frequent sensation of distraction (OR 2.9; 95% CI 2- 4.2; p<0.0001) and frequent use of mobile phone (OR 4.4; 95% CI 2.5-7.7; p<0.0001), are associated with a significant increase in self-report RTC, among drivers from the city of Loja.
Table 3 Model summary and discrimination measures of the MCA1 model.1
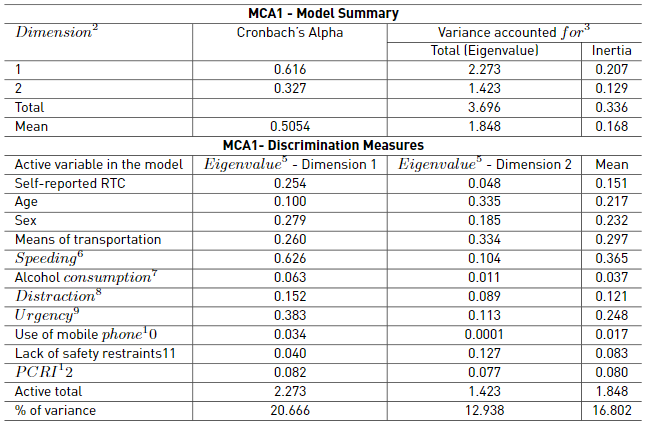
1The multiple correspondence analysis 1 (MCA1) aimed at identifying the typology of people who have suffered a road traffic crash (RTC). Here, information from all respondents (n=754) was included in the model.
2This model represents a 2-dimensions solution for the MCA.
3The eigenvalue and inertia describe the amount of variation the dimension explains, therefore allowing us to evaluate which dimension accounts for most of the variability in the data. Dimension 1 explained 20.7% of the variance and dimension 2 explained 12.9% of the variance.
4Mean Cronbach's Alpha is based on the mean Eigenvalue.
5The eigenvalue of each variable active in the model represents the contribution to the variance in each dimension.
6Habit of driving a vehicle at high speed or over the speed limit.
7Report of alcohol consumption at least once a week for a certain period, regardless of the moment, past or present, or duration.
8Frequent sensation of distraction when driving.
9Frequent sensation of urgency when driving (need to reach a destination rapidly).
10Frequent use of the mobile phone when driving.
11Lack of use of seat belts and other safety restraints.
12Perceived condition of road infrastructure (PCRI).
4. Discussion
4.1 Key results
The main focus of this study was to investigate self-reported RTC among drivers from Loja Ecuador and to illustrate the applicability of MCA in detecting and representing typologies of individuals who have experienced an RTC as well as the typology of RTC events, upon information collected through a web-based survey carried in 2021.
First of all, the estimated lifetime prevalence of self-reported RTC ranged between 37% and 46%. Second of all, MCA allowed us to extract meaningful RTC-related typologies or profiles, for both the drivers and the events.
Based on MCA results, we identified a typology of drivers who reported participation or involvement in an RTC, characterized by a predominance of people between 25 and 40 years of age, who drive mainly automobiles (cars) and experience frequent sensations of distraction and frequently use a mobile phone when driving. Additionally, MCA indicated two distinctive typologies of RTC events. One is characterized by collision vehicle to vehicle, behavioral factors as a main group of causes, and RTC occurring on low-speed limit roads during the afternoon. The second one is characterized by collision with fixed objects or animals as the type of RTC, average-speed limit roads as the location of occurrence, and evening/late evening as the moment of occurrence.
In general, MCA findings indicate that age and certain driving habits such as speeding, alcohol consumption, the frequent sensation of distraction, and use of mobile phones when driving, are associated with an increased occurrence of self-reported RTC.
4.2 Methodological issues and study limitations
Most of the available studies in the field of road safety investigate RTA and risk factors, defining traffic accidents as an accident, involving at least one vehicle on a road open to public traffic in which at least one person is injured or killed [6]. Therefore accidents that do not cause injuries to people or cause only minor injuries are underrepresented [42]. In our study, we investigated as outcome variable RTC which may allow us to capture more cases and events among the study population since this indicator includes any accident regardless of the presence of an injured person.
A critical limitation of our study is the fact we assessed the lifetime prevalence of RTC, a cumulative indicator of event frequency that does not consider the number of events suffered by an individual over time [1,36]. We decided not to add more complexity to the questionnaire by characterizing each event (RTC) suffered by the respondents. We focused on the most recent event. Therefore, our results represent the current characterization of individuals and events.
Subjects were enrolled by a non-probabilistic sampling technique, known as online (virtual) snowball sampling [43,44], a sampling method frequently applied for online surveys through social networks (Facebook, WhatsApp, Instagram, LinkedIn), which required people had access to the internet and smart devices. Such sampling may have produced a non-representative sample, and therefore, it may hamper the generalization of results. However, there is abundant evidence [43,44] that shows that this type of sampling strategy allows reaching approximately representative samples of the target population, comparable with traditional survey methods, achieving high rates of positive responses, large sample sizes, and diversity of participants. This type of strategy has proven to be very useful, especially within the context of the COVID-19 pandemic [45-47].
Recent studies [43,44,48-50] have indicated that Facebook or other popular social networks are valuable sources of information for the establishment of efficient sampling frames that facilitate the expansion of the sample size in studies that use ascending methodologies, and also there is evidence that the use of a random selection of virtual groups (a typical algorithm of social networks) reduces the selection bias observed in convenience sampling and increases the representativeness of exploratory studies that use non-probability samples. Even more, other studies [48,49,51-54] have shown that combining Facebook recruitment with an online survey reduces time, and monetary costs, and minimizes response bias. [48,49,51-54].
A relevant aspect to discuss within the framework of MCA is the stability of the model [38]. We carried out an MCA stability assessment by reviewing the influence of each row or column (considering the underlying contingency Table) and analyzing their contribution to the principal axes. Then, we performed several MCA eliminating certain points or groups of points, to see the effect of their elimination on the configuration and graphic representation of the ACM [38]. Considering only the criterion of observed changes in the inertia values, eigenvalues, and Cronbach's alpha, as well as in the configuration of the discrimination measures plot and the joint plot of category points, the results suggest adequate stability of the ACM with a two-dimensional solution for both the study of the typology of the individuals who suffered RTC (MCA1) and the study of RTC event typology (MCA2).
Table 4 Characterization of self-reported RTC among drivers from Loja, Ecuador (n = 313).1
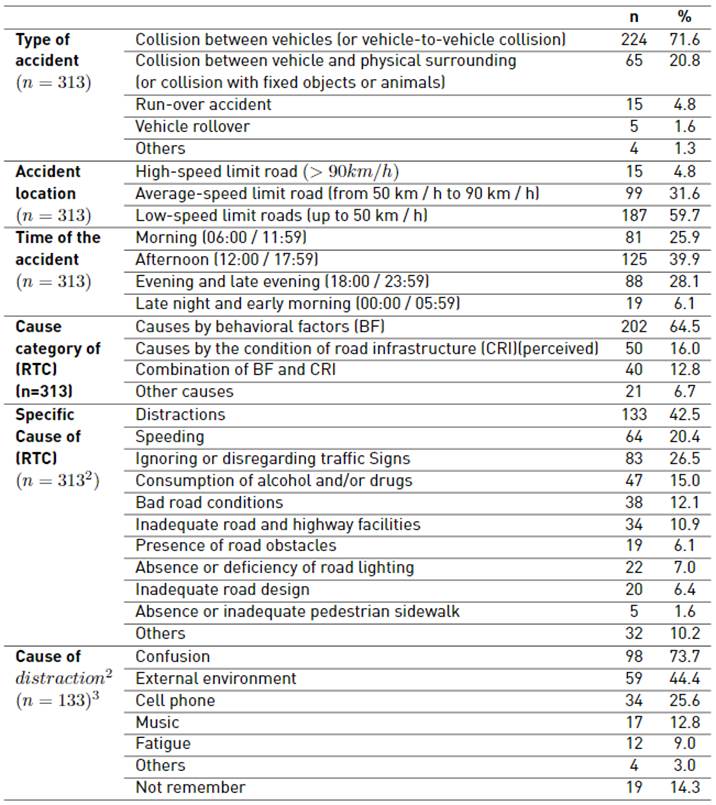
1 Only information from drivers who reported having been involved in a road traffic crash (RTC) (n=313) was requested. When a respondent suffered more than one RTC, he/her was asked to provide information only regarding the most recent accident or event.
2 Respondents could indicate more than one causal factor for the event if they considered it appropriate (multi-response question).
3Percentages are based on the total number of respondents indicating distraction as a cause of the RTC.
4.3 Interpretations of findings and comparison with other studies
The estimated lifetime prevalence of RTC among surveyed drivers from the city of Loja was within the range reported by studies published in other countries in Latin America. For example, a study carried out in the municipality of Rio Branco, located in northern Brazil [25], estimated a rate of 36% from a sample of 1,516 people 18 years old and older, surveyed through a multistage random sampling of clusters between 2007 and 2008.
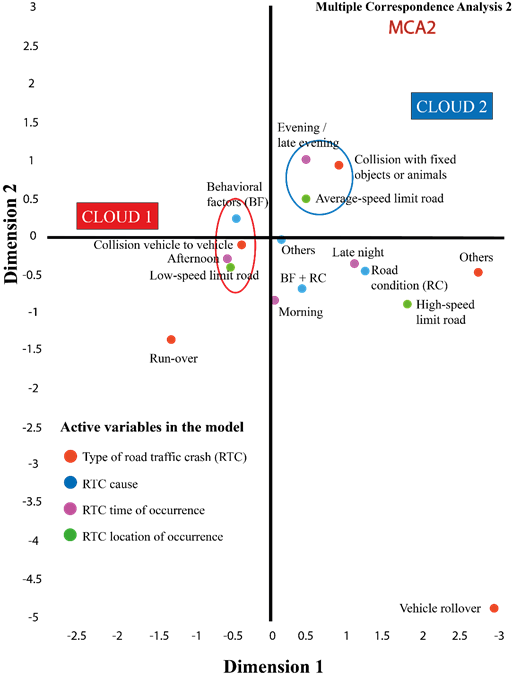
Figure 4 MCA2 joint plot of category points. MCA2 aimed at identifying the typology of events or RTC. Clouds represent groups of potentially associated categories.
Loja and Rio Braco share certain similarities; both are the major cities within their respective provinces, and have similar average numbers of circulating vehicles, population density, and road infrastructure accessibility (road kilometers per person). Our results were also consistent with findings from a national-level study performed in Mexico [55] in which a 47% prevalence of RTC was estimated.
Even though the estimated lifetime prevalence of RTC in Loja could be considered high, higher rates have been reported from regions with more pronounced urbanization processes. A study conducted in one of the main cities in Saudi Arabia [56] estimated a significantly higher prevalence of RTC (63%). Similarly, another study reported a prevalence of 64% in the city of Adidome in Ghana [57]. Authors from both of the aforementioned studies stated in their articles that these cities have been characterized by accelerated growth of road infrastructure and vehicle fleet during the last decade.
An essential result of our study is that MCA allowed us to identify 4 typologies based on cloud categories plotting, previously described in the result section. The first cloud would represent the typology of those who ever experiences an RTC. In the second cloud, categories are less associated with RTC but are represented farther away from the category of “no RTC” and still closer to the category of “RTC (yes)”, therefore, this cloud might be considered a group of interest since an individual with such characteristic may be in a higher risk of experience an RTC ever. The third cloud would represent the typology of those individuals who have never experienced an RTC. And finally, the fourth cloud is relatively closer to the third cloud and is located in the opposite region compared to the third cloud. This cloud could represent a low-risk group. Few studies have been carried out in the Latin American region aimed to explore the value of MCA for the identification of RTC profiles, and there is great variability among the available studies regarding the specific factors evaluated.
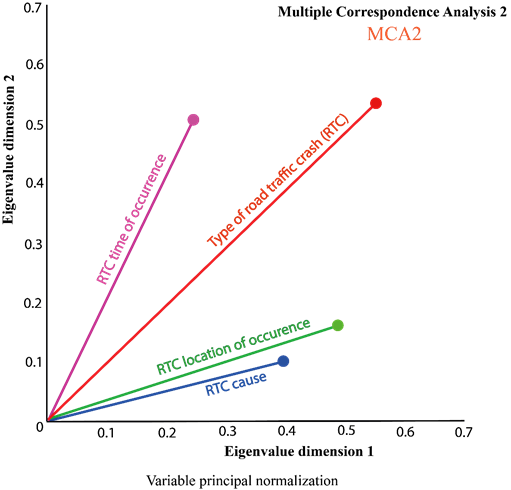
Figure 5 MCA2 discrimination measures plot. MCA2 aimed at identifying the typology of events or road traffic crashes (RTC).
Table 5 Model summary and discrimination measures of the MCA2.1
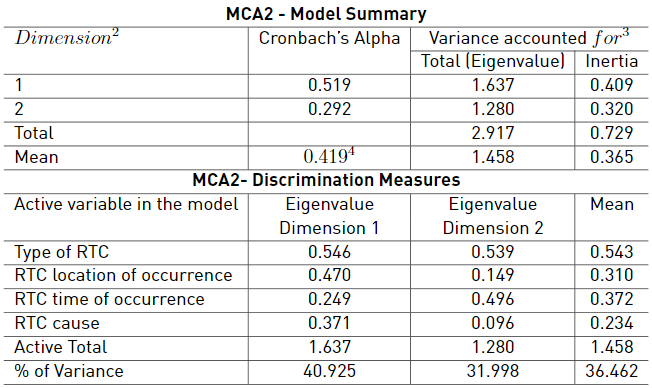
1The multiple correspondence analysis 2 (MCA2) aimed to identify the typology of events or road traffic crashes (RTC). Here, MCA2 was based on information provided only by respondents who have suffered a RTC at least once, at any time in life was included in the model (n=313).
2This model represents a 2-dimensions solution for the MCA.
3The eigenvalue and inertia describe the amount of variation the dimension explains, therefore allowing us to evaluate which dimension accounts for most of the variability in the data. Dimension 1 explained 40.9% of the variance and dimension 2 explained 32% of the variance.
4Mean Cronbach's Alpha is based on the mean Eigenvalue.
This situation makes it difficult to compare our results with other studies. Despite this limitation, there is evidence of the usefulness of MCA for the identification of RTC profiles. In one of the very few studies implemented in Latin America and available in the peer-reviewed literature, the researchers explored the relationships between the parameters associated with participation in traffic accidents, in a sample of 205 Brazilian truck drivers who worked shifts [58].
The researchers identified two different profiles of truck drivers. The first profile consisted of drivers who reported being involved in accidents, being users of alcohol and other drugs, driving more than 14 hours without rest with excessive drowsiness, and having fallen asleep while driving. In contrast, the second profile showed that the subjects who were not involved in accidents did not report excessive sleepiness, did not fall asleep while driving, and did not use drugs. The authors also observed that the variables that contributed the most to these two profiles were nighttime displacement, followed by falling asleep while driving, and sleep complaints [58].
Results from a secondary analysis of our data set using multivariate binary logistic regression suggested that age between 25 and 60, alcohol consumption, the frequent sensation of distraction, and frequent use of mobile phones, are associated with a significant increase in self-report road traffic crashes (RTC) among drivers from the city of Loja, which is in line with the findings derived from the MCA. These results are also consistent with the data reported by the World Health Organization in its world report on road safety 2018, which reflects that age, alcohol/drug use, speeding, and distractions while driving are major and independent risk factors of RTC [1].
Table 6 Factors associated with self-reported road traffic crashes (RTC) among drivers from Loja, Ecuador (n= 754).
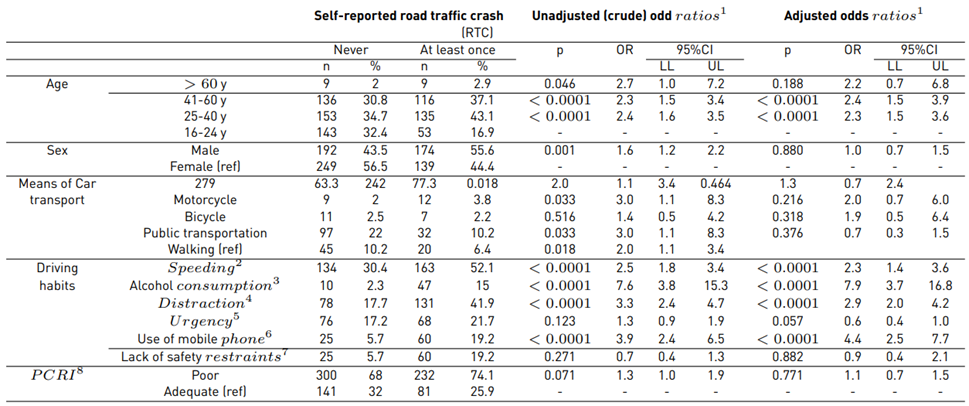
CI: confidence interval; OR: odd ratio; LL: lower limit; UL: upper limit; p: significance value (a result was considered significant if p<0.05).
1Unadjusted and adjusted OR were calculated by bivariate and multivariate binary logistic regression.
2Habit of driving a vehicle at high speed or over the speed limit.
3Report of alcohol consumption at least once a week for a certain period, regardless of the moment, past or present, or duration.
4Frequent sensation of distraction when driving.
5Frequent sensation of urgency when driving (need to reach a destination rapidly).
6Frequent use of the mobile phone when driving.
7Lack of use of seat belts and other safety restraints.
8Perceived condition of road infrastructure (PCRI).
Regarding the analysis of RTC event typology, our study highlights the presence of two well-differentiated types of events. One corresponds to accidents characterized by collision vehicle-vehicle caused by behavioral factors that occur at low-speed limit roads, especially during the afternoon. The second type is represented by collision with fixed objects or animals, which occurs at average-speed limit roads during the evening/late evening. In general, it is difficult to establish a direct comparison with other studies due to the scarcity of studies focused on the identification of RTC event typology derived from multivariate reduction techniques, and due to the variability of assessed variables. Despite this situation, some relevant comparisons can be made.
When comparing the characteristics of RTC events reported in our study with those observed in other studies carried out in Ecuador and other countries in Latin America, it is possible to notice similarities regarding the cause and type of accident, but not regarding the place and time of occurrence. The majority of surveyed drivers from the city of Loja agreed that distraction represented the most frequent type of cause, followed by ignoring traffic signs and speeding. These findings are similar to those reported in a recent study published in 2020 [59], in which the main causes of fatal accidents nationwide in Ecuador are driving inattentive to traffic conditions and driving over speed limits. In our study, the most frequent types of RTC were vehicle-to-vehicle collision, collision with fixed objects or animals, and run-over accident. A study conducted in Brazil [60] remarked that collision vehicle-to-vehicles represented the most frequent typology in an urban area of Brazil, even though the frequency of run-over was significantly lower compared to our study.
Our study indicates that accidents occurred in order of frequency from highest to lowest, first on low-speed roads, where the speed limit is 50km / h, second on average-speed roads, which allow circulation from 50km / h to 90km / h, and finally and less frequently on high-speed highways. These findings contrast with results published in the United States of America [61] suggesting the probability of accidents increases in high-speed areas such as interstate and rural highways and less frequently in urban areas. It is relevant to note that Loja is a city that does not have a large number of average and high-speed roads, due to the geography of the region and this fact could partly explain the low frequency of accidents reported on this type of road in Loja. However, the multiple correspondence analysis for the construction of RTC typology suggests that in Loja accidents are associated with driving above the speed limit on roads where the speed limit is low. In other words, the typology is conditioned by behavioral-related factors. One aspect to highlight is that in Loja most of the accidents occurred in the afternoon, while another study carried out in Ecuador [62] showed that at the national level, accidents occur mainly at night. Differences between both studies may be explained by the fact that in our study, most of the accidents we investigated were likely non-fatal, while the other study [62] analyzed both fatal and non-fatal road traffic crashes that are reported in official registries, where mainly severe accidents are accounted for (road traffic accidents that caused fatalities or major injuries).
In general, we can observe that available studies on traffic accidents that explore the typology of accidents show a high degree of variability in terms of the results. This variability could be explained by differences between the studies concerning the source population, sampling methods, the criteria, and definitions of the events and related factors, as well as differences regarding the implemented methodological approaches, data collection tools and instruments, and statistical analysis strategies. This situation emphasizes the need to standardize definitions and criteria to assess and measure RTC, to increase the comparability of the results between the different studies.
4.4 Future research
The results of this research emphasize the need to consider the study of road traffic accidents as a priority research problem, due to the complexity of the elements that determine accidents occurrence and their detrimental impact on individuals, families, and society in general. Future research must focus on the following areas: 1) identification of risk factors according to accident typology; 2) evaluation of RTC severity and associated mortality; and 3) comparison analysis of feasibility and effectiveness of different statistical tools and techniques as well as study design alternative, to study the occurrence, patterns and determinants of RTC in low-resource settings. Some of the statistical techniques that could be evaluated in future research are clustering techniques [13], component analysis [63], neural network [64], machine learning [65], and some more conventional approaches such as generalized linear models [66]. Future studies must also assess technical, logistical, and cost-benefit issues to provide relevant information to the scientific community and regulatory authorities and support their decision-making processes to select a suitable as well as a scientifically valid research approach.
5. Conclusions
The lifetime prevalence of self-reported RTC among drivers from Loja, Ecuador is high. Approximately 4 out of 10 drivers reported participation in an RTC at least once in life. It was evident that the multiple correspondence analysis, as an exploratory tool, contributed to the visualization of potential factors associated with the occurrence of RTC and to the identification of individual profiles, discriminating the attributes associated with those individuals who have suffered RTC from the attributes associated with individuals who have not suffered RTC. Overall, the principal determinants of RTC identified in this study are modifiable, mainly related to behavioral factors. Although, what is important here, is not the identification of specific RTC-related determinants, since there is a great deal of evidence in that regard, but the value of MCA in identifying such factors, and its strength as a preliminary exploratory tool. The present study remarks on the importance and validity of MCA as a relevant addition to the list of techniques that can be used for road traffic accident research in low-income countries with limited resources, such as Ecuador.

