


 Inglês (pdf)
 Artigo em XML
 Referências do artigo
 Enviar este artigo por email
 Citado por SciELO
  Citado por Google
  Similares em
SciELO
Similares em
SciELO  Similares em Google
 Permalink
Introduction
Coffee cultivation is of significant importance to the world economy, with Brazil as the largest producer and exporter of coffee (Coffea spp.), corresponding to 37% of world production, and as the second largest producer of the species Coffea canephora (USDA, 2019; Belan et al., 2020). In addition, Brazil is also one of the largest producers of black pepper (Piper nigrum) (Carneiro et al., 2017).
The State of Espírito Santo is currently the second largest coffee producer and the first producer of Conilon coffee, the second producer of papaya, and the largest exporter and second producer of black pepper (Dadalto et al., 2016).
The municipality of Nova Venécia is located in the northwest region of the state of Espírito Santo; agriculture is one of the main activities of the region. According to the 2018 Agricultural Census, the municipality was the 9th largest producer of Conilon coffee (27,920 t) and the 5th largest producer of black pepper (4,200 t) nationally. One of the main factors contributing to this productive position is the use of irrigation, which according to this census covers approximately 15,000 productive hectares and is present in about 2,500 agricultural establishments (IBGE, 2018).
In irrigated agriculture, the quantification of the water consumption of the crops during development stages allows for the planning, dimensioning, and rational management of the irrigation. One of the techniques that helps to quantify the volume of water needed for irrigation is the determination of crop evapotranspiration (ETc), which reflects the measurement of the total amount of water lost to the atmosphere, resulting from the processes of soil evaporation and plant transpiration.
To determine ETc, it is necessary to estimate the Reference Evapotranspiration (ETo), which represents a standardized measure of the evapotranspiration rate of a location, considering the local climate variables. Then, ETo is corrected by the Crop Coefficient (Kc), which is a ratio between ETc and ETo. The value of Kc varies depending on the crop and its stage of growth.
The United Nations Food and Agriculture Organization (FAO) has defined the Penman-Monteith equation as the standard model, recommending it to estimate and calibrate different ETo methods (Allen et al., 1998). Studies have shown the efficiency and representativeness of this model to the factors that govern the process of evapotranspiration; however, its great disadvantage is related to the high number of meteorological variables required for its use, since most of the stations do not have enough sensors to collect all the variables, or the quality of the data collected is poor (Palaretti et al., 2014; Carvalho et al., 2015; Tanaka et al., 2016).
Faced with this problem, the use of simpler methods using few meteorological variables to estimate the ETo has become a viable solution (Fernandes et al., 2012; Sales et al., 2018). In this context, Santana et al. (2018) recommend that, before choosing the method to be used, an assessment of the climate adaptability to the region be made comparing its performance to the standard Penman-Monteith FAO model 56. This study is necessary because the methods were generally developed under climatic and crop management conditions different from that in which the model will be employed, making it necessary to calibrate the equations for the region in order to minimize the estimation errors (Pereira et al., 2009; Rigone et al., 2013).
Thus, the aim of this study was to calibrate and validate alternative methods for producers in the region that use only simple variables, comparing their performance with that of the standard method recommended by the FAO-56 Penman-Monteith, for the municipality of Nova Venécia, Espírito Santo State, Brazil.
Materials and methods
In this study, hourly data from the automatic meteorological station of the National Institute of Meteorology (INMET), located in the municipality of Nova Venécia, State of Espírito Santo, Brazil, were used. The station is located at latitude 18°41'43" S, longitude 40°24'27" W and has an altitude of 154 m a.s.l. Nova Venécia is located in the northern region of Espírito Santo (Fig. 1), bounded by latitudes 18°17'58" S and 18°56'48" S, and by longitudes 40°45'30" W and 40°17'46" W, covering a total area of 1,439,571 km2.
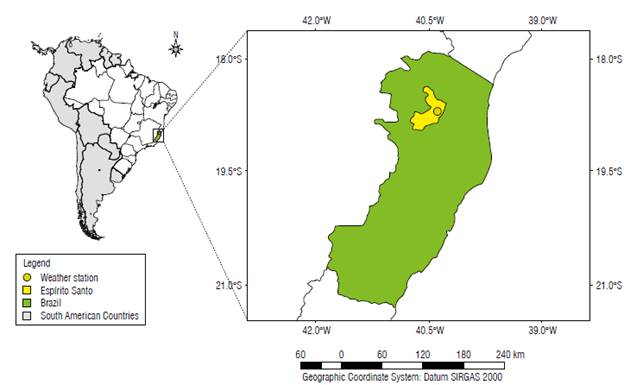
FIGURE 1 Geographical location of the municipality of Nova Venécia in the state of Espírito Santo, Brazil.
The northern region of the state is recognized as the main producer of Conilon coffee, standing out in this activity. In addition, this area also stands out for the production of papaya and black pepper.
The climate of Nova Venécia is classified by Köppen and Geiger (1936) and Peel et al. (2007) as tropical with dry season, with a temperature range from 11.8 to 18°C during the colder month and 30.7 to 37°C in the warmer month, reaching an annual average of 24°C. The rainy season is between the months of October to February, and the dry season between the months of March to September.
The data used in this study were collected from a meteorological station installed in the region in 2008, with a historical series of 11 years for producers in the region from 2008 to 2019. It is important to emphasize that, although the historical series is relatively short, local studies of this nature play a crucial role in facilitating the suitability of irrigation projects for the region. However, it is essential to use the results of this study with caution, considering the limitations of the historical series.
The meteorological variables used to estimate the ETo in mm d-1 were: maximum (Tx), minimum (Tn) and average (Tm) air temperature in °C; average dew point temperature (To) in °C; maximum relative humidity (URx), minimum (URn) and average (URm) humidity of the air at 2 m above ground level in %; global solar radiation (Rg) in MJ m-2 d-1; and wind speed at 2 m from ground level (U2) in m s-1, as shown in Table 1.
TABLE 1 Monthly averages of the climatic data collected by the meteorological station and used by alternative methods to estimate ET0 in Nova Venécia, Espírito Santo, Brazil, between 2008 and 2019.
| Month | Rg | Tx | Tn | Tm | To | URx | URn | URm | U2 |
|---|---|---|---|---|---|---|---|---|---|
| January | 21.3 | 32.9 | 21.3 | 27.1 | 17.0 | 94.1 | 43.9 | 69.0 | 2.1 |
| February | 21.8 | 33.6 | 21.5 | 27.6 | 16.9 | 94.1 | 40.4 | 67.2 | 1.9 |
| March | 18.8 | 33.2 | 21.6 | 27.4 | 17.2 | 93.7 | 43.3 | 68.5 | 1.9 |
| April | 16.4 | 31.4 | 20.4 | 25.9 | 17.1 | 93.7 | 47.3 | 70.5 | 1.8 |
| May | 13.7 | 29.7 | 18.5 | 24.1 | 16.3 | 93.1 | 47.6 | 70.3 | 1.8 |
| June | 11.9 | 28.4 | 17.6 | 23.0 | 15.8 | 93.6 | 48.3 | 70.9 | 1.8 |
| July | 14.8 | 27.8 | 16.7 | 22.2 | 15.1 | 94.0 | 46.4 | 70.2 | 1.9 |
| August | 15.8 | 28.2 | 16.8 | 22.5 | 14.9 | 93.3 | 44.4 | 68.9 | 2.1 |
| September | 17.4 | 30.0 | 18.2 | 24.1 | 15.2 | 92.1 | 41.0 | 66.6 | 2.4 |
| October | 17.4 | 30.6 | 19.7 | 25.2 | 16.0 | 91.75 | 44.4 | 68.0 | 2.5 |
| November | 18.1 | 30.5 | 20.5 | 25.5 | 17.1 | 93.1 | 50.4 | 71.8 | 2.3 |
| December | 20.1 | 31.8 | 21.2 | 26.5 | 17.5 | 93.7 | 48.7 | 71.2 | 2.1 |
Rg - global solar radiation; Tx - maximum air temperature; Tn - minimum air temperature; Tm - average air temperature; To - average dew point temperature; URx - maximum relative humidity; URn - minimum relative humidity; URm - average relative humidity; U2 - wind speed at 2 m above ground level.
Prior to the estimates, the quality of the data was analyzed in order to eliminate measurement errors, based on the criteria proposed by Sales et al. (2018): Tx above 50°C; Tn below 0°C; Tx below Tn for the same day; Rg equal to zero and Rg greater than the extraterrestrial solar radiation. After the analysis, 3865 d remained with consistent data, corresponding to 92% of the data collected by the weather station.
Daily values of ET0 were estimated for the dry and rainy periods, using the alternative methods of (HS) Hargreaves and Samani (1985) (Eq. 1); (BL) Garcia Benevides and López (1970) (Eq. 2); (Li) Linacre (1977) (Eq. 3); (Ho) Hamon (1961) (Eq. 4); (Ca) Camargo (1978) (Eq. 5) and (FAO-56 PM) standard method 56 from FAO Penman-Monteith (Allen et al., 1998) (Eq. 6).
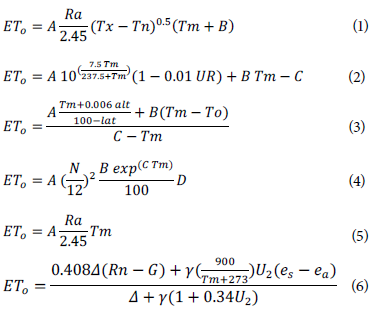
where
A, B, C and D - adjusted coefficients;
Ra - solar radiation in absence of atmosphere (MJ m-2 d-1);
alt - altitude (m);
lat - latitude (degrees);
N- photoperiod (h);
Δ- tangent to the saturation pressure curve of water vapor (kPa ºC-1);
γ - psychrometric constant (0.0662 kPa ºC-1);
Rn - radiation balance (MJ m-2 d-1);
G - soil heat flux density (MJ m-2 d-1);
es - saturation pressure the surface temperature (kPa °C-1);
ea - vapor pressure of the air (kPa °C-1).
The data from the period from July 2008 to December 2015 were used to calibrate the parameter1 of the equations; the equations from January 20J6 to December 2019 were used to validate those parameters.
The parameter calibration was performed by minimizing the square sum of the error obtained by comparing the ETo estimated by the alternative methods and by the FAO-56 PM standard method, using the Solve activation within the Excel software and the open-source program R Core Team (2020). The performance of the alternative ETo methods was evaluated by the correlation coefficient (Eq. 7), the root of normalized mean square error (Loague & Green, 1991) (Eq. 8), Willmott's index of agreement (Willmott et al., 1985) (Eq. 9) and confidence coefficient (Camargo & Sentelhas, 1997) (Eq. 10).
where:
Ei -vaiue obtained by1 means of the alternative methods (mm d-1);
Oi-value estimated through the Penman-Monteith standard method (mm d-1);
E-mean of the estimated by means of the alternative methods (mm d-1);
O-mean of the estimated by means of the Penman-Monteith standard method (mm d-1);
n -number of values;
r -Pearson correlation index;
d -Willmott's index of agreement;
c -confidence coefficients.
The performance of alternative methods was classified based on the variation of the confidence index (c) as: "excellent" (c>0.85); "very good" (c between 0.76 and 0.85); "good" (c between 0.66 and 0.75); "intermediate" (c between 0.61 and 0.65); "tolerable" (c between 0.51 and 0.60); "poor" (c between 0.41 and 0.50) and "very poor" (c<0.40).
Results and discussion
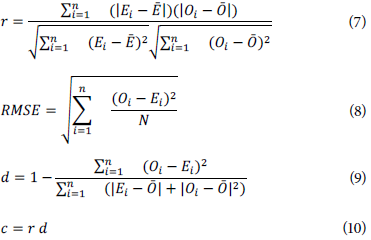
During the period studied, the average annual rainfall was 862.73 mm, with a period of highest concentration between October and March, and a period of drought between April and September (Fig. 2). These results corroborate those reported by Alves et al. (2005) who observed a period of higher rainfall in the Southeast region of Brazil, occurring normally between October and March, with approximately 80% of the annual total. At the state level, Uliana et al. (2013) identified two distinct periods for Espírito Santo: the first between October and April, which concentrates a large part of the precipitation, and the second between May and September, with a marked decrease in rainfall.
Table 2 shows the descriptive statistics of the weather data collected in the town of Nova Venécia and used in the ET0 calculation. It shows that the dry and rainy periods are well defined with regular temperature and air humidity and with low variation, while data on wind speed and global solar radiation show high variation, similar to what was observed by Gurski et ai. (2016) in Curitiba, Paraná, Brazil.
FIGURE 2 Monthly average rainfall In the municipality of Nova Venécia, Espírito Santo, Brazil, between 2008 and 2019.
TABLE 2 Average, standard deviation (SD) and coefficient of variation (CV%) of the meteorological data of the dry and rainy period used in the estimation of ET0 in the municipality of Nova Venécia, Espírito Santo, Brazil, between 2008 and 2019.
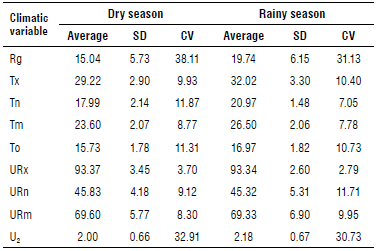
Rg - global solar radiation; Tx - maximum air temperature; Tn - minimum air temperature; Tm - average air temperature; To - average dew point temperature; URx - maximum relative humidity; URn - minimum relative humidity; URm - average relative humidity; U2 - wind speed at 2 m above ground level.
Oliveira et al. (2017), studying the influence of meteorological elements on the reference évapotranspiration estimated by FAO-56 PM, observed that variations greater than 10% cause different behavior in the method estimates due to the high sensitivity of the equation, which was also observed by Lemos et al. (2010).
Table 3 shows the values of the original and calibrated coefficients during the dry period and rainy season in the study region. For accuracy purposes, the calibrated coefficients of the alternative methods were presented rounded to 4 decimal places.
TABLE 3 Values of the coefficients of the original and calibrated alternative methods for the municipality of Nova Venécia, Espírito Santo, Brazil, for the period from 2008 to 2015.
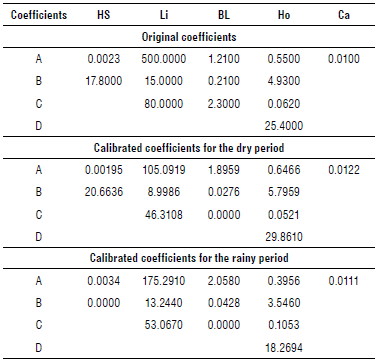
Alternative methods to estimate évapotranspiration: HS - Hargreaves and Samani; Li - Linacre; BL - Benevides and Lopes; Ho - Hamon; Ca - Camargo.
Table 4 presents the average ET0 estimates, the root of normalized mean square error (RMSE), the Willmott's index of agreement (d), the Pearson correlation index (r), the confidence coefficients (c) and performance, obtained from the correlations between ET0 values by the FAO-56 PM method and those obtained by alternative methods during the dry and rainy periods. It shows that the average ET0 of the region is higher during the rainy season, with an average of 4.74 mm d'\ while in the dry period the average is 3.39 mm d4. This is because global solar radiation and air temperature are the variables with the greatest influence on ET0 calculations (Ismael et al, 2015) since the rainy period in Nova Venécia covers the spring and summer seasons and is characterized by high temperatures and high energy flow from solar radiation, while the dry period spans fall and winter seasons, which present milder conditions.
TABLE 4 Evaluation and performance of alternative ET0 estimation methods (mm d1), relative to standard method, FAO-56 PM before (original) and after the calibration (calibrated) of the parameters for the Municipality of Nova Venécia, Espírito Santo, Brazil, for the period from 2008 to 2015.
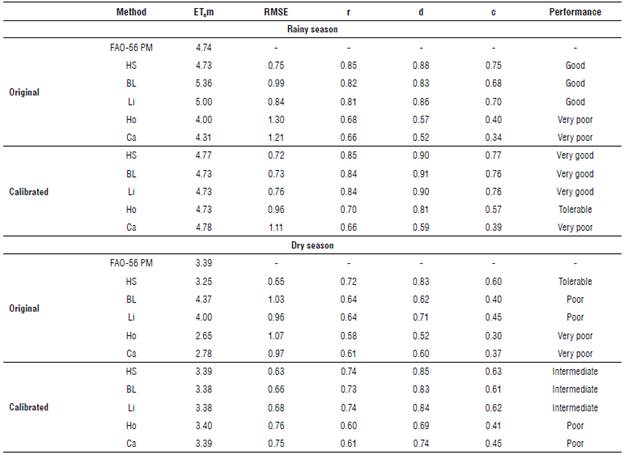
Methods to estimate evapotranspiration: FAO-56 PM - Standard method 56 from FAO Penman-Monteith HS - Hargreaves and Samani; Li - Linacre; BL - Benevides and Lopes; Ho - Hamon; Ca - Camargo; ETom - average ETo estimates; RMSE - root of normalized mean square error; r - Pearson correlation index; d - Willmott's index of agreement; c - confidence coefficients.
The calibrated equations presented better statistical parameters than the original equations (Tab. 4). In descending order, the best methods for estimating ET0 were: HS, BL, Li, Ho, and Ca.
The HS, BL and Li methods showed similar performance after calibration. In the rainy season (Tab. 4), the RMSE decreased by 0.03, 0.26, and 0.08 mm d-1 and the "c" index increased by 2.66, 11.76, and 8.57% in the respective methods, reclassifying them as "very good".
In the dry period (Tab. 4), the RMSE decreased by 0.02, 0.37, and 0.28 mm d-1 and the "c" index increased by 1.61, 52.50, and 37.77%, respectively, reclassifying them as "intermediate". While these methods performed best among those studied, the average error remained elevated, between 0.72<RMSE<0.76 mm d-1 during the rainy season and 0.63<RMSE<0.68 mm d"1 during the dry period. Sales et al. (2018), when calibrating these methods for the city of São Mateus, Espírito Santo State, found RMSE values equal to 24.6, 21.6, and 23.7%, respectively, but with a "d" index greater than 0.80, which indicates discrepant errors in some data pairs and loss of efficiency at some time of the year.
Therefore, the subdivision of the estimated period was recommended. By subdividing the data analysis period into dry and rainy seasons, it was possible to reduce the error; however a larger subdivision is preferred.
For the less precise methods Ho and Ca during the rainy season, RMSE decreased by 0.34 and 0.09 mm d-1 and the "c" index increased by 42.50 and 14.70%, reclassifying them as "tolerable" and "very poor", respectively, whereas in the dry period, RMSE decreased by 0.31 and 0.22 mm d-1 and the "c" index increased by 36.66 and 21.62%, reclassifying them as "poor". The high estimation error between 0.96<RMSE<1.11 mm d-1 during the rainy season and 0.75<RMSE<0.76 mm d-1 during the dry season demonstrates the inefficiency of the methods even after calibration.
According to Souza et al. (2019), as these methods only use the average air temperature as a variable in their equations, they have a certain dependency resulting in unsatisfactory performance, as observed in studies carried out in different regions of Brazil (Fanaya et al., 2012; Bezerra et al, 2014; Silva et al, 2017).
Figure 3 shows the average monthly évapotranspiration estimated by alternative methods in their original (Fig. ЗА) and calibrated (Fig. 3B) equations, compared to the FAO-56 PM. It shows graphically the effect of the RMSE decrease in the behavior of alternative methods over the periods of the year. It evidences the closeness of the calibrated equations to the FAO-56 PM, emphasizing an improvement in performance in the dry and rainy periods.
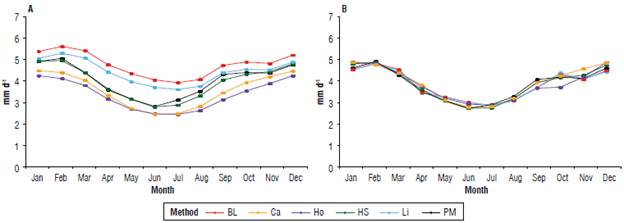
FIGURE 3 Average monthly évapotranspiration estimated by the FAO-56 PM method and by alternative methods with the original (A) and calibrated (B) equations in Nova Venécia, Espírito Santo, Brazil, between 2008 and 2015.
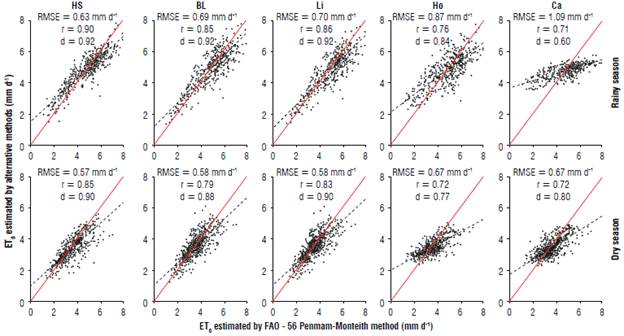
FIGURE 4 Correlations between daily ET0, estimated by the FAO-56 PM and alternative models (HS, Li, BL, Ho, Ca) for the dry and rainy period of the 2016 to 2019 data series (independent data not used for calibration) in Nova Venécia, Espírito Santo, Brazil. Methods to estimate évapotranspiration: FAO-56 PM - Standard method 56 from FAO Penman-Monteith HS - Hargreaves and Samani; Li - Linacre; BL - Benevides and Lopes; Ho - Hamon; Ca - Camargo. RMSE - root of normalized mean square error. Methods to estimate évapotranspiration: FAO-56 PM - Standard method 56 from FAO Penman-Monteith HS - Hargreaves and Samani; Li - Linacre; BL - Benevides and Lopes; Ho - Hamon; Ca - Camargo.
In addition, all methods presented index (d), (r), and RMSE values close to the series used to calibrate them, with an average variation of 2.19%, 5.12%, and 8.16%, respectively, in the rainy season and 7.27%, 13.57%, and 13.39%, respectively, in the dry season. This confirms the efficiency of the adjustments, making them reliable to use.
The regression analysis of the estimates performed by the HS, BL and Li methods showed dispersion closer to the 1:1 line than those performed by the Ho and Ca methods. This greater homogeneity of data can be verified graphically, by the decreased RMSE values and by the higher r and d indices, revealing the greater accuracy of ETo estimation in Nova Venécia in both periods of the year.
Conclusions
The HS, BL and Li methods presented the best performances for the region in both the dry and rainy season; the HS method is most interesting because it only requires the use of equipment that measures the air temperature and can be used to replace the standard FAO-56 PM model for estimating irrigation needs in the region.
Alternative methods for estimating ETo, calibrated for the municipality of Nova Venécia in Espirito Santo, Brazil, have a strong potential for use in irrigation projects, since they help in determining the volume of water needed to supply the crop through the use of simple and inexpensive equipment. This, in turn, can help reduce water consumption in agriculture, promote the efficient use of natural resources, as well as enhance the economic exploitation of crops.

