


 Inglês (pdf)
 Artigo em XML
 Referências do artigo
 Enviar este artigo por email
 Citado por SciELO
  Citado por Google
  Similares em
SciELO
Similares em
SciELO  Similares em Google
 Permalink
1. Introduction
The online food delivery sector has been growing at high rates worldwide in the last years. Its revenues have risen from US$76,193 million in 2017 to US$122,739 million in 2020 (17.2% average annual growth), with an expectation to reach US$164,002 million for 2025 (Statista, 2020). Moreover, during the COVID-19 lockdown, more online delivery providers have emerged and more restaurants have turned to the delivery format (Dishman, 2020). Even restaurants offering their products only through delivery have emerged; a practice that provides the opportunity to new entrants with low fixed costs. Therefore, nowadays this activity has gained relevance not only for established but also for new businesses.
Since March 17, 2020, the Ecuadorian government decreed mobility restrictions within the country, closed borders to all foreign travellers due to the spread of the coronavirus, and suspended face-to-face work in the government and private sectors; however, prioritized sectors (e.g., utilities, security, health) and delivery services were allowed to operate with specific guidelines (Comité de Operaciones de Emergencia Nacional - COE, 2020). By July 27, 2020, Ecuador was one of the most affected countries by COVID-19 in the world (#17), and the fourth most affected in South America with 313 deaths and 4,596 cases per million people (5,532 total deaths and 81,161 total cases reported) (Worldometer, 2020). However, non-official estimations suggested that the number of deaths was significantly higher than the figures reported by the government (León & Kurmanaev, 2020).
Due to the lockdown, the entertainment, hospitality and restaurant sectors are the most affected in Ecuador. Most restaurant and cafe owners projected a fall in sales of 30% or more during 2020 (Castillo & Zhangallymbay, 2020). During this crisis, delivery providers emerged as an alternative to mitigate the drop in sales. Thus, 46% of restaurants and cafes had a delivery service before the lockdown, but 92% expected to offer the service during the confinement (Castillo & Zhangallymbay, 2020). A similar scenario was evident worldwide during the COVID-19 lockdown, as reported above.
Preserving customer satisfaction is crucial for service firms to influence trust and loyalty in crisis times (Monferrer-Tirado, Estrada-Guillén, Fandos-Roig, Moliner- Tena & García, 2016). In the digital world, it has been demonstrated that e-satisfaction is positively associated with consumer spending (Nisara & Prabhakar, 2017). Thus, firms must be aware of what drives customer satisfaction within their specific industries, particularly when they are facing economic difficulties. Since COVID-19 crisis has brought several changes in doing business and customer perceptions, attitudes and behaviour (Deloitte, 2020), it becomes pertinent to study eventual changes in attitudes, customer satisfaction and its antecedents. The literature on online services has evidenced that e-service quality and food quality impact e-satisfaction (Suhartanto, Helmi, Tan, Sjahroeddin & Kusdibyo, 2019). We suggest that the customer interaction with the delivery worker is another source of satisfaction or dissatisfaction with online food delivery providers (ODP), according to a vast literature in the service industry (e.g., Alhelalat, Habiballah & Twaissi, 2017; Jang & Namkung, 2009; Macias, Rodriguez & Barriga, 2020; Wall & Berry, 2007). The most obvious way of estimating changes in the proposed variables is comparing its levels and relationships before versus during the COVID-19 lockdown. According to the literature review carried out here, to date there is no academic publication addressing the study of determinants of satisfaction with ODPs during the lockdown in Ecuador. A couple of studies are limited to reporting the emergence of a greater number of businesses of this type during the pandemic (Játiva & Cabezas, 2020) and the fact that biosafety measures are being taken for food delivery (Bernal-Álava, Solórzano- Solórzano, Burgos-Salazar & Cantos-Figueroa, 2020).
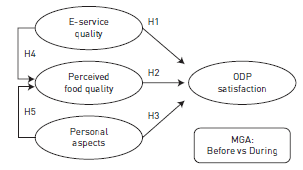
Given the growing importance of the food delivery sector within service industries worldwide, this study has two purposes: (i) to qualitatively explore the main attitudes towards online food delivery providers in Ecuador in times of COVID-19, and (ii) to quantitatively investigate whether there is a change in customer satisfaction with this service and three antecedents: e-service quality, personal aspects of the delivery workers, and perceived food quality.
The following section presents the theoretical foundations of the proposed model, the third and fourth sections describe the methodology and results of the qualitative and quantitative phases of this research, respectively. Finally, discussion and conclusions are provided.
2. Theoretical background and conceptual model
Service literature has turned its attention into the e-world, mainly in the last two decades. The works of Zeithaml, Parasuraman and Malhotra (2002), and Parasuraman, Zeithaml and Malhotra (2005) define e-service quality and a summary of its main dimensions. E-service quality is understood as “the extent to which a website facilitates efficient and effective shopping, purchasing, and delivery of products and services” (Zeithaml et al., 2002, p. 363). This construct comprises (i) efficiency, as the ease and speed of accessing and using the website; (ii) fulfilment, as the extent to which the delivery promises and item availability of the site are accomplished; (iii) system availability, referring to the correct technical functioning of the website; and (iv) privacy, as the degree to which the site is safe and protects customer information (Parasuraman et al., 2005).
Nevertheless, studies about online food delivery providers are recent and scarce in marketing literature. Researchers have focused on the attitudes towards it (Cho, Bonn & Li, 2019; Yeo, Goh & Rezaei, 2017), intention to use (Alagoz & Hekimoglu, 2012; Okumus, Ali, Bilgihan & Ozturk, 2018; Yeo et al., 2017), adoption of ODPs (Okumus & Bilgihan, 2014), and final conversion (i.e., placing an online order) (Kapoor & Vij, 2018). All these studies analyse the pre-consumption stage. Instead, this work investigates customers who have already adopted the use of ODPs, have placed orders and have eaten the food, and analyses their satisfaction with the ODP. In this regard, Wang, Tseng, Wang, Shih and Chan (2019) studied satisfaction only with restaurant-owned apps, and the authors included mainly information systems (IS) variables as determinants. Alalwan (2020) included detailed functional aspects as precursors of ODP satisfaction. Suhartanto et al. (2019) proposed e-service quality and food quality as determinants of e-satisfaction. Macias et al. (2020) added personal aspects of delivery workers in the ODP context and explored spillover effects over restaurant brands. The present work differs from Macias et al. (2020) since this study analyses changes in the evaluation of e-satisfaction and its determinants, and changes in the structural relationship due to the COVID-19 lockdown, using a larger sample to capture the effect of the health emergency period. In addition, we provide a qualitative analysis of customer perceptions about the service of ODPs in times of COVID-19, which could bring new insights for further research on this topic.
Based on Oliver’s (1999) definition of satisfaction, we define ODP satisfaction as a subjective assessment of experience with an ODP regarding the degree of fulfilment of prior expectations. The customer service encounter in the ODP context includes interaction with the platform/ app (launching, searching, ordering, payment, waiting/ tracking), interaction with the delivery worker, and food consumption. Concerning the platform, the variable that best describes its performance is e-service quality. The platform’s adequate functioning in its several dimensions (efficiency, fulfilment, system availability, and privacy) should contribute to e-satisfaction; prior works in lodging websites (Jeon & Jeong, 2017) and ODPs (Macías et al., 2020; Suhartanto et al., 2019) showed this relationship. Therefore, we proposed the following hypothesis:
Furthermore, delivery workers may interact with the customer through text messaging or phone calls for delivery details, and during the personal delivery of products. Several studies have explained that the employees’ appearance and behaviour influenced brand image formation in the’ minds of customers (Pounders, Babin & Close, 2015; Warhurst & Nickson, 2007a, 2007b). In many industries, managers establish clothing, speech, and behaviour parameters to reflect brand image and values (Witz, Warhurst & Nickson, 2003). We define personal aspects of delivery workers (hereafter, personal aspects) as the combination of physical appearance, clothing, and manners when interacting with ODP customers. There is evidence that personal aspects influence how customers evaluate the service (Kim, 2014), restaurant experience (Wall & Berry, 2007), and satisfaction (Alhelalat et al., 2017; Macías et al., 2020). Hence, the second hypothesis is:
After platform and delivery worker interaction, customers eat food as a part of their experience from a process perspective. The degree of perceived food quality in the variety of menu, presentation, size, healthiness, taste, freshness, and food temperature, contribute to customer experience in restaurants (Han & Hyun, 2017; Liu & Jang, 2009; Namin, 2017; Namkung & Jang, 2007). Although the restaurant has prepared the food, the ODP controls the delivery time affecting its freshness; it has been shown that perceived food quality is positively associated to satisfaction with delivery service providers (Macías et al., 2020; Suhartanto et al., 2009). Based on these arguments and evidence, the following hypothesis has been drawn:
Finally, although restaurants prepare food orders, Spillover Theory (Sirgy, Efraty, Siegel & Lee, 2001) posits that some parts of a process influence the perception of another part of this process. Evidence of the referred theory is provided in several fields, for example, in the case of brand alliances, negative behaviour of one brand is likely to spill over to the other brand if consumers believe that the latter knew and overlooked the misbehaviour (Votolato & Unnava, 2006). Within coalition loyalty programs, one program partner service failure harms customer loyalty towards the whole program (Schumann, Wünderlich & Evanschitzky, 2014). In the ODP context, e-service quality influences the way customers perceive food quality (Macías et al., 2020; Suhartanto et al., 2019); it can also be said that the good or bad experience with the previous food consumption phase (i.e., delivery worker interaction) could influence the way customers assess food quality. Therefore, we proposed:
H4: e-service quality is positively related to perceived food quality.
H5: personal aspects are positively related to perceived food quality.
The relationships proposed above are depicted in figure 1.
3. Qualitative study
3.1 Methodology
An open-ended question was distributed to a sample of 104 users of ODPs in Ecuador. The objective was to know the opinion of users about the food delivery service during the lockdown: What is your opinion about having the food delivery service available during COVID-19 mobility restrictions in the country?
Qualitative data analysis involves making sense of the text. To analyse the responses text, researchers followed a three-stage coding process; open coding identified basic categories and axial coding related categories to subcategories, finally, key themes were identified.
3.2 Results
After qualitatively analysing the text of 104 responses (164 codes), key themes were identified and summarized below (Table 1).
Table 1 Summary of qualitative analysis
| Attitudes | % | |||
|---|---|---|---|---|
| Valence | Emotionality | Extremity | Examples of codes | |
| Positive | Emotional | Low to medium | Okay, good, positive, very good | 23.2% |
| High | Excellent, wonderful | 18.9% | ||
| Cognitive | Low to medium | Useful, helpful | 11.0% | |
| Negative | High | Necessary, indispensable | 6.1% | |
| Cognitive | Low to medium | Risky, unsafe, expensive | 3.6% | |
| Reasons for positive attitudes | ||||
| Convenience: | Time-saving | 2.4% | ||
| Stay at home | 7.9% | |||
| Less risk exposure | 9.2% | |||
| Preserves financial situation (firms & employees) | 3.1% | |||
| Concerns and demands | ||||
| To increase offer and geographical coverage | 7.3% | |||
| To adopt biosafety norms | 6.1% | |||
| Unintelligible | 1.2% | |||
| Total | 100.0% |
Source: own elaboration.
Attitudes toward the service: Attitudes are overall evaluations of a brand, object, or in this case, the service provided by ODPs. Attitudes have some properties as valence (negative or positive), extremity (low to high), and emotionality (cognitive versus emotional) (Rocklage & Fazio, 2015). There was a large number of favourable responses about having the ODP service during the lockdown. Some of them qualified this possibility from “okay” to “excellent” or “useful” to “indispensable”, where “excellent” and “indispensable” denoted high extremity. Adjectives like “good”, “very good”, “positive”, “wonderful” or “excellent” are mainly emotional; while “useful”, “helpful”, “necessary”, or “indispensable” are more cognitive, i.e., beliefs about the service and its properties. Most of the responses included emotional adjectives.
“Excellent option.”
“It is the best we have.”
“It is a good option.”
“Well, it is necessary.”
There were few negative responses expressing it was a “risky”, “unsafe”, or “expensive” service:
“I find it dangerous, high risk, and at the moment I am not consuming anything prepared.”
Reasons for positive attitudes: The respondents indicated why they expressed a favourable opinion about the ODP service during the lockdown. The most cited cause was convenience, which includes time-saving and staying at home. In some cases, staying at home was imperative when the consumer had mobility problems or belonged to the most vulnerable population. The second cause was the reduction of risk exposure: less probability of overcrowding and contagion.
“It is valuable to have this service available in times of restricted mobility, especially for people who may be experiencing the disease and, because they are isolated, cannot go out or have anyone to give them food.”
“It is an excellent option; it exposes the consumer less to the threat of the virus and offers you an advantage by taking that time doing other things such as teleworking.”
“It helps us to have the necessary products without risk of leaving home.”
Finally, a smaller group of respondents considered the situation of businesses and workers since the delivery option allows preserving the financial stability of restaurants, ODPs, and delivery workers.
“An excellent option. It maintains sales in the restaurants found in the app and keeps its delivery workers employed.”
Concerns and demands: Another relevant theme that emerged from customer responses was the concern about restaurants and delivery workers biosafety guidelines when preparing and delivering the food, respectively.
“It seems very opportune to me, as long as the appropriate sanitary and safety measures are taken.”
“Food service is considered a necessary service, so it is very positive that people can buy prepared food from the comfort of their home. It is clear that delivery workers must comply with established guidelines to avoid contagion or food mishandling.”
Several customers also demanded that more restaurants, apps, and workers incorporate into the collaborative system to increase food options, improve geographic coverage, and reduce waiting times.
“It is a wise decision, and more restaurants should be added to have more available options.”
Predominantly, this analysis reveals positive attitudes towards the service, the leading reported causes are convenience and risk reduction. According to existing literature, convenience is a widely accepted motivation for using ODPs (Euromonitor, 2019; Furunes & Mkono, 2019; Yeo et al., 2017). Thus, risk reduction emerges as a new motivation in this study. In addition, there are concerns about adopting biosafety guidelines by restaurants and delivery workers. Several publications (Deloitte, 2020; Diebner, Silliman, Ungerman & Vancauwenberghe, 2020; Dore, Ehrlich, Malfara & Ungerman, 2020) report that new delivery methods are being offered to minimize physical contact between customers and delivery workers in response to consumer concerns. For example, Domino’s Pizza customers can indicate where they would prefer their order to be left (a safe and clean surface) by the delivery worker. Also, customers can select pre-payment and pre-tipping options (Fantozzi, 2020). Meituan Dianping launched a contactless delivery initiative across China using autonomous vehicles to send grocery orders (Hu, 2020).
These findings suggest the necessity of studying whether there are changes in the relationship between customer satisfaction with ODPs and its determinants, according to the proposed conceptual model.
4. Quantitative study
A quantitative study was designed to investigate whether there is a change in customer satisfaction with the ODP service and three antecedents: e-service quality, personal aspects of the delivery workers, and perceived food quality (figure 1).
4.1 Measures and methods
Items for the study constructs were adapted from previous studies and measured in 5-points Likert scales ranging from 1 (strongly disagree) to 5 (strongly agree). ODP satisfaction (e-SAT) was measured with three items from Möhlmann (2015). E-service quality (e-SQ) was measured with a summarized scale that resembles the conceptualization made by Parasuraman and Zeithaml (2005) (Harris & Goode, 2004; Ryu, Lee & Kim, 2012; Suhartanto et al., 2019). Perceived food quality (PFQ) was measured with six items (Ryu et al., 2012; Namkung & Jang, 2007), and personal aspects (PASP) was adapted from the scale proposed by Alhelalat et al. (2017). Table 2 shows the items for all the primary constructs; all items were translated from English into Spanish, slightly adjusted after a pilot study (n=18), and back-translated. There was a high level of coincidence between the original and back-translated versions of the items.
Unrestricted self-administered survey on the Internet (Fricker, 2008) is a convenience sample technique, which can be justified by the lack of access to ODPs customer databases and the context for studying ODP customers. An online questionnaire was distributed on social media (Linkedin, Facebook, Twitter, WhatsApp) in two periods; the first one during February 2020 (before COVID-19 lockdown), and the second one from April 1 to May 4, 2020 (during the lockdown). A categorical variable was created to register the two periods (PERIOD=1 during lockdown). Food apps use frequency (FREQ) (Newman, Wachter & White, 2018) and demographic variables were also measured: age (AGE), gender (GEN), income (INCO), and education (EDU).
4.2 Analysis
Confirmatory factor analysis (CFA) was performed to test several validity criteria for measuring the study constructs: construct reliability, convergent validity, and discriminant validity. An analysis of covariance (ANCOVA) was performed to determine differences in three proposed determinants and e-satisfaction evaluation. The analysis included summed dependent variables, a categorical variable describing the evaluation period as the main factor (before or during the lockdown) and control variables: age, income, education, and ODP use frequency.
The structural model in figure 1 was tested with the Partial Least Squares (PLS) technique in SmartPLS (Ringle, Wende & Becker, 2015). PLS is a suitable technique for structural equation models (SEM) when the researcher explores a new theory, rather than confirming established theoretical models. Moreover, PLS is used when complex models with many indicators and relationships are tested, with non-normal data or small sample sizes (Hair, Hult, Ringle & Sarstedt, 2017). A multi-group analysis (MGA) was performed to check if these relationships changed during the lockdown.
4.3 Results
A total sample of 483 respondents was obtained (NBefore=332; NDuring=151), and descriptive data for each group is shown in table 2. There are significant differences regarding age, income, and education. There is no significant difference in ODPs use frequency between the two subsamples. Demographic variables were used as control variables in further analyses, given its differences in the subsamples.
Table 2 Descriptive data by group and tests for differences
| Before | During | ||
|---|---|---|---|
| N | 332 | 151 | |
| Means | p-value (t) | ||
| Age (years) | 29.62 | 32.50 | 0.002 |
| Frequency (1-5) | 3.48 | 3.42 | 0.578 |
| Percentages | p-value (χ2) | ||
| Gender | 0.265 | ||
| Female | 54.2% | 61.6% | |
| Male | 45.5% | 38.4% | |
| Other | 0.3% | 0.0% | |
| Income (household, monthly) | 0.015 | ||
| $400 or less | 7.8% | 4.0% | |
| $401-$700 | 12.3% | 8.6% | |
| $701-$1200 | 23.2% | 16.6% | |
| $1201-$2500 | 26.2% | 35.1% | |
| $2501-$4800 | 18.7% | 27.8% | |
| more than $4800 | 11.7% | 7.9% | |
| Education | 0.000 | ||
| Secondary education | 34.3% | 16.6% | |
| Bachelor's degree | 37.3% | 33.1% | |
| Graduate | 28.3% | 50.3% |
Source: own elaboration.
4.3.1 Confirmatory factor analysis
Construct reliability was assessed with Cronbach’s Alpha and Composite Reliability (CR). Both criterio showed values above the recommended threshold of 0.7 (Bagozzi & Yi, 1988; Nunnally & Bernstein, 1994), the average variance extracted (AVE) for all constructs reached values above 0.5 (Fornell & Larcker, 1981), but some items were removed from e-service quality without affecting the content validity. The Heterotrait- Monotrait ratio (HTMT) was calculated for discriminant validity, which is considered a more efficient criterion than Fornell and Larcker’s (Henseler, Ringle & Sarstedt, 2015). Values for HTMT were all below 0.85 as recommended by Hair et al. (2017). Factor loadings were greater than the minimum suggested level of 0.5 (Hair et al., 2017). Taken together, these results indicate that the measurement model was satisfactory (Tables 3 and 4).
Table 3 Items and measurement model results
| Constructs and items | Factor loading | Cronbach's Alpha | CR | AVE | |
|---|---|---|---|---|---|
| e-Service Quality (e-SQ) | 0.877 | 0.903 | 0.538 | ||
| esq1 | In the app, I can easily find what I need | 0.760 | |||
| esq2 | The app makes it easy to get anything | 0.745 | |||
| esq3 | The app is easy to use | 0.773 | |||
| esq4 | Whenever I need, I can access the app | 0.750 | |||
| esq5 | The app launches straight away | 0.744 | |||
| esq6 | The app accurately informs the delivery time and conditions | 0.721 | |||
| esq7 | The payment information is safe in this app | 0.704 | |||
| esq8 | The ordered products were delivered within the estimated time | 0.668 | |||
| Personal aspects (PASP) | 0.915 | 0.934 | 0.701 | ||
| pas1 | The delivery worker had a clean and well-kept physical appearance | 0.796 | |||
| pas2 | The delivery worker's clothes looked clean and tidy | 0.784 | |||
| pas3 | The delivery worker showed friendly facial expressions | 0.840 | |||
| pas4 | The delivery worker expressed himself in a friendly and warm way | 0.881 | |||
| pas5 | The delivery worker expressed himself courteously and respectfully | 0.841 | |||
| pas6 | Overall, the attitude of the delivery worker was cordial | 0.878 | |||
| Perceived food quality (PFQ) | 0.888 | 0.914 | 0.641 | ||
| pfq1 | The food was delicious | 0.839 | |||
| pfq2 | [Brand] offered a variety of menu items | 0.734 | |||
| pfq3 | [Brand] offered freshly prepared food | 0.820 | |||
| pfq4 | The food was properly packed | 0.800 | |||
| pfq5 | I received the food at the appropriate temperature | 0.783 | |||
| pfq6 | The smell of the food was tempting | 0.823 | |||
| ODP satisfaction (e-SAT) | 0.875 | 0.923 | 0.800 | ||
| Constructs and items | Factor loading | Cronbach's Alpha | CR | AVE |
Source: own elaboration.
4.3.2 Analysis of covariance
ANCOVA results (Table 5) for each determinant and e-satisfaction evidenced that PASP is the only determinant that changed during the lockdown (the main effect of PERIOD was significant), showing a significant increase (MBefore= 4.16; MDuring= 4.39). Among control variables, FREQ was significant for all the determinants and e-satisfaction.
Table 5 ANCOVA results
| e-SQ | PASP | PFQ | e-SAT | |
|---|---|---|---|---|
| Estimated meansa | ||||
| Before | 4.349 | 4.157 | 4.409 | 4.642 |
| During | 4.393 | 4.388 | 4.495 | 4.697 |
| Main effect of PERIODb: F (p-value) | ||||
| Period | 0.45 (0.503) | 8.89 (0.003) | 1.75 (0.187) | 0.52 (0.471) |
| R2 | 0.056 | 0.059 | 0.052 | 0.091 |
a. Covariates in the model were evaluated at the following values: AGE = 30.52, FREQ = 3.47.
b. Control variables not shown in the table: GEN, INCO, EDU, AGE, FREQ
Source: own elaboration.
Table 6 Structural model and multi-group analysis
| Total sample | Before | During | Multi-group analysis | ||||||
|---|---|---|---|---|---|---|---|---|---|
| Structural relation | Path coefficient | p-valueª | Path coefficient | p-valueª | Path coefficient | p-valueª | Path coefficient difference Before-During | p-valueª | |
| H1 | e-SQ→e-SAT | 0.395 | 0.000 | 0.356 | 0.000 | 0.430 | 0.000 | -0.074 | 0.481 |
| H2 | PFQ→e-SAT | 0.275 | 0.000 | 0.291 | 0.000 | 0.292 | 0.005 | -0.001 | 0.990 |
| H3 | PASP→e-SAT | 0.145 | 0.002 | 0.171 | 0.001 | 0.090 | 0.295 | 0.081 | 0.418 |
| H4 | e-SQ→PFQ | 0.358 | 0.000 | 0.358 | 0.000 | 0.359 | 0.000 | -0.001 | 0.995 |
| H5 | PASP→PFQ | 0.305 | 0.000 | 0.343 | 0.000 | 0.233 | 0.003 | 0.110 | 0.265 |
| Control | FREQ→e-SAT | 0.118 | 0.001 | 0.158 | 0.000 | 0.063 | 0.266 | 0.095 | 0.183 |
| AGE→e-SAT | 0.019 | 0.641 | 0.047 | 0.290 | -0.012 | 0.876 | 0.059 | 0.500 | |
| GEN→e-SAT | -0.030 | 0.341 | -0.052 | 0.167 | -0.001 | 0.992 | -0.051 | 0.495 | |
| EDU_cat2→e-SAT | -0.045 | 0.277 | -0.056 | 0.230 | 0.004 | 0.963 | -0.060 | 0.581 | |
| EDU_cat3→e-SAT | -0.048 | 0.332 | -0.056 | 0.273 | -0.013 | 0.907 | -0.043 | 0.737 | |
| INCO_cat2→e-SAT | -0.055 | 0.317 | -0.103 | 0.108 | 0.047 | 0.714 | -0.150 | 0.282 | |
| INCO_cat3→e-SAT | -0.061 | 0.251 | -0.069 | 0.234 | -0.043 | 0.787 | -0.026 | 0.865 | |
| INCO_cat4→e-SAT | 0.017 | 0.768 | -0.023 | 0.707 | 0.090 | 0.631 | -0.112 | 0.531 | |
| INCO_cat5→e-SAT | 0.010 | 0.857 | -0.011 | 0.845 | 0.065 | 0.717 | -0.077 | 0.655 | |
| INCO_cat6→e-SAT | 0.016 | 0.748 | 0.015 | 0.789 | 0.001 | 0.996 | 0.014 | 0.915 |
a. From Bootstrap t-test
Source: own elaboration.
4.3.3 Structural model
The complete sample analysis showed significant and positive relations between e-satisfaction and the three determinants concerning the structural model and supporting H1, H2, and H3. The relationship between e-SQ and PFQ as well as PASP and PFQ was positive and significant, supporting H4 and H5 (Table 6). All control variables, except frequency, were non-significant. Structural models estimated with PLS should be evaluated based on their predictive power measured by the coefficient of determination (R2). Hence, R2 for PFQ and e-SAT were 0.314 and 0.499, considered moderate values (Hair et al., 2017). Moreover, size effects (f2) were estimated for all endogenous variables in the model.
The results show that e-service quality is the main factor when evaluating customer satisfaction with ODPs, with a medium effect (0.15 ≤ f2 < 0.35). Furthermore, PASP and PFQ showed small (f2 ≥ 0.02) size effects (table 7). Finally, the MGA showed no significant changes in any of the path coefficients when comparing the two temporal samples, although the impact of PASP lost significance during the lockdown. The path coefficient for PASP to e-SAT is not significant for the ‘during’ subsample, and at the same time is not significantly different from the ‘before’ path coefficient (Table 6). Further analysis of total indirect effects showed a significant effect of PASP over e-SAT (mediated by PFQ) in both subsamples.
5. Discussion and conclusions
We tested three determinants of satisfaction with online food delivery providers: e-service quality, personal aspects of delivery workers, and food quality, before and during the COVID-19 lockdown in Ecuador in order to observe whether the impact of the determinants had changed. An individual analysis of means of determinants showed that only personal aspects experienced a significant increase. A plausible explanation for such increase could be deeper customer empathy towards workers during this crisis; according to existing research, delivery workers are mostly young people with no stable jobs (Goods, Veen & Barratt, 2019; Prakash, Behera, Sharma, Relan, Harshula & Kaul, n.d.). Recently, various press reports revealed that customers valued that delivery workers expose themselves to contagion to earn a living during the lockdown, as a demonstration of gratitude, many ODP customers ordered food and gave it to delivery workers (Expansion, 2020). Thus, we infer that concerns about personal appearance and verbal interaction during the lockdown stage took a secondary role, and favourable evaluations prevailed.
Nevertheless, this positive evaluation of delivery workers might not mean a greater satisfaction with ODPs. Despite our findings with the total sample revealed that the three determinants positively influenced e-satisfaction, when the subsamples were analysed separately there was a statistical significance loss for the direct relationship between personal aspects and e-satisfaction during the lockdown. However, the indirect effect of personal aspects over e-satisfaction (mediated by perceived food quality) prevailed in both periods. Consumer concerns about biosafety guidelines compliance by restaurants and delivery workers have minimized personal interaction during delivery (Deloitte, 2020; Diebner et al., 2020; Dore et al., 2020). For example, a higher caution of consumers plus delivery practices with minimal personal contact designed by firms (Fantozzi, 2020; Hu, 2020). The loss of significance of delivery workers’ personal aspects, as a determinant of e-satisfaction can be attributed to this minimized personal interaction in times of the pandemic. Future research should analyse eventual changes in the structural relationship tested in the present, once the economic activity returns to normal or to “new normal” conditions in which some mobility restrictions and social distance guidelines would still apply.
The e-service quality is still the main factor to ensure customer satisfaction with ODPs, this result coincides with previous research (Macías et al., 2020; Suhartanto et al., 2019). Moreover, the coefficient for e-service quality was higher (0.430 vs. 0.356) during COVID-19 lockdown than before. However, food quality and personal aspects are also factors that should not be neglected - due to observed direct and indirect effects, respectively − and must evolve under current circumstances. The qualitative analysis revealed that risk exposure reduction is a strong reason for customers to hold a positive attitude towards ODPs. This finding represents a contribution to the academic literature and has managerial implications. Hence, firms involved in this collaboration (restaurants and ODPs) should follow strict biosafety guidelines in preparation, packaging, and delivery stages to trigger customers favourable perceptions. In addition, companies must communicate their efforts and practices to meet safety requirements to raise consumer awareness. Regarding methodological implications for service evaluation in this context, future measurement scales could incorporate customer safety perception about food preparation and manipulation of food packages by delivery workers.
Furthermore, convenience is a widely accepted motivation for using ODPs (Euromonitor, 2019; Furunes & Mkono, 2019; Yeo et al., 2017), also found in our qualitative analysis. Thus, we think that COVID-19 mobility restrictions add value to ODP service. Since customers were mostly positive about counting on the service during the lockdown, we anticipate a favourable predisposition in the future. Companies and new ventures must take advantage of the market opportunities to gain a share in locations where ODPs coverage is insufficient or null. In addition, new entrants in the ODP context should adopt the best practices in all the stages of the service process to fulfil customers’ expectations and offer the most pleasing experience.

