


 Inglês (pdf)
 Artigo em XML
 Referências do artigo
 Enviar este artigo por email
 Citado por SciELO
  Citado por Google
  Similares em
SciELO
Similares em
SciELO  Similares em Google
 Permalink
Introduction
Stress, defined as a set of physiological and psychological reactions triggered by any environmental threat to balance, usually occurs when individuals face a situation they perceive as overwhelming and cannot cope with (Lee & ]eong, 2019). This construct (and its consequences for health) has been a major research topic in recent decades (Klein et al., 2016), given its association with a range of negative health effects, including increased blood pressure, increased production of hormones such as cortisol (Lee et al., 2015), hypertension, cardiovascular disease (Wirtz & Känel, 2017), cancer, diabetes, anxiety, depression (Maroufizadeh et al., 2018; Pereira-Morales et al., 2019), decreased academic performance, and even a higher degree of burnout (Racic et al., 2017).
Therefore, researchers from different areas of knowledge have investigated the evaluation of this construct, based on the idea that proper assessment of perceived stress is important in the prevention ofhealth problems and to assist in the development ofprevention programs focused on strengthening coping skills (Lee & ]eong, 2019). According to Makhubela (2020), the significance of measurement is related to the fact that there is a lack of valid psychological measures of stress that can be used to detect, manage, and prevent stress and related mental illnesses.
In this context, the Perceived Stress Scale - PSS - is the most widely used scale to measure self-reported stress in clinical and non-clinical samples and has been translated into over 25 languages (Dao-Tran et al., 2017; Dias et al., 2015). There are three versions of the scale: the original was developed with 14 items (PSS-14), followed by an abbreviated version (PSS-10), and a version with four items for rapid stress assessment (PSS-4). Currently, the 10-item version is the most widely used, particularly for its conciseness and superior psychometric properties when compared to the other two versions (Makhubela, 2020).
The PSS assesses the general predisposition to the experience of stress, including inquiries about current stress levels, being used both as a result measure and as a predictor variable (Islam, 2020). It focuses on perceived stress, i.e., on one's feelings and thoughts and the degree to which they assess situations in their lives as excessively uncontrollable and unpredictable (Reis et al., 2019).
Theoretically, the PSS-10 was developed as a unidimensional measure of perceived stress, characterized by negative and positive items. However, subsequent analyses aimed at investigating its factor structure have proven to be inconsistent when considering non-clinical samples (Calderón Carvajal et al., 2017). Several factors, including the use of analytic models, the size and heterogeneity of the sample, and the characteristics of the participants (clinical or non-clinical), may explain the contradictory findings regarding PSS factor structure (Makhubela, 2020). The two-dimensional model (perceived stress and self-efficacy) has the most common factorial structure, which has been supported by studies comparing it with the one-dimensional model (Ali et al., 2021; Anwer et al., 2020; Baik et al., 2019; Huang et al., 2020; Islam, 2020; ]Jaiswal et al., 2021; Manzar et al., 2019; Mondo et al., 2019; Ruisoto et al., 2020; Tsegaye et al., 2022).
Other results consider PSS-10 as hierarchical two-dimensional (perceived distress/impotence and perceived coping/self-efficacy as factors of a lower order and a general factor of perceived stress) (Lee & ]eong, 2019). Bifactor models have recently been proposed as superior alternatives to one and two-factor models (Figalová & Charvat, 2021; Juárez-García et al., 2023; Lee, 2023; Makhubela, 2020). As described by this author, the model considers the adequate one-dimensional model used as a global score while maintaining the importance of domain-specific factors (general perceived stress factor, with two orthogonal factors: distress and perceived self-efficacy). The examples provided above indicate disagreements among researchers regarding the number and nature of latent factors that appear in the analyses (Reis et al., 2019).
In Brazil, the unidimensional solution has also been reported (Machado et al., 2014), as well as the two-factor model (Faro, 2015; Reis et al., 2010; Yokokura et al., 2017). Studies with the Brazilian version have examined the psychometric properties of the PSS-10, including its translation for older adults and its validation (Luft et al., 2007); its factor structure analysis in a sample ofteachers (Machado et al., 2014); research on its factor structure, internal consistency and evidence of convergent and divergent validity in a sample of university students (Dias et al., 2015); and its translation and analysis of factor structure, evidence of construct validity, and internal consistency (Reis et al., 2010). In addition, we also identified a study that evaluated the factorial structure of three versions of the PSS (14, 10, and 4 items), as well as the evidence of validity based on the relationship of this measure in relation to the General Health Questionnaire (QSG-12) (Faro, 2015).
Despite the large amount of research aimed at exploring the factorial structure of the PSS, there is still a limited number of studies that used item response theory (IRT) to understand the fit of the items and their differential functioning (Nielsen & Dammeyer, 2019; Reyna et al., 2019). Katus et al. (2022) suggests that assessing the equivalence of measurements across settings is a vital first step toward extending the use of stress assessments in low and middle income countries. In this sense, several researchers claim that it is necessary to compare different groups on a latent construct like PSS-10 (Islam, 2020).
There have been numerous studies examining differential item functioning (DIF) based on gender, educational level, country of origin, age, and language, but no differences have been observed (Medvedev et al., 2019; Santiago et al., 2019; Teresi et al., 2020). Nielsen and Santiago (2020) confirmed DIF for gender only in item 3. There was no study conducted in the Brazilian version.
In this sense, considering the questions that are still present concerning the factorial structure of the instrument and the scarcity of studies focused on item analysis with the Brazilian population, the present study aimed to estimate the evidence of construct validity of the PSS-10 in the Brazilian population, using Confirmatory Factor Analysis (CFA) and Item Response Theory (IRT).
Considering the CFA, we sought to investigate the factorial structure of the instrument. In addition, a multigroup CFA was performed to test measurement invariance (configural, metric and scalar invariance) by gender. Finally, the IRT was used to evaluate the fit values of the items (infit and outfit), the level of latent trait showed by the participants (theta), and the indices of difficulty and reliability of the items. Finally, we analyzed the DIF in relation to the gender variable.
Method
Study Type
This research is an instrumental study (Montero & León, 2007) because the main objective was to investigate the factorial structure of the PSS-10 from a sample of Brazilians.
Participants
This was a cross-sectional survey, based on a convenience sampling. 4970 Brazilians from general adult population participated in the study. Most of the sample was female (87.1%, n = 4329), aged between 18 and 84 years (M = 31.3; SD = 11.89). Concerning the level of education, 76.1% (n = 3783) had higher education and 23.9% were high school students. As for skin color, 50.5% (n = 2510) were white, 35% (n = 1739) brown, 11.2% (n = 556) black, and 3.3% (n = 165), other. In relation to the distribution of the sample by Brazilian regions, 51.9% (n = 2580) were from the Northeast, 30.2% (n = 1502) from the Southeast, 8.1% (n = 405) from the South, 5.8% (n = 287) from the Midwest, and 3.9% (n = 196) from the North.
Perceived Stress Scale (PSS-10)
The PSS-10 consists of ten items, with six items referring to the negative factor and four to the positive factor. The items are easy to understand and ask about an individual's feelings and thoughts during the previous month. Each question asks how much the person felt or thought a certain way. The response alternatives are arranged on a five-point Likert scale, ranging from zero (never) to four (always). The sum of the scores of all the items represents the total score on the PSS, which can range between 0 and 40 points. Higher scores indicate a higher level of perceived stress.
In Brazilian samples, the PSS-10 generally presented a bifactorial solution (Faro, 2015; Yokokura et al., 2017). There was a negative correlation between the results of the PSS-10 and the general health indices (QSG-12) (Faro, 2015). The reliability of the scale was satisfactory, with values of Cronbach's alpha (a) of .83 in a sample of elderly (Luft et al., 2007), ≥.77 with university students (Reis et al., 2010), .80 with schoolteachers (Machado et al., 2014), .79 with general population (Faro, 2015), and ≥.70 with pregnant women (Yokokura et al., 2017).
Sociodemographic questionnaire asked about gender, age, education level, skin color, and Brazilian region that participant inhabited.
Procedures and Ethical Aspects
This research was approved by the National Research Ethics Council (CONEP: 3,955,180). It was estimated that the associated risks were minimal, as all necessary ethical precautions had been complied with. However, it is possible that the respondent may have experienced slight discomfort when answering specific items. Data collection was conducted using an online platform. The link to access the survey was released and shared on a social networking site (Facebook). The collection was conducted in ]June 2020. All participants who comprised the sample signed the Free and Informed Consent Form online. The approximate time to respond to the instruments was 15 minutes.
Data Analyses
A Confirmatory Factor Analysis (CFA) was conducted on the R software, with the Lavaan package (Rossel, 2012), using the Weighted Least Squares Mean and Variance Adjusted - WLSMV extraction method (Muthén & Muthén, 2012). The WLSMV method is considered a robust estimator, which offers the most suitable option for modeling categorical or ordinal data (Brown, 2006). The following indicators were used to assess the model: (1) Comparative Fit Index (CFI) - a comparative index that ranges from zero to one, with values close to one being within the acceptable range to indicate a well-fitted model; (2) Tucker-Lewis Index (TLI) - a measure of parsimony between the indices of the proposed model and null, ranging from zero to one, with results above 0.90 being considered acceptable; (3) Root-Mean-Square Error of Approximation (RMSEA) - index that estimates how well the model's parameters reproduce the population covariance, for which values between 0.05 and 0.08 or lower are recommended to indicate fit to the model (Byrne, 2010; Tabachnick & Fidell, 2013). Factor loadings were also evaluated, and values above 0.30 were within the acceptable range (Schweizer, 2010).
We performed the analysis of invariance by gender based on a series of analysis, including configural, metric, and scalar invariances. Configuration invariance assesses the disposition of items and scale factors in relation to females and males. In turn, the metric invariance assesses whether the standardized regression weights are gender equivalent. Scalar invariance measures the possibility of adequately comparing latent mean scores (Milfont & Fisher, 2010) being recommended values of Delta CFI (ΔCFI) smaller than 0.01 and Delta RMSEA (ΔRMSEA) below of 0.015 (Chen, 2007).
Items from the PSS-10 were evaluated using the Rasch-Andrich Partial Credit Model (Wright & Linacre, 1994), using WINSTEPS version 3.7 (Linacre, 2015). Calibration, fit, and individual impact of the items were measured to verify differences between the predicted model and the observed results (Smith, 2004).
For result's interpretation, fit indices (infit and outfit) between 0.5 and 1.5, item-theta correlation values greater than 0.30, and item difficulty indices (Linacre & Wright, 2002) were considered adequate. A map of items/construct was built (Embretson & Reise, 2000), to evaluate the theta (average ability) necessary for the subjects to score on the items. The reliability of the PSS-10 was also measured. Finally, the DIF was evaluated regarding the gender variable. To analyze the presence of DIF, contrast values above 0.42 were considered, as well as probability (p <.05), regardless of whether they were positive or negative values.
Results
With the CFA, the following fit indices were observed for the unifactorial model: 1282, 573 (35000) X2gl, CFI = 0.99, TLI = 0.98, RMSEA (IC90%) = 0.04 (0.04-0.05), p <.001, considered indicators of a good fit. Factorial loadings ranged from 0.56 to 0.78, presenting values above the 0.30 recommended in the literature (Figure 1) to confirm a factorial structure composed of a single factor. The multigroup analysis of invariance of the PSS-10 showed configural, metric and scalar invariance across gender groups (ΔCFI ≤ .01 and ΔRMSEA ≤ .015) (Table 1). The results indicated that the structural factors of the PSS-10 were equivalent across gender groups.
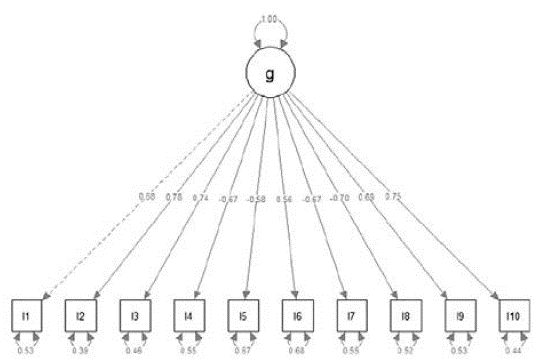
Table 1 Goodness-of-Fit Indices for Invariance Analysis of the Perceived Stress Scale (PSS-10) across Gender Groups
| Model | X 2 | df | x2/df | CFI | bCFI | RMSEA (CI 95%) | ARMSEA |
| Configural | 468.495 | 4968 | 5.93 | 0.990 | - | 0.046 | - |
| Metric | 468.495 | 4968 | 5.93 | 0.987 | 0.003 | 0.050 | 0.004 |
| Scalar | 489.776 | 4968 | 5.56 | 0.986 | 0.001 | 0.048 | 0.002 |
Notes. X 2 = chi-squared; df = degrees of freedom; X 2 /df = X2 in relation to the degrees of freedom; CFI = Comparative Fit Index; RMSEA = root mean square error of approximation; CI = confidence interval; Δ = differences between fit indexes.
The fit indices of the PSS-10 items were estimated to identify differences between what was predicted by the model and what was empirically observed. The existing differences are called residuals, and the most investigated are the infit and outfit indices.
The former verifies discrepancies in items whose difficulties are close to the subject's abilities, while the latter verifies discrepancies in extreme items. The item-theta correlation analysis was estimated to verify the ability of each item to retrieve the respondent's skill level (theta), in this case, the level of perceived stress. The results are shown in Table 2.
Table 2 Fit indices of the Items of the Perceived Stress Scale (PSS-10) in order of difficulty
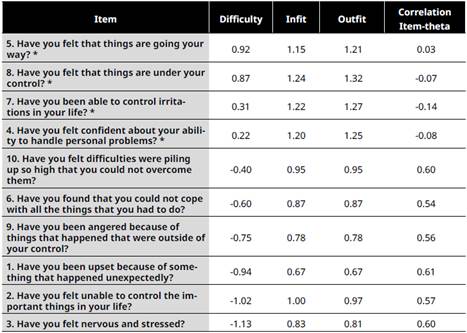
Note. * Items that presented higher potential for higher levels of stress.
It is possible to observe that the difficulty indices of the ten items ranged between -1.13 and 0.22. In turn, the values of infits and outfits ranged, respectively, from 0.67 to 1.24 and 0.67 to 1.32. Therefore, it was found that all indices were adequate. We also observed that four items (4, 5, 7, and 8) had correlation values below expected (r <.30). The remaining items had item-theta correlation values ranging from 0.54 to 0.61. The precision of the PSS-10, in relation to this sample, was considered satisfactory (a = .89).
Next, the items-person map was constructed. This type of analysis allows the scores of each person to be assessed, based on the level of ability (theta) to answer the items. This way, the easiest or hardest items to endorse are those in which people need less and more of the latent construct (in this case perceived stress) to agree with the item. The results showed that the easiest items to endorse were items 2 ("Have you felt that you were unable to control the important things in your life?") and 3 ("Have you felt nervous and stressed?"), in which, even individuals with low levels of perceived stress ticked higher response alternatives. I n this sense, these items, in general, did not prove promising to differentiate the levels of perceived stress.
On the other hand, the items that have the greatest potential to discriminate people who have higher levels of stress were the items: 4 ("Have you felt confident about your ability to handle your personal problems?"), 5 ("Have you felt that things were going your way?"), 7 ("Have you been able to control irritations in your life?") and 8 ("Have you felt that things are under your control ?"). According to the analysis conducted, only people with levels of perceived stress above average scored higher on these items. Consequently, they showed to be suitable for identifying individuals who have high levels of perceived stress.
We also analyzed DIF concerning the gender variable. This type of analysis is used to verify the existence of items with different difficulty between groups, favoring some of them. In the presence of DIF, depending on the group where the person is inserted, the item may be more easily endorsed or require a higher level of skill to be endorsed. As a criterion for assessing the presence of DIF, a contrast greater than 0.42 or a probability lower than 0.05 was adopted, as recommended by the literature. Higher, positive or negative values would lead to considering the presence of an item with DIF that favors one of the groups. The results are shown in Table 3.
Table 3 Items that showed DIF according to the gender variable
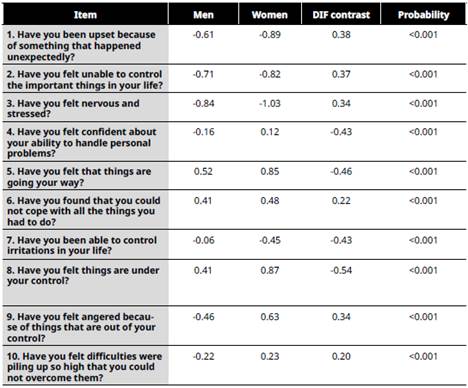
Note. DIF contrast greater than 0.42 or p <.05 = Differential item functioning.
The results indicated that four items (4, 5, 7, and 8) presented DIF for gender, with DIF contrast greater than 0.42. Items 4 ("Have you felt confident about your ability to handle personal problems?"), 5 ("Have you felt that things are going your way?") and 8 ("Have you felt that things are under your control?") were easier to be endorsed by men, requiring a lower level of perceived stress. Only item 7 ("Have you been able to control irritations in your life?") showed lower difficulty to be endorsed by women. Thus, from the analysis of the DIF according to the respondent's gender, it was observed that four of the ten PSS items presented different difficulties for the groups.
Discussion
This study aimed to contribute to the discussions about the PSS-10 factorial structure and to conduct the analysis of its items. Concerning the first objective, the results indicated a unifactorial solution that encompasses the ten items of the instrument. Thus, the presence of a continuum related to perceived stress or general predisposition to the experience of stress (Islam, 2020) is observed, based on the analysis of the individual's feelings and thoughts about the degree to which person evaluates the situations in life (Reis et al., 2019).
There is consistency between the findings found in this study and those found in previous international studies (Lee & ]eong, 2019) as well as national studies (Machado et al., 2014). It is noteworthy, however, that other studies using Brazilian samples (Faro, 2015; Yokokura et al., 2017) as well as international studies (Baik et al., 2019; Manzar et al., 2019; Mondo et al., 2019) have found a solution based on two factors. These results confirm the lack of consensus in the literature (Calderón Carvajal et al., 2017) given the heterogeneity of studies regarding samples and data analysis methods (Reis et al., 2019).
We found equivalency between the structures for male and female participants, suggesting that the PSS-10 scores were not affected by gender bias. This resembled previous studies with the PSS-10 (Denovan et al., 2019; Liu et al., 2020; Reis et al., 2019). The results of this study confirm those of Juárez-Garca et al. (2023), Makhubela (2020), Islam (2020), Lee (2023) and Liu et al. (2020), which indicate that PSS-10 provides an assessment of perceived stress that is equivalent for males and females.
The third analysis, conducted with IRT, adds important benefits to the investigation of the psychometric qualities of the instruments, although this method has been little used in PSS-10 (Nielsen & Dammeyer, 2019; Reyna et al., 2019), and no study of this nature was found using the Brazilian version of the instrument, despite its widespread use. The adoption of this analysis model allowed the parameters of the items to be known, the examination of how the items work for individuals who have different levels in the assessed skill, and the investigation of the impartiality of the measure concerning the respondent's gender. Accordingly, four items displayed DIF according to gender, three of which benefited males.
The analysis made it possible to identify the thoughts and feelings that most differentiate individuals with high levels of perceived stress. None of the items presented maladjustment, so there was no need to consider the exclusion of any of them. The results confirm others found in the national and international scientific literature, indicating the instrument's suitability for the purpose to which it was designed (Dao-Tran et al., 2017; Dias et al., 2015). Therefore, the results presented add evidence of validity to the Brazilian version instrument, which, added to those previously investigated (Dias et al., 2015; Faro, 2015; Luft et al., 2007; Machado et al., 2014; Reis et al., 2010; Yokokura et al., 2017), point to the adequacy of the instrument as a measure of perceived stress in the Brazilian population.
Considering that evidence of validity should be continuously researched (Ambiel & Carvalho, 2017), we recommend further studies that investigate other sources of validity as well as precision. Considering the widespread use of the instrument in Brazil, the amount of research conducted so far is still limited and presents several gaps that should be explored, such as other types of precision besides internal consistency or evidence of validity based on criterion groups. It is also noteworthy that the studies, for the most part, have been limited to investigating a specific portion of the population (older adults, teachers, university students), which are not representative of the Brazilian population.
We recommend future studies to include a more diversified sample with equality of participants by gender, lower levels of education, different socioeconomic levels, and including a criterion group (e.g., diagnosed with stress) to compare the effectiveness of the instrument in differentiating this group. We also recommend further research aimed at identifying DIF considering other variables, such as age group, skin color, work occupation, and region of origin.
However, some limitations should also be mentioned, such as the predominance of women participants, with a high level of education, and young adults. The non-randomness of the sample limits its representativeness. Such restrictions require that the results presented here be interpreted with caution. Another possible limitation of this study is the fact that data collection was conducted during the COVID-19 pandemic period, in ]June 2020, a phase characterized by high levels of stress, fear, and anxiety (Ho et al., 2020). Although contextual aspects, a priori, do not affect the structure of the measure, it is possible to consider that the current pandemic situation may be changing the behavior of some items concerning the gender variable.

