


 Inglês (pdf)
 Artigo em XML
 Referências do artigo
 Enviar este artigo por email
 Citado por SciELO
  Citado por Google
  Similares em
SciELO
Similares em
SciELO  Similares em Google
 Permalink
1. INTRODUCTION
This paper evaluations compressive strength prediction for rice husk ash (RHA) cementitious material incorporated concrete using artificial neural networks (ANNs), based on previous experimental data. Accurate predictions could promote sustainable building material usage.
Chandwani et al. [1] study on ready mix concrete modeling, the artificial neural network (ANN) model showed promising results in comparison to first-order and second-order regression techniques, for modeling unknown complex relationship exhibited by design mix proportion and concrete slump. Sathyan et al. [2] used random kitchen sink algorithm and regularized least square to predict concrete rheological and hardened properties, results indicated RMSEs and mean absolute errors (MSEs) of less than 0.05.
According to Revathy et al. [3] the MAPE represent model performance and RMSE -Equation (3)represent the error between the experimental and predicted results. Sathyan et al. [2] study on prediction of concrete rheological and hardened properties, input parameters enclosed weights of ingredients including cement, coarse aggregates, fine aggregates, four superplasticizers dosage and water. Islam et al. [4], ANOVA analysis indicated water to binder ratio and contents of:cement, fine aggregate content, coarse aggre-gate, rice husk ash and superplasticizer, had direct effect on strength of RHA incorporated high performance concrete.
Study by Thiedeitz et al. [5] generally 40% cement replacement with RHA or fly ash indicated strong reduction of compressive strength, whereas 20% cement replacement with RHA or fly ash could even improve performance. Study by Sala et al. [6] for 10% replacement by weight of metakaolin, thermal RHA and chemical treated rice ash with raw materials from Colombia indicated that pozzolanic material incorporation increased concrete compressive strength.
Utilization of waste from rice production/processing for construction could provide alternative sustainable materials, while reducing the solid waste burden. According to Thiedeitz et al. [5], as renewable resource rice husk provides construction materials constantly, there is need for investigation on possibility of each ecologically friendly material for building. Effective predictive techniques for properties with concrete incorporated with RHA could be a step towards better structural decisions and development of proper codes of practices. Use of predictive modeling for concrete incorporated with materials from waste could provide a cost-effective techniques for green concrete quality control. The use of data from various past studies, with varying material, physical and human characteristics, would provide a good measure of the resilient levels of neural network.
This research aims at using ANN to predict concrete with partial replacement or addition of RHA as cementitious material, based on datasets from reviews of experimental research. The research considered four (4) input variables including superplasticizer or water reducers variation from control (%), water to binder ratio, percentage of RHA and control compressive strength. The output variable is RHA binder incorporated compressive strength.
1.1 HA Composition, Applicability and Effects
Study by Thiedeitz et al. [5] indicated specific surface area based on BET adsorption method for rice husk ash (grounded for 20 seconds with 20 Hertz frequency) and cement CEM 1 42.5R were 128 m2/g and 1.24m2/g respectively. Study by Fernandes et al. [33] on RHA from thermoelectric company in Brazil, indicated mean diameter of 19.56 + 0.49 gm, specific weight of 2.22 + 0.0028 g/cm3 and specific area of 11.35 + 0.21 m2/g, for RHA described in Table 1. Based on Fernandes et al. [33] study, the specific surface area reduced with thermal treatment temperatures. Habeeb and Mahmud [35] study for RHA indicated specific gravity of 2.11 as compared to 2.94 for ordinary portland cement (OPC) and loss of ignition was relatively high (5.81) for RHA as compared to that of OPC at 1.73. RHA grounded with Los Angeles machine showed decreasing average particle sizes, from 63.5 gm to 11.5 gm for grinding periods of 90 to 360 minutes respectively while OPC had average size of 22.1 gm according to Habeeb and Mahmud [35]. According to Yao et al. [36], RHA biomass char waste had carbon content of 82.26% of weight, specific surface area of 205.32 m2/g, pore volume of 0.145 cm3/g.

According to Glushankova et al. [7] results confirmed that amorphous silica is obtained from burning of rice hull in usual atmosphere and material contains silica as basis of building material manufacturing. Rice hush ashes produced by calcination at 600oC and calcination at 700oC were rather amorphous in comparison to scoria and pumice samples calcinated at corresponding temperatures, hence that explained why those RHAs had higher pozzolanic activity index (PAI) at 7 days compared to the scoria and pumice samples as reported by Mboya et al. [8]. According to Safiuddin et al. [9] RHA with silica content of 93.6% indicated RHA as highly reactive pozzolanic also obvious from high accelarated PAI at 122.4%. Large quantities of SiO2 compounds in the form of cristobalite, quartz and tridymite were found in RHA as by Yao et al. [36].
According to ASTM C 618, as cited by Mboya et al. [8], the sum of the basic oxides should be over 70%, for material to qualify as pozzolan. Mboya et al. [8], considered the cumulative amounts of SiO2, Fe2O3 and Al2O3 in RHA, pumice and scoria samples. Table I shows selected chemical compositions for RHA from previous research all having cummulative amounts of SiO2, Fe2O3 and Al2O3 of >70%, hence qualifying RHA as pozzolanic material.
According to Islam et al. [4] study indicated portland cement with CaO (65.3%), SiO2 (21.54%), Al2O3 (5.99%), Fe2O3 (4.45%) and Habeeb and Mahmud [35] study indicated ordinary portland cement having SiO2 (20.99%), Al2O3 (6.1 9%), Fe2O3 (3.86%) and CaO (65.96%).
According to Thiedeitz et al. [5] study, extremely high RHA surface area lead to more sites for pozzolanic reaction and high porosity causes increased water demand. Study by Cecconello et al. [32] using RHA, as partial replacement of cement, indicated that RHA pozzolanic reaction reduced porosity, with effect of RHA resulted to a reduction of total porosity of concrete mixtures. Reddy et al. [34] study indicated that for similar water to cementitious material ratios, compressive strengths of RHA modified concrete were higher compared with concrete with portland cement only, while, splitting tensile strengths, flexural strength, shrinkage strains and corrosion potential were lower for RHA modified concrete compared with concrete with portland cement only. According to Habeeb and Mahmud [35] increase in RHA fineness enhanced blended concrete strength in comparison to coarser RHA and OPC mixes.
Higher RHA silica content makes it an effective alternative to more expensive silica fume and blast furnace slag for control of corrosion, furthermore RHA is a renewable resource while fly ash is fossil-based according to Reddy et al. [34] also, high silica amount causes RHA to have potential to be utilized as pozzolanic material for blended cement concrete production in the building industry as indicated by Yao et al. [36]
2. METHODOLOGY
2.1 Review and Dataset (Inputs/Outputs)
Review of past data was conducted and for rice husk incorporated concrete, 72 datasets were identified, from 15
previous researches. Table II shows the data derived from the sources, used for artificial neural networks. Table II also shows the modifications on sourced information or data.

From the Table II compressive strength of RHA incorporated concrete ranged between 17.01MPa to 107MPa and the RHA binder material ranged between estimates of 5% to 30% by weight. Dataset was normalised and divided into three namely training, validation/checking and testing dataset. Hasanzade-Inallu et al. [27] used artificial neural networks (ANNs), implemented in MATLAB R2019a trained using bat algorithm, to bring various input and output variables to similar ranges, each variable was normalized, by subtraction of minimum and division by its range and output network must be denormalized by the reverse process. Input and output data are normalized to improve generalization ability of artificial neural network and better comparison and avoidance of influence of value parameters, data normalization is scaling of all inputs and outputs pairs with range (0,1), based on Equation (1) and model output is obtained in the normalized output form (scaled value), then denormalized according to Equation (2) as indicated by Henigal et al. [28]. Datasets for this study were normalised and predicted values were de-normalized based on Equations (1) and (2) respectively.

Sathyan et al. [2] used random kitchen sink algorithm and regularized least square to predict concrete rheological and hardened properties, with 32 data sets (80%) used for training and 8 datasets (20%) for testing. Revathy et al. [3] used various types of network functions, one of the types using algorithm BFGS quasiNewton back propagation, indicated using 34 datasets for training, 8 for validation and 8 for testing. For this study, the 72 data were divided into 51 (70.83%) for training, 10 (13.89%) for validation or checking and 11 (15.28%) for testing. The selection of the three dataset was done using multiple randomilization of dataset, with the variables averages of overall and the three grouped datasets checked so that to ensure that no extremely large, biases occurred.
According to Abalaka [12] study, as the water to binder ratio increased, the quantity of maximum RHA replacement increased. According to Hussin and Parasuraman [16], there was a decrease in slump with increase percentage of RHA, with higher water demand for RHA due to higher surface area of RHA compared to cement. Karthik et al. [15] study indicated maximum strength at 12.5% RHA as binder replacement was 0.4 water/binder ratio. Water to binder ratio for RHA incorporated concrete affect the concrete properties hence need for consideration. Also, the impact of superplasticizer or water reducer was considered in the dataset as it affects the workability hence strength. In this study, water binder ratio and superplasticizer or water reducer quantities variations were considered.
This study was focused on the effect of partial replacement or addition of RHA as concrete cementitious material, hence the % of RHA (by weight) was considered as the ma jor input. There were four (4) Input values from dataset in Table II including:SP or WR % difference of binder from control; W/B ratio; control compressive strength (Mpa) and % RHA by weight and one output value:Compres sive Strength (MPa) of RHA cementitious material incor porated concrete.
2.2 Artificial Neural Networks (ANNs)
This study used ANNs where, input layer had 4 input variable, 1 hidden layer with varying number of nodes and output layer having 1 variable as shown in Fig. 1.

Source: the authors
Fig. 1 ARTIFICIAL NEURAL NETWORK INFRASTRUCTURE SHOWING THE INPUTS AND OUTPUT VARIABLES
The network was developed in OCTAVE 5.2.0 version, free software according to Eaton et al. [37]. Hasanzade-Ina llu et al. [27] study, was divided into training and testing groups randomly, using ANNs with different architectures having 1 hidden layer with different neurons.
ANNs adopted used backpropagation (backprop) algo rithm. Network and backprop was adopted from Oman [38] illustration included evaluation of errors at output mode being the difference between the output from the networ (hypothesis) and the experimental values, taking the erro at certain layer within the network and propagating it bac through the network then adjustments of weights since error are known. The network used activation functions, Tanh as re fered to Gupta [39] and GeeksforGeeks [40], for both hidden and output layers and learning rate of 0.06. Various iteration for the models were run, using trial-and-error, with an objec tive of selecting model with predicted values that generat lower RMSE and higher R2. Training dataset was used to train the models, then the validation/check dataset run, mainly ai med at checking performance of model after training. Model which indicated relatively good performance for particularl check/validation dataset (case-by-case assessment) were then subjected to the testing dataset.
2.3 Method for Analysis of Models
RMSE was used in OCTAVE to check the performance of datasets after running the model. In addition LibreOffice spreadsheet were used to calculate RMSE, R2, MAE and MAPE. Zhang et al. [29] employed the Root Mean Square error (RMSE) -Equation (3)and absolute factor of variance (R2)Equation (4)to examine deviations between the predicted and experimental values and Chandwani et al. [30] used Mean absolute Error (MAE)Equation (5)and Mean Absolute Percentage Error (MAPE)Equation 6as statistical performance metrics for evaluation of the trained models. Four evaluationsRMSE, MAE, R2 & MAPE in Equations (3) to (6) were used for this study

Where:n: No. of Data set; Eii: Experimental Data; Pii: Predicted Data
The RMSE and R2 for Check/Validication dataset or the overall dataset were mainly applied to indicate the model performance and selection of optimum network.
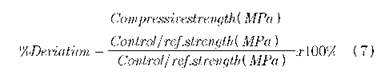
Percentage differences for the original and predicted valúes, from the control strength Equation (7)and the means were computed in LibreOffice spreadsheet.
3. RESULTS
After various trials, with varying number of nodes in hidden layer or/and varying iterations, and evaluation of the entire dataset RMSE performance, the selected ANNs is presented in Table III.

Graphical representation of experimental and predicted compressive strengths values for the selected ANN model is illustrated in Fig. 2.

The selected ANN structure in Table III, had RMSE, MAE, R2 and MAPE is presented in Table IV.

Testing data had the lowest RMSE of 3.98MPa while the highest was validation/checking data (6.56MPa), while the R2 was between 0.98 to 0.99 for the 3 datasets. The MAE ranged between 3.44MPa and 4.94MPa and the MAPE ranged between 9.19% and 12.41%, as showing in Table IV.
Table V shows the % differences from the control strengths for original dataset and predicted values based on % of RHA replacement or addition.

The original values mean differences for 7% and 10% RHA cemetitious material incorporate concrete were higher by 8.15% and 7.9% respectively in relation to the control strength, those being the highest and 2nd highest for that dataset. The predicted values mean differences for 5% and 10% RHA cemetitious material incorporate concrete were higher by 5.30% and 4.12% respectively in relation to the control strength, those being the highest and 2nd highest for that dataset.
4. DISCUSSION
Testing data had the lowest RMSE (3.98MPa) while the highest was validation/checking data (6.56MPa). A model by Islam et al. [4] 28-days strength of RHA incorporated high performance concrete, the RMSE was 4.96, an indicator of accuracy of the model fit, showing good agreement with experimental data and could be used to predict. Overall RMSE, for this study, of 5.10MPa indicates reasonable accuracy. The overall MAE was 3.81MPa, the lowest being for the testing with 3.44MPa and the highest for validation/checking data, with 4.94MPa. Considering that datasets from different previous studies were used, with potentially wide variation of physical, human, chemical, technical/methodologies and environmental factors and also wide range of compressive strengths between 17.01MPa to 107MPa the overall RMSE and MAE values indicated quiet good accuracy. Overall R2 for the model was 0.99, the lowest indicated by the validation/checking data, with 0.98. Based on this, the performance of the model was accurate.
According to Revathy et al. [3], for MAPE value of less than 10% was an indication of very good performance of model and for MAPE value greater than 10%, could be due to higher variation in experimental data. The MAPE values for this research was 9.73% for the overall data, with the lowest being for training data, with 9.19% and the highest for the validation/checking data, at 12.41%. Based on this, with consideration to other possible influencing variations that were not quantified and the wide range of compressive strength within the study, the developed models indicated quite good accuracy, for overall data in prediction of compressive strengths for RHA incorporated concrete.
Table V, shows the percentage differences for the original data and predicted values, from the control strengths. The original values mean differences for 7% and 10% RHA cementitious material incorporate concrete were higher by 8.15% and 7.9% respectively and generally, the average percentage strength differences increased from 5% to 7% RHA cementitious material incorporate concrete, then followed by a decreasing trend, as RHA content increased, the lowest being at -2.28% at 30% RHA replacement/addition as cementitious material. Based on the original values data, average % differences shows that 5% to 12.5%, the RHA incorporated concrete generally indicated higher strengths with those between 15 to 30% generally exhibited lower strengths compared to control strengths. Generally, both predicted and original dataset, indicated higher strength values for 5% to 10% RHA incorporated cementitious material concrete, while the 15% to 30% RHA cementitious contents indicated lower strength values compared to control strengths.
5. CONCLUSION
The following are conclusions and recommendations, related to this study:-Overall RMSE, R2, MAE and MAPE were 5.10MPa, 0.99, 3.81MPa and 9.73% respectively.
The ranges for the three groups of datasets (training, validation/checking and testing) for RMSE, R2, MAE and MAPE were between 3.98MPa-6.56MPa, 0.98-0.99, 3.44MPa4.94MPa and 9.19%-12.41% respectively.
Based on the performance of model, the % amount of RHA as cementitious materials and the other three variables had significant impact on compressive strength.
Other physical, human, chemical, technical/methodologies and environmental factors possibly had an influence on strengths, particularly for this review that used different sources of data.
Also, there were variance in conditions, such as temperature and/or duration, for RHA production from rice husks, methodologies and concrete strengths values.
Considering 4) and 5), the selected ANN showed quite good performance. The higher error values based on the model could be attributed to those variations. This study is an indicator that machine learning techniques could be used to predict green concrete production.
Generally, both predicted and original dataset, indicated higher strength values for 5% to 10% RHA incorporated cementitious material in concrete.
This study recommends that further application of machine learning techniques for model concrete incorporated with sustainable alternative materials. There should be universal standards for production of sustainable materials, for concrete production. Future modeling for green concrete should be conducted focused to one or adjacent concrete class(es).

