


 Inglês (pdf)
 Artigo em XML
 Referências do artigo
 Enviar este artigo por email
 Citado por SciELO
  Citado por Google
  Similares em
SciELO
Similares em
SciELO  Similares em Google
 Permalink
INTRODUCTION
The lulo (Solanum quitoense Lam.) is a fruit tree species in the Solanaceae family, and is a promising crop for agro-industry because of its potent organoleptic characteristics and physical traits (Cardona et al., 2016; Criollo-Escobar et al., 2020). It is an economically important crop in Colombia, mainly in the Andean region (Almanza-Merchán et al., 2016; Sánchez-Reinoso et al., 2019).
In Colombia, this crop is grown between 1,300 and 2,200 m a.s.l. mainly using two species: S. quitoense var. quitoense (sweet and without thorns) and S. quitoense var. septentrionale (acid and with thorns) (Ochoa-Varagas et al., 2016). In 2018, there were approximately 8,800 ha of this crop established in 21 departments, particularly Huila and Valle del Cauca, which had the larger crop areas, covering 2,005 and 1,029 ha, respectively. The domestic lulo production increased from 8.87 to 9.86 t ha-1 in the last 10 years (Agronet, 2020).
In 2018, the Department of Nariño had 609 ha of lulo crops according to Agronet (2020), mainly distributed across the northern and southern municipalities. This crop area produced an average yield of 5.64 t ha-1; accordingly, Nariño ranked fourth for the domestic supply and had a yield deficit (i.e., lower yield than the national average). Moreover, departments such as Huila (7.15 t ha-1) and Valle del Cauca (12.2 t ha-1) had larger crop areas and production.
One of the main factors limiting lulo cultivation in Colombia is the insufficient supply of improved cultivars, mainly the result of the scarcity of genetic improvement plans or programs for this species. There are no medium- and long-term solutions, making it necessary to generate strategies to increase productivity. One of these strategies is the evaluation of the germplasm with different approaches (Lagos-Santander et al., 2019). In these evaluations, a population analysis can be used to study the genetic control of quantitative traits, evaluating both general and specific combinatorial skills in breeding programs to obtain desired agronomic and genetic traits, depending on the research context (Manjarrez et al., 2014).
In Colombia, studies on lulo have focused on the germplasm that has been collected and conserved, especially in the departments of the Andean region. This research has allowed advancements in the characterization, assessment, and enhancement of the variability in this species. For instance, lulo La Selva is an improved cultivar with traits such as lack of thorns, erect growth habit, and high fruit set, among others (Medina et al., 2009). Furthermore, studies by Morillo-Coronado et al. (2017) and Morillo et al. (2019) reported genetic diversity in lulo plants from the central region of Colombia.
When genetic improvement programs focus on hybridization, the genetic performance of economically important traits in each population must be elucidated, as well as the type of gene action in relevant traits. This will enable the selection of the best improvement scheme for maximizing genetic variance, such as increasing and fixing the frequencies of desirable genes in a population (Luna et al., 2013; Haochuan et al., 2014).
A proposed method evaluates the general combinatorial ability (GCA) and specific combinatorial ability (SCA), conceptually defined by Sprague and Tatum (1942): the GCA is the average yield of a line in all its hybrid combinations and the SCA applies to cases in which specific hybrid combinations are expressed positively or not, compared with the average yield of the parents. The GCA and SCA were evaluated using four methods developed by Griffing (1956), which are based on the analysis of the parents and their direct and reciprocal F1 crosses (1); the parents and their direct F1 crosses (2); the direct and reciprocal F1 crosses (3); and only the direct F1 crosses (4).
According to Cervantes-Ortiz et al. (2011), the evaluation of germplasm with these methods first take advantage of the additive genetic variance by selecting parents with good GCA and then the non-additive variance with hybridization in the crosses with good SCA. These parallel analyses estimate the genetic parameters of the parents and their progeny to determine the most appropriate method of genetic improvement (Wong et al., 2007). A single cross has a high yield when both parents have a high GCA or at least one line has a high GCA and positive SCA effects (Escorcia-Gutiérrez et al., 2010; Guerrero-Guerrero et al., 2011). Lines with high GCA effects can be used to develop synthetic varieties, while specific combinations with high yield are used in hybridization schemes. In addition, the effects caused by GCA are associated with additive effects in genetic improvement and can be used for the selection and subsequent hybridization of progenitors with good combining ability (Cervantes-Ortiz et al., 2016).
In lulo crops, there are several baseline studies for the establishment of improvement programs based on the assessment of genetic effects to select individuals with high desirable traits. For instance, Lagos et al. (2015) assessed the performance of half-sibling families to obtain cultivars with better fruit quality for specific markets. Furthermore, Lagos-Santander et al. (2020) reported differences in the fruit quality and yield of parents and lulo hybrids in the Department of Nariño.
This study aimed to determine the genetic components of the GCA and SCA involved in growth, development, and fruit quality variables in a diallel cross of 10 parents from half-sibling families of lulo in four growing regions in the Andean region of the Department of Nariño (Colombia).
MATERIALS AND METHODS
This research was conducted on farms located in four municipalities in the Andean region of the Department of Nariño (Colombia): Tangua, Arboleda, San Pedro de Cartago, and La Union. In Tangua, the experimental plot was located at 1°3’44,74’’ N, 77°25’12,26’’ W, with an altitude of 2,403 m a.s.l., an average temperature of 16°C and sandy clay-loam soil. The plot in Arboleda was at 1°30’45’’ N, 77°08’42’’ W, 2100 m a.s.l., with an average temperature of 19°C and clay soil. The plot in San Pedro de Cartago was located at 1°33’21.6’’ N, 77°06’39.1’’ W, with an altitude of 2,100 m a.s.l. and 18°C temperature in a sandy clay soil, and the plot in La Union was situated at 1°34’12.1’’ N, 77°07’36.9’’ W, with an average temperature of 19ºC, an altitude of 1650 m a.s.l. and clay soil.
A diallel cross with 10 parents from half-sibling families (HSF) of lulo was conducted to obtain an F1 cross comprising 45 hybrids. The plants were obtained from the Grupo de Investigación en Producción de Frutales Andinos (GPFA) of Universidad de Nariño. The parents had desirable agronomic characteristics, with yields ranging from 5.08 to 10.21 t ha-1, fruit weight varying from 63.4 to 78.87 g and total soluble solids ranging from 9.41 to 10.72°Bx. The diallel cross was done with Griffing method 4, which included direct F1 crosses and excluded parents and reciprocal crosses.
An alpha-lattice experiment design with two repetitions was used at each location. The repetitions comprised 45 treatments on the lulo hybrids from the diallel cross. Each treatment was performed on a row of five plants, with 2.5 m between plants and 3.0 m between rows, for a total of 90 experiment units. Two border rows with 20 plants each were planted on each side of the experimental plots, for a total of 470 plants per experiment, covering a surface area of 3,525 m2. The useful plot included three central plants in an area of 22.5 m2.
The assessed variables included: days to flowering onset (DFO), determined as the number of days from the beginning of the experiment until the onset of flowering in 50% of the experimental plot; number of clusters per branch (NCB), determined as the number of floral clusters in three productive branches per plant in the experimental plot; fruit weight (FW), determined as the average weight of five fruits per introduction (g); polar axis of the fruit (PA), determined as the average polar axis length of five fruits (the measurements were taken using a caliper, mm), and yield (Y) (t ha-1), determined based on the weight of fruits harvested from the useful plot (three central plants) for six months during the production phase. The fruits were harvested at maturity stage 3 (ICONTEC, 2002).
The experiment data were analyzed using an analysis of variance (ANOVA) with SAS (System of Statistical Analysis) version 9.0. Significant differences between treatments were established when the null hypothesis was rejected for a given variable, as reported by Antuna et al. (2003) and De la Cruz et al. (2010). These authors established significant differences between treatments when the highest values were greater than the overall mean plus the standard error (μ+σ) and highly significant when the values were greater than the mean plus twice the standard error (μ+2σ). For the DFO, the potent hybrids had values below μ-σ or μ-2σ, indicating significant or highly significant differences.
The sum of squares for the hybrids and hybrids x locations were separated by the GCA and SCA (as sources of variation), as well as the interactions of the combining abilities with the locations-L (i.e., GCA×L and SCA×L, respectively). The effects were calculated using the GENES software (Cruz, 1998).
RESULTS AND DISCUSSION
The mean of the squares for the combined ANOVA showed a significant effect from the locations (P<0.01) for all variables (Tab. 1). This effect can be attributed to environmental components such as the soil type and climate. The interaction H×L was highly significant (P<0.01) for the DFO, NCB, FW, and Y. The hybrids showed highly significant differences (P<0.01) in DFO and PA, along with significant differences (P<0.05) for FW. Accordingly, De la Cruz et al. (2007) stated that significant effects might result from differences between hybrids because of the sum of the additive effects of their parents, making it possible to select the best hybrids. However, there were no significant differences in NCB and Y, likely indicating that these traits are strongly influenced by the environment (Camposeco et al., 2015).
Table 1. Mean of squares of the combined analysis of variance for performance traits in 45 lulo (S. quitoense) hybrids assessed in four locations in the Andean region of the Department of Nariño.
| SV | DF | DFO | NCB | PA | FW | Y |
|---|---|---|---|---|---|---|
| LOCALITY (L) | 3 | 12081.27** | 1390.50** | 1618.70** | 10546.95** | 5823.28** |
| REP(L) | 4 | 265.82** | 0.82NS | 38.76** | 1.74NS | 1.86NS |
| HYBRID (H) | 44 | 185.98** | 6.92NS | 16.84** | 589.37* | 26.35NS |
| GCA | 9 | 512.25* | 10.03NS | 36.13** | 678.83NS | 27.77NS |
| SCA | 35 | 102.08NS | 6.12NS | 11.88NS | 566.37NS | 25.99NS |
| H × L | 132 | 98.68** | 5.44** | 8.13NS | 385.97** | 24.71** |
| GCA × L | 27 | 167.30** | 7.72** | 7.72NS | 360.71** | 25.74** |
| SCA × L | 105 | 81.03** | 4.85** | 8.24NS | 392.47** | 24.44** |
| ERROR | 176 | 51.32 | 0.60 | 7.35 | 5.19 | 0.84 |
| CV (%) | 5.03 | 7.70 | 5.04 | 2.30 | 4.40 | |
| R 2 | 86.6 | 98.00 | 84.06 | 99.16 | 99.33 |
DFO: days to flowering onset; NCB: number of clusters per branch; FW: Fruit weight; PA: Polar axis of the fruit, and Y: Yield. NS: non-significant; * and ** indicate significant and highly significant values, respectively.
There were significant differences in DFO and PA in response to the GCA effects. Specifically, these variables showed a higher mean of squares than those obtained for the SCA, indicating that additive genetic variation determines the response of these two variables more than non-additive variation (Ortiz and Rodes, 1993). Conversely, there were no significant differences in the NCB, FW, Y, or SCA (Tab. 1). Similar results were found by Lagos et al. (2007) in a dialelic of 10 Physalis peruviana parents, where SCA was not significant for yield.
For the interactions between GCA×L and SCA×L and the variables DFO, NCB, FW, and Y showed highly significant differences (P<0.01), indicating distinct performances of each parent and hybrid across the environments. Therefore, parents with significant GCA effects across environments should be selected (De la Rosa et al., 2000). For the DFO, NCB, and Y, the contribution of the effects of GCA×L was greater than that of the effects of SCA×L. This finding demonstrates that additive effects dominate over non-additive effects. For the PA, the interactions between GCA×L and SCA×L were non-significant, indicating that the hybrids may be stable across the evaluated environments and that the expression of AP is not defined by this factor but by genotype. From this point of view, it is possible to select hybrid combinations with significant AP averages with the expectation that they will be stable or that their average improves when the environment offers better conditions for the expression of this characteristic (Tab. 1).
Overall, the additive effects dominated the non-additive effects for the assessed traits. This result indicates that the selection of parents with good characteristics for DFO, NCB, and Y can increase the productive potential species according to the significant environmental effect (Tab. 1) (Vivek et al., 2010). Similar results were found by Hernández et al. (2016) in three lines of Solanum lycopersicum, where additive effects were decisive for higher average yields. Therefore, parents with high averages for DFO, NCB, and Y can be higher allele contributors in breeding programs for new varieties using hybridization methods or recurrent selection, where performance for a given characteristic could be verified with an F2 generation assessment (Rivera-Colín et al., 2019).
General combining ability (GCA)
Table 2 shows the effect of the GCA on five traits of agronomical interest in lulo for the 10 assessed parents. For the DFO, the additive effects accounted for 56.3% of the total sum of squares. Additionally, there were positive and significant values for parents 6 and 7 (3.75* and 3.86*, respectively) and a negative and significant effect for parental 8 (-5.05**). Parental 8 is desirable because of an early onset of flowering and a higher capacity of transmission through all possible crosses; furthermore, the average of this parental was less than that of its hybrid combinations (García and Vallejo, 1990).
Table 2. Effects of the general combining ability (GCA) on five agronomically important lulo traits in (S. quitoense) 10 assessed parents.
| PARENTS | DFO | NCB | PA | FW | Y |
|---|---|---|---|---|---|
| 1 | -1.92 | 0.60** | 0.08 | -3.20** | -0.43 |
| 2 | 2.63 | -0.23 | -0.65 | -6.20** | -0.97** |
| 3 | 0.29 | -0.11 | -1.31* | -0.22 | -0.88** |
| 4 | -2.19 | -0.74** | -0.68 | 2.26** | 0.66** |
| 5 | -1.17 | 0.17 | 0.38 | 0.07 | 0.23 |
| 6 | 3.75* | -0.18 | 0.69 | 5.53** | 0.48* |
| 7 | 3.86* | -0.17 | 1.27 | 3.07** | 0.02 |
| 8 | -5.05** | 0.36 | -0.30 | 0.01 | 1.08** |
| 9 | 0.48 | -0.15 | 0.27 | -0.04 | 0.14 |
| 10 | -0.68 | 0.45* | 0.26 | -1.28* | -0.33 |
DFO: Days to flowering onset; NCB: Number of clusters per branch; FW: Fruit weight; PA: Polar axis of the fruit, and Y: Yield. * and ** indicate significant and highly significant values, respectively.
For the NCB, there were positive GCA effects from parents 1 (0.60**) and 2 (0.45*), indicating their high transmission capacity for this trait through all possible crosses. Conversely, parental 4 had a negative and significant effect (-0.74**), which demonstrated the below-average performance of its hybrid combinations (Tab. 2). This trait is important for several agronomical management tasks that aim to increase the production potential of plants. Accordingly, the recommended plants should have at least four to five productive branches to increase the number of extra-category and first-category fruits (Ardila et al., 2015).
For the PA, no positive and significant GCA effects were found; however, parental 3 had a negative effect (-1.31*), indicating the below-average performance of its hybrid combinations. Lagos-Santander et al. (2019) and Lagos-Santander et al. (2020) reported positive and significant correlations of PA with FW and Y, meaning this variable was associated with traits related to the production potential of lulo. In this case, the FW had significant GCA effects in parents 4, 6, and 7 (2.26**, 5.53**, and 3.07**, respectively). On the other hand, for Y, the effects of parents 4 (0.66**), 6 (0.48*), and 8 (1.08**) indicated that they contributed to the parent-offspring transmission of this trait and that the additive effects were more relevant. Overall, these parents could be the most promising (Tab. 2).
Specific combining ability (GCA)
For the SCA effects (Tab. 3), the diallel cross design identified manifestations of the genetic dominance (Gardner and Eberhart, 1966). For the NCB, hybrids 1×2, 1×5, 1×7, 5×10, 6×10, and 8×10 had positive and significant SCA effects (Tab. 3), as well as significant averages that ranged from 11.37 to12.29 branches/plant (Tab. 4). The number of productive plants was used for formative pruning to increase the production potential of the plants by identifying branches with high vigor and an adequate number of floral clusters and flowers per cluster.
Table 3. Effects of the specific combining ability (SCA) on five agronomically important lulo traits (S. quitoense) assessed in a diallel cross of 10 parents (45 combinations).
| Hybrids | DFO | NCB | PA | FW | Y |
|---|---|---|---|---|---|
| 1×2 | -1.21 | 1.00** | 0.03 | 5.72** | -0.55* |
| 1×3 | -3.45 | -0.83** | -2.47** | -3.25** | 0.70** |
| 1×4 | 0.19 | 0.01 | -0.62 | 1.73** | 0.61** |
| 1×5 | -1.16 | 1.10** | 2.21** | 1.80** | 2.31** |
| 1×6 | 5.55 | -1.64** | 0.21 | -5.47** | -0.94** |
| 1×7 | -1.98 | 1.48** | -0.93 | -4.51** | -0.13 |
| 1×8 | 1.52 | 0.25 | -1.15 | -4.15** | 0.11 |
| 1×9 | -0.10 | -0.67** | 1.39** | 7.51** | -0.45* |
| 1×10 | 0.65 | -0.72** | 1.34* | 0.62 | -1.66** |
| 2×3 | 2.79 | 0.17 | 0.89 | 5.76** | 0.69** |
| 2×4 | 0.72 | -0.07 | 0.11 | -3.12** | -0.88** |
| 2×5 | 3.29 | -0.35 | -0.62 | 5.95** | 2.84** |
| 2×6 | -3.84 | -0.30 | 0.10 | -6.60** | -0.60** |
| 2×7 | -6.45 | -1.39** | -0.36 | -8.61** | -1.28** |
| 2×8 | -0.54 | 0.62** | 1.66* | 6.34** | 1.16** |
| 2×9 | 0.76 | 0.29 | -1.15 | -9.27** | -1.98** |
| 2×10 | 4.47 | 0.03 | -0.66 | 3.84** | 0.58* |
| 3×4 | 3.52 | 0.59** | 0.09 | -1.77** | -2.54** |
| 3×5 | 1.51 | -0.56** | 0.41 | 0.39 | 2.22** |
| 3×6 | -2.75 | 0.41* | -0.49 | -4.15** | -1.44** |
| 3×7 | 2.73 | 0.27 | 2.36** | 22.73** | 2.96** |
| 3×8 | -2.32 | -0.21 | 0.60 | -5.99** | -1.26** |
| 3×9 | -4.15 | 0.29 | -1.62* | -6.93** | -0.42 |
| 3×10 | 2.14 | -0.13 | 0.24 | -6.78** | -0.90** |
| 4×5 | -1.68 | 0.44* | 0.23 | -5.45** | -1.76** |
| 4×6 | -3.73 | 0.62** | -0.63 | -4.46** | 0.20 |
| 4×7 | 3.58 | 0.24 | -0.22 | -0.48 | 1.78** |
| 4×8 | 1.32 | -1.62** | 1.65* | 5.96** | 0.23 |
| 4×9 | -0.13 | 0.17 | -1.03 | 0.33 | -0.20 |
| 4×10 | -3.80 | -0.38* | 0.40 | 7.26** | 2.56** |
| 5×6 | 8.09 | -1.12** | -0.36 | 24.70** | -1.63** |
| 5×7 | -1.48 | 0.46* | 0.14 | -5.33** | -3.38** |
| 5×8 | -0.90 | -0.78** | -2.48** | -12.02** | -0.77** |
| 5×9 | -2.15 | -0.82** | -0.50 | -4.96** | -0.58* |
| 5×10 | -5.52 | 1.63** | 0.97 | -5.07** | 0.75** |
| 6×7 | -4.53 | -0.16 | -0.67 | -10.71** | 0.28 |
| 6×8 | -4.37 | 0.32 | 0.41 | 7.09** | 3.51** |
| 6×9 | 3.81 | 0.90** | 1.05 | 7.63** | 2.88** |
| 6×10 | 1.77 | 0.97** | 0.38 | -8.03** | -2.25** |
| 7×8 | 2.82 | 0.73** | 0.15 | -0.73 | -0.76** |
| 7×9 | 3.70 | -0.02 | 0.59 | 2.47** | -0.36 |
| 7×10 | 1.62 | -1.62** | -1.06 | 5.18** | 0.89** |
| 8×9 | 1.03 | 0.16 | 1.02 | 1.87** | -0.57* |
| 8×10 | 1.44 | 0.52** | -1.85** | 1.63** | -1.65** |
| 9×10 | -2.76 | -0.31 | 0.25 | 1.35* | 1.67** |
DFO: Days to flowering onset; NCB: Number of clusters per branch; FW: Fruit weight; PA: Polar axis of the fruit, and Y: Yield. * and ** indicate significant and highly significant values, respectively.
Table 4. Mean values of the variables assessed in 45 lulo hybrid combinations (S. quitoense) from a diallel cross of 10 parents in four municipalities in the Department of Nariño.
| CROSS | DFO | NCB | FW | PA | Y |
|---|---|---|---|---|---|
| 1×2 | 141.79 | 11.42* | 95.24 | 53.24 | 18.94 |
| 1×3 | 137.21* | 9.71 | 92.26 | 50.07 | 20.28 |
| 1×4 | 138.38 | 9.92 | 99.72 | 52.56 | 21.72 |
| 1×5 | 138.04 | 11.92** | 97.59 | 56.45* | 22.99* |
| 1×6 | 149.67 | 8.83 | 95.78 | 54.76 | 19.99 |
| 1×7 | 142.25 | 11.96** | 94.29 | 54.20 | 20.34 |
| 1×8 | 136.83* | 11.25* | 91.59 | 52.40 | 21.64 |
| 1×9 | 140.75 | 9.83 | 103.19 | 55.51* | 20.15 |
| 1×10 | 140.33 | 10.38 | 95.07 | 55.45* | 18.47 |
| 2×3 | 148.00 | 9.88 | 98.28 | 52.70 | 19.72 |
| 2×4 | 143.46 | 9.00 | 91.87 | 52.55 | 19.70 |
| 2×5 | 147.04 | 9.63 | 98.75 | 52.89 | 22.98* |
| 2×6 | 144.83 | 9.33 | 91.66 | 53.91 | 19.80 |
| 2×7 | 142.33 | 8.25 | 87.19 | 54.03 | 18.66 |
| 2×8 | 139.33 | 10.79 | 99.08 | 54.48 | 22.16 |
| 2×9 | 146.17 | 9.96 | 83.42 | 52.24 | 18.08 |
| 2×10 | 148.71 | 10.29 | 95.29 | 52.72 | 20.17 |
| 3×4 | 143.92 | 9.79 | 99.20 | 51.87 | 18.12 |
| 3×5 | 142.92 | 9.54 | 99.17 | 53.25 | 22.45 |
| 3×6 | 143.58 | 10.17 | 100.08 | 52.66 | 19.04 |
| 3×7 | 149.17 | 10.04 | 124.51** | 56.09* | 22.98* |
| 3×8 | 135.21* | 10.08 | 92.73 | 52.76 | 19.83 |
| 3×9 | 138.92 | 10.08 | 91.73 | 51.11 | 19.72 |
| 3×10 | 144.04 | 10.26 | 90.65 | 52.96 | 18.78 |
| 4×5 | 137.25* | 9.92 | 95.81 | 53.71 | 20.01 |
| 4×6 | 140.13 | 9.75 | 102.26 | 53.16 | 22.22 |
| 4×7 | 147.54 | 9.38 | 103.78 | 54.14 | 23.34* |
| 4×8 | 136.38* | 8.04 | 107.16 | 54.44 | 22.86* |
| 4×9 | 140.46 | 9.33 | 101.48 | 52.33 | 21.48 |
| 4×10 | 135.63* | 9.37 | 107.17 | 53.75 | 23.78* |
| 5×6 | 152.96 | 8.92 | 129.23** | 54.49 | 19.96 |
| 5×7 | 143.50 | 10.50 | 96.74 | 55.57* | 17.75 |
| 5×8 | 135.17* | 9.79 | 86.99 | 51.37 | 21.42 |
| 5×9 | 139.46 | 9.25 | 94.00 | 53.93 | 20.67 |
| 5×10 | 134.92* | 12.29** | 92.65 | 55.38* | 21.54 |
| 6×7 | 145.38 | 9.54 | 96.82 | 55.06 | 21.66 |
| 6×8 | 136.63* | 10.54 | 111.55* | 54.57 | 25.96** |
| 6×9 | 150.33 | 10.63 | 112.05* | 55.78* | 24.39* |
| 6×10 | 147.13 | 11.29* | 95.15 | 55.10 | 18.79 |
| 7×8 | 143.92 | 10.96 | 101.28 | 54.90 | 21.22 |
| 7×9 | 150.33 | 9.71 | 104.43 | 55.90* | 20.68 |
| 7x10 | 147.08 | 8.71 | 105.90 | 54.24 | 21.47 |
| 8×9 | 138.75 | 10.42 | 100.76 | 54.76 | 21.54 |
| 8×10 | 138.00 | 11.37* | 99.29 | 51.88 | 19.99 |
| 9×10 | 139.33 | 10.04 | 98.96 | 54.54 | 22.37 |
| µ | 142.29 | 10.05 | 98.93 | 53.77 | 20.88 |
| σ | 4.77 | 0.92 | 8.49 | 1.43 | 1.79 |
| µ±σ | 137.52 | 10.97 | 107.42 | 55.21 | 22.68 |
| µ ±2σ | 132.76 | 11.89 | 115.90 | 56.64 | 24.47 |
DFO: Days to flowering onset; NCB: Number of clusters per branch; FW: Fruit weight; PA: Polar axis of the fruit, and Y: Yield. * and ** indicate significant and highly significant values, respectively.
The hybrid combinations 1×5, 1×9, 1×10, and 3×7 had positive and significant SCA effects on the PA (Tab. 3), with averages ranging from 55.45 m (1×10) to 56.45 m (1×5) (Tab. 4). These hybrids were within caliber 35 and 30 according to norm NTC5093 (Icontec, 2002).
Significant SCA effects on the FW were found in 88.9% of the hybrid combinations (Tab. 3). Furthermore, 37.7% of these combinations exceeded the average weight (100 g), which is desirable for fruit commercialization (Muñoz, 2010). The hybrid combinations 3×7, 5×6, 6×8, and 6×9 had highly significant SCA effects (22.73**, 24.70**, 7.09**, and 7.63**, respectively) and averages that ranged from 111.55 to 124.51 g (Tab. 4).
The hybrid combinations had fruits with average weights (Tab. 4) that were above those reported by Lagos et al. (2015) (i.e., average fruit weight of 81.46±16.36 g). These authors analyzed an initial population of 50 half-sibling lulo families to select those with improved fruit quality. The average weights in this study were also greater than the average weight of 97.29 g reported by Lagos-Santander et al. (2019), who assessed selected parents and hybrids based on performance characteristics. These authors, however, found weights up to 167 g in one hybrid and 148 g in a parent, demonstrating that FW interacts with the environment and its performance is associated with SCA effects that result from parental dominance, as reported here.
For the Y, significant SCA effects were found in 82% of the hybrid combinations, which demonstrated genetic dominance with respect to the parents. Combinations 1×2, 1×9, 5×9, and 8×9 had negative and significant effects, with below-average performance. Combinations 1×5, 2×5, 3×7, 4×7, 4×8, 4×10, 6×9, and 6×8 had positive values that reflected potential traits (Tab. 3).
Table 4 shows all the positive combinations with significant differences, including combination 6x8, which was highly significant. According to the biplot of the SCA effects on Y (Fig. 1), these significant combinations had performances above the SCA and the average yields of the other hybrid combinations (e.g., for 6×8, it was 25.96 t ha-1, as compared to 20.88 t ha-1). These results suggested that the parents of the best-performing crosses also had the best values for the SCA effects (parents 4, 6, and 8). When selecting for positive effects on desirable traits or negative effects to reduce undesirable traits, Guzmán et al. (2017) stated that a high GCA and SCA should be considered for the selection of parents or crosses.
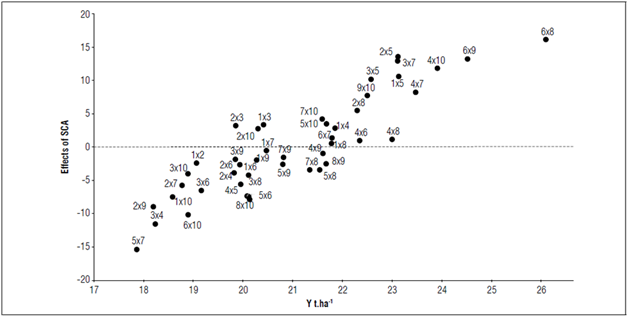
Figure 1. Biplot of the SCA effect on the yield of 45 lulo hybrid combinations (S. quitoense) from a diallel cross of 10 parents in four municipalities in the Department of Nariño.
The yield of all 45 hybrid combinations exceeded the average yield reported by Agronet (2020) for the Department of Nariño and Colombia in recent years (5.64 and 9.86 t ha-1, respectively). This finding must be analyzed considering commercial and experiment factors since, according to Sánchez et al. (2006), variations in plot size and shape and experiment units in an assay could generate results that differ from the normal performance of certain variables under commercial conditions. On the other hand, Beck et al. (1991) stated that, for yield, the dominant gene action is variable and can be influenced by the parents, environment, and their interaction. Lagos et al. (2015) reported yields ranging from 13.81 to 24.80 t ha-1 with plot sizes similar to those used here. Therefore, the results found in this study agree with previous reports and respond to the effect of the hybrid combinations assessed.
CONCLUSION
The effect of the locations on all assessed traits was variable. Furthermore, the interactions were significant for all cases, demonstrating that the genetic factors assessed here differentially responded to varying environmental conditions. The environment factor can affect the general selection of parents; therefore, local assessments are required to select adequate tools for improvement programs under specific environments.
Parents 4, 6, and 8 had desirable values for the GCA and positive values for the SCA regarding their hybrid combinations. Specifically, hybrid 6×8 had the best performance for the assessed hybrids. Moreover, combinations 4×7, 4×8, 4×10, and 6×9 had consistent performances in their environments, especially for the NCB and Y, indicating that these three parents are promising for the development of varieties and hybrids with potential production.

