


 Inglês (pdf)
 Artigo em XML
 Referências do artigo
 Enviar este artigo por email
 Citado por SciELO
  Citado por Google
  Similares em
SciELO
Similares em
SciELO  Similares em Google
 Permalink
Introduction
Holstein is the most common breed in Colombian dairy farms. It was introduced into Colombia during the late nineteenth and early twentieth century from Holland and North America. From its arrival, Holstein cattle were located in the high tropics, where climate is colder. Subsequently, animals and semen were imported mostly from Europe and North America. In Colombia, breeding programs are new and selection of sires is often done without appropriate selection criteria (ACHF, 2009), so it is difficult to predict its consequences.
Recent advances in molecular technology have reduced sequencing and high density genotyping costs in animals (Meuwissen and Goddard, 2010). This has made it possible to have large databases of single nucleotide polymorphisms (SNPs) of domestic animals, particularly in bovine cattle for which genomic selection is being implemented (Meuwissen et al., 2001).
Identifying regions with high local haplotype homozygosity in relation to the neutral scenario is a good strategy for identifying candidate genes subjected to natural or artificial selection (Qanbari et al., 2011). Taking into account that Holstein cattle has been selected for decades in many places around the world under different selection criteria and in accordance with the production and market conditions of each country involved, it is possible to use this approach to find regions associated with different traits of importance for milk yield. The search for these selection signatures has already been carried out in bovines (Druet et al., 2013; Ramey et al., 2013; Qanbari et al., 2014) regions associated with quantitative trait loci (QTL; Hayes et al., 2008).
To detect selection signatures, Sabeti et al. (2002) developed an estimator called extended haplotype homozygosity (EHH) to search for genetic footprints of positive selection in humans. The EHH is the probability that two randomly chosen chromosomes carry the same allele in a focal SNP and are identical by descent in the markers surrounding them. Voigth et al. (2006) developed an empirical test based on the integral of the observed decay of EHH, which was defined as iHH. After this, the test was complemented to define the iHS test as a log-ratio of iHH calculated in the derived and ancestral focal alleles. The approach suggested by Voight et al. (2006) involves comparing the linkage disequilibrium (LD) around a selected allele in relation to an unselected allele which acts as a control to the LD expected in the region. The proposed measure is known as standardized extended haplotype homozygosity (iHS).
Practically speaking, the integrated haplotype score (iHS), which is based on the extended haplotype homozygosity (EHH), makes it possible to detect selective pressure by identifying the regions of the genome where local LD increases. Observing the LD as a function of the distance may reflect the history of the population during distant generations or during more recent generations (with larger haplotypes). This, in turn, can be used to find selection signatures, since selected alleles increase in frequency in the population of a specific chromosome segment around it.
Therefore, the objective of this study was to identify signatures of recent selection in Holstein cattle from the province of Antioquia (Colombian high tropic) through the iHS methodology using the BovineLD genotyping chip. This can contribute to identify regions of the genome that were subjected to specific selection pressure according to the conditions of the population. Each signature can be associated to a QTL and this information can be used as relevant biological information to be included in the genomic selection program in Holstein cattle in Colombia.
Materials and methods
Ethical considerations
All experimental procedures were approved by the Institutional Committee for care and use of animals of Universidad Nacional de Colombia (Medellin city, Colombia; Act No 03, CEMED 015, 2012).
Genotype data and DNA extraction
This study was conducted with Holstein animals in the high tropics of the Province of Antioquia (Colombia). The animals are part of the genetic improvement program of Universidad Nacional de Colombia at Medellín city, and Colanta company (Cooperativa Lechera de Antioquia). Semen or blood samples were obtained from 150 animals (37 bulls and 113 cows with at least one calving). This was done following the protocols established by the genetic improvement program while avoiding practices considered as animal abuse. The specific animal husbandry, feeding and health conditions varied from herd to herd. This was also true for their topography and geographical location. The animals were selected from 35 dairy herds in 12 municipalities in the high tropics of Antioquia. The elevations at these locations ranged between 2,000 and 2,600 m.a.s.l, with average temperature between 13 and 17 ºC and precipitation between 2,000 and 4,000 mm, annually. All animals were kept on grazing and supplemented with balanced commercial feed. Animal selection included as many bulls as possible that had daughters in the population (nine local and 28 foreigners) and sperm in the market, since these sires have many of the haplotypes found in the population, which renders them highly informative.
Blood samples were taken from the middle coccygeal vein using needles (18-gauge) with 5-mL BD Vacutainer® tubes containing EDTA as anticoagulant (BD Diagnostics, Franklin lakes, NJ, USA) and then stored at 4 °C until processed. Bull DNA was obtained from semen, which was extracted and stored in 250 and 400 µL straws.
The DNA was extracted according to the manufacturer’s recommendations using two commercial kits, namely DNeasy Blood & Tissue Kit® for blood and QIAamp® DNA Mini Kit Protocol 1 for semen (Qiagen Inc, Valencia, CA, USA). Genotyping was performed using the BeadChip Bovine LD® (Illumina Inc., San Diego, CA, USA) chip, which has a total of 6,909 SNPs with an average distance of 383 kb (Illumina, 2013). Results were edited using R (R Development Core Team, 2012) and PLINK v1.07 programs (Purcell et al., 2007); only autosomal markers were kept. Lost data test were considered below 0.1% and the SNPs with a minor allele frequency (MAF) below 0.05 were discarded. Likewise, genotypes with Mendelian errors greater than 0.05 were also discarded. Each of the alleles was coded as 1 (ancestral allele) or 2 (derived allele), and a map file was built taking into account the reference kept in the bovineLD chip from illumine (Illumina Inc., San Diego, CA, USA). Only the haplotypes that could be mapped to the UMD 3.1 bovine genome assembly were taken into account.
Haplotype reconstruction and linkage analysis
The lowest possible kinship among groups was taken into account when selecting parents. However, there were a few couples and triplets (father-mother- daughter) in some cases. After the edition process, haplotypes were reconstructed for each chromosome individually and unrelated animals were taken into account. This was done using the Beagle 3.3 software (Browning and Browning, 2009). The reconstruction of the haplotypes was used for later analyses. Linkage analysis was performed in parallel with the program Haploview v4.1 (Barrett et al., 2005) to estimate linkage disequilibrium via the r2 statistic.
EHH and iHS estimation
The evidence of positive or negative selection was obtained using the iHS test, based on haplotype frequencies, as described by Voigh et al. (2006). The iHS measures the expansion of the local LD, taking into account the haplotype centered on an SNP that carries the ancestral allele with respect to the haplotype that carries the derived allele. This statistic is applied to each SNP individually (as the center of the haplotype), thus it is necessary to calculate the integral of the decay of EHH for the ancestral (iHH A ) and derived (iHH D ) alleles. The iHS is standardized in such a way that its mean is 0 and its variance 1. This is achieved with the following equation:
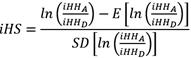
Where:
iHS: Is the measure of the extension of the linkage.
 Is the measure of the unstandardized iHS based on a specific SNP.
 Is iHS expectancy.
 Is the standard deviation of the iHS.
The highest positive or negative values correspond to unusually large haplotypes carrying the ancestral or derived allele, respectively. The iHS scores of the SNPs were transformed in:

Where:
Φ(iHS): Is the distribution of the Gaussian cumulative distribution. If we assume that the iHS data is normally distributed (under neutrality), may be interpreted as, where P is the p-value associated with two queues for the neutral hypothesis in which there is no selection. The ratio of values for iHS>4 was plotted while taking into account the 15 markers around each focal SNP.
The estimation of the EHH and iHS was performed using R’s “rehh” package (Gautier and Vitalis, 2012), which uses a function to detect selection signatures in dense marker data using the test based on extended haplotype homozygosity (EHH) that we discussed above. The software package makes it possible to estimate the statistics and create plots to visualize and interpret results.
Identification and annotation of candidate regions
In order to identify and annotate the candidate regions, the SNPs with the greatest effect, >4 (p<0.00001) were mapped. For nearby SNPs, the LD between contiguous markers was determined. Likewise, annotation was performed while making sure that the windows associated to the QTLs do not overlap. The most important SNPs were annotated based on the UMD 3.1 assembly (Bos taurus) from NCBI and ENSEMBL using the Variant Effect Predictor tool (VEP; McLaren et al., 2010) a web-based tool (the SNP Effect Predictor). Gene groupings and figures were made in accordance with the information from the ENSEMBL, based on the UMD 3.1 construction of VEP (McLaren et al., 2010) a web-based tool (the SNP Effect Predictor). An ontology from the Gene Ontology Consortium was used together with previous reports of QTLs from the Animal QTLdb public database, specifically those in the cattleQTLdb (Hu et al., 2013). Candidate region search and identification was performed with 1-Mb genome windows whose focal SNP was at the center (0.5 Mb for each side) of the window.
Results
After the editing phase, a total of 6,677 SNPs were available. These SNPs had a higher ratio of alleles with intermediate frequencies; this is typical of the genotyping chips that search for segregating markers in different breeds. Most SNPs corresponded to alleles in intergenic regions (57%), intronic regions (30%), upstream or downstream of the gene (9.4%). Only a very small percentage (~2%) was found in coding regions, although most instances of this corresponded to synonym variants. Only 15 markers were discarded because they could not be mapped to the UMD 3.1 bovine genome assembly. As a result of this, the last database had 6,662 markers available for use in the remaining assessments. SNPs were found evenly distributed across the entire genome, with the highest number in the large chromosomes and the lowest in the small chromosomes. This made it possible to adequately build a linkage map. After data edition, the SNPs frequencies were biased towards intermediate allele frequencies.
When the threshold for an absolute value of p>2 (p<0.001), a total of 144 SNPs were significant. However, when the threshold was set to 3 (p<0.0001), only 37 markers overcame it (Figure 1). For a threshold of 4 (p<0.00001), 10 markers were significant. Finally, only 5 markers were above a significance threshold of 5 (p<0.000001). This study shows the results obtained with markers beyond a threshold of 3 (p<0.0001); however, only markers with higher values were mapped and annotated.
Figure 2 shows the descriptive analysis of the SNPs with stronger signatures of selection. These SNPs were obtained with a threshold of 3, thus most of them correspond to intergenic regions. In spite of this, an interesting number of variants was found inside the genes or in regulating regions, although not specifically in coding regions (Figure 2A). When the threshold was set to 4, ten markers overcame this limit, half of them were found in intronic regions (50%). One case was reported in upstream variants (10%) and 4 variants were intergenic (40%). This shows a small change in favour of variants located inside genes or related to them. Nevertheless, no visible biological effects were observed.
It is worth mentioning that selection signatures did not appear randomly among the various chromosomes. On the contrary, some showed a more visible selection footprint, with a greater number of markers involved at the peaks. Three of the chromosomes stand out, namely chromosomes 8, 6, and 20, as they have 7, 5, and 5 of the 37 most important variants, respectively (Figure 2B).
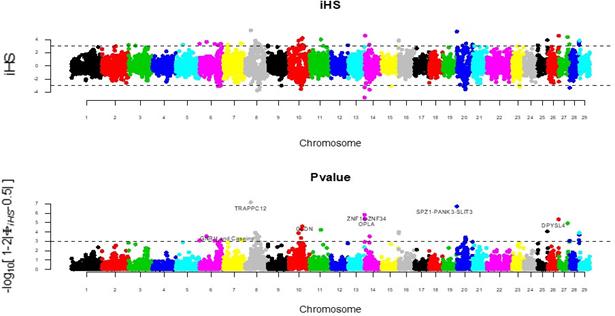
Figure 1 Plot of the iHS magnitude by chromosome and associated p-value. The dotted line represents the threshold of significance (p<0.0001).

Figure 2 Types of variants (A) and chromosome (B) in which the significant variants (p<0.0001) for signatures of positive selection can be found. Bta: Bos Taurus Chromosome.
The most important chromosomes in terms of significant signatures are shown in Figure 3, where it is possible to see how far apart the various peaks are. For this reason, the LD between the various focal markers was low in most cases (LD<0.1), which hints at possible effects of different QTLs inside the same chromosome. In some cases, the SNPs found around the focal SNP had an important signal that could correspond to the same selected QTL. It is worth noting that some chromosomes had strong selection signatures (such as Bta 26 and 27). However, since only one signal was observed in the chromosome, they do not appear in an extended way, which does not mean that they are not important on different principal traits for dairy yield.

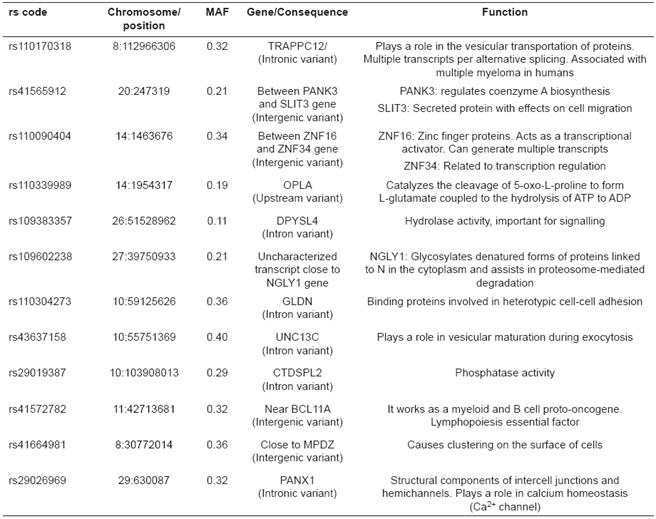
Table 1 shows the description of the focal SNPs with the strongest selection signatures (p ≥ 4). In most cases the SNPs were found inside genes or regulating regions, which suggest a possible effect of the gene on the traits associated with milk yield. Some SNPs were found in intergenic regions, but close to genes that are physiologically important for milk yield. The most important variants had minor allele frequencies ranging from 0.11 to 0.40. However, when including the significant variants with p<0.0001, the lowest MAF frequency was 0.087, and the highest was 0.497.
The marker with the strongest selection signature was found in an intron of the TRAPPC12 gene, which is close to some additional genes that are highly important for the immune response of mammals (Table 1). The second highest threshold corresponded to a marker located in an intergenic region composed of a SPZ1-PANK3-SLIT3 group.
Table 1 Description of the polymorphisms with stronger signatures of recent selection and their location in the UMD 3.1 bovine genome assembly.
It is interesting to note that chromosome 6 had a significant peak (Figure 1; p<0.0001), which was not the largest but still corresponded to an SNP (rs110527224) that is very close to the casein genes (CSN1S1, CSN2, CSN1S2, CSN3) and to the GnRH gene. Moreover, the two most important peaks in chromosome 14 were in positions close to and surrounding the DGAT1 gene.
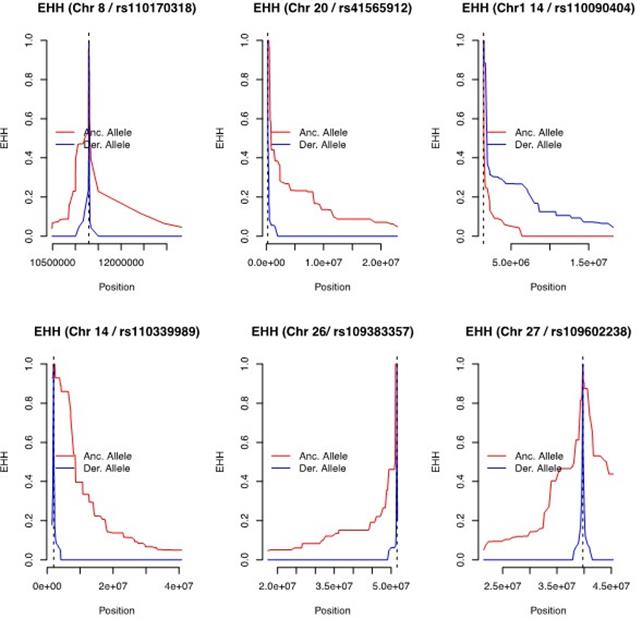
Figure 4 shows the EHH decay for the 6 focal markers related to the strongest signatures of selection. Significant differences between the ancestral and derived scenarios can be observed. It is worth noting that some of the focal markers are located at the start of the chromosome, therefore some of the EHH decay graphs are shortened.
In most of the cases shown in Figure 4, the haplotypes in the ancestral allele were larger than what was found in the derived allele. However, in one case (rs110339898), the haplotype of the derived allele was larger than its ancestral counterpart, which suggests stronger selection pressure in this allele.
Discussion
The greatest number of focal variants with strong selection signatures (p<0.0001) showed minor allele frequencies ranging from 0.087 to 0.497, with a mean near to 0.347. For this reason, it is clear that almost all focal markers, as well as the associated haplotype are segregating and have intermediate frequencies (Table 1). The marker with the lowest MAF values was SNP rs43497903, which is located inside an intron of gene AFAP1, which, according to the UMD 3.1 bovine genome assembly, is related to actin and phospholipid binding (McLaren et al., 2010).
It is worth noting that the BovineLD chip contains many SNPs that are segregating in the Holstein population. Even the focal markers subjected to selection pressure show medium allele frequencies, which makes it possible to exert some form of selection on the detected variants. We must clarify that the iHS is better at detecting selection when the alleles have intermediate frequencies. However, for the cases where allele frequency is very high, methodologies have been proposed which use more than one population. Such is the case of the methodologies using the Rsb statistic to increase detection power (Gautier and Vitalis, 2012). The power of the iHS also depends on other additional factors including SNP density, SNP selection bias, demographic history, availability of information in the haplotype phase, and selection intensity (Fay and Wu, 2000; Voight et al., 2006; Hayes et al., 2008). In addition, Hayes et al. (2008) reported a decrease in power under simulation scenarios when the selection pressure was too strong and there were many alleles of the haplotype near the fixation point. However, this was not the case in this study where most of the allele frequencies were intermediate.
As for genotyping density, it is necessary to take into account the effective number of the Holstein cattle population, which favours the presence of large haplotypes (Daetwyler et al., 2014). This in turn makes it possible to detect recent selection signatures in Holstein cattle even with the BovineLD chip, which has 6,909 markers with a spacing of 383 kb (Illumina, 2013). In this regard, Hayes et al. (2008) found significant linkage in chromosome 6 when using a relatively low marker density. According to Hayes et al. ( 2008), when the iHS values exceed the threshold of significance, the length of the population’s haplotypes can be detected at up to 1 Mb of distance from the site where the selection on a QTL has increased the frequency of the favorable allele. In fact, even the homozygosity around the selected site can stretch beyond that value, reaching up to 40 Mb, as reported in a study conducted on canines (Pollinger et al., 2005). Considering this, and the fact that the effective size of the Holstein population is small (Pérez-Enciso, 2014) it is possible to build a linkage map even with a panel of markers that is not as dense as that of this study. Moreover, a study conducted by Hayes et al. (2008) used 403 SNPs inside chromosome 6, a density similar to some chromosomes in our study.
Linkage disequilibrium to find selection signatures is an interesting method that has been used successfully (Voight et al., 2006; Hayes et al., 2008). However, it is necessary to keep in mind that the LD in large intervals can be caused by a number of factors that are not necessarily related to the selection process (Hill, 1981). Nevertheless, tests utilizing iHS have been effectively used to detect recent selection signatures, both in humans (Voight et al., 2006) and in bovine cattle of different breeds (Hayes et al., 2008; Qanbari et al., 2014, 2011; Snelling et al., 2007). The identification of genome regions that have been under selection pressure may be used to find regions associated with QTLs which could later enrich genetic assessment programs through the use of a priori information (Pérez-Enciso et al., 2015).
It is worth mentioning that Holstein selection in Colombia has focused on the search for high milk yield with animals grazing on the mountains. Nevertheless, efforts have recently been directed to improve the amount of protein and fat in milk, thus disregarding other traits that have an economically important effect on milk yield. The strong selection signatures obtained in this study were associated with regions that have been reported (Table 2) to have QTLs particularly related to milk, fat and protein yield, which is consistent with the stated selection aims. Some QTLs were also associated to other traits, such as reproduction, growth and size, which usually have some form of inverse association with the most relevant milk yield traits. Even height has been reported as a trait strongly influenced by domestication (Karim et al., 2011) and has undergone strong selection pressure (Fortes et al., 2013).
Table 2 Polymorphisms with the strongest signature of recent selection and the previous reports of mapped QTLs from the cattle QTLdb (Hu et al., 2013).

Table 2 shows previous reports of QTLs located in the confidence interval to the focal SNP identified in this study. The description of the focal markers with the strongest signatures of selection as well as the identification of the QTLs associated with that interval were conducted in accordance with the report stored in the Animal QTLdb public database, section cattleQTLdb (Hu et al., 2013). It is worth noting that almost all regions reported as candidates were associated with the confidence interval for a previously reported QTL. Most of these QTLs were related to reproductive traits such as milk yield, fat and protein content, although the confidence interval was often large. Interestingly, two regions were also recently reported by Iso-Touru et al. (2016) in Holstein cattle (Table 2). The markers present in the same chromosome were often associated with different QTLs, suggesting that those QTLs do not overlap. Additionally, the linkage disequilibrium between focal markers was low in those cases (r2<0.1).
The selection signatures presented in this paper were not evenly distributed throughout all the autosomes of the bovine genome. On the contrary, some chromosomes had higher selection pressure (Figure 2), which means that an important group of QTLs could be inside the same chromosome and not randomly distributed across the bovine genome. Some studies on dairy cattle have found similar distributions (Qanbari et al., 2011; Ramey et al., 2013). They have even shown variations between different breeds as a result of differential selection (Qanbari et al., 2014).
Interestingly, some studies have reported selection signatures inside chromosome 6 in dairy bovines (Hayes et al., 2008; Qanbari et al., 2014). In this study, some significant peaks were found in chromosome 6. There was even an interesting signature corresponding to an SNP (rs110527224) that was very close to the casein group (CSN1S1, CSN2, CSN1S2, CSN3). The signature was also near the GnRH gene, which could have been subjected to strong selection pressure. However, the most important selection regions did not occur in this chromosome, and those which appeared did not necessarily match those reported by the previously mentioned studies (Hayes et al., 2008; Qanbari et al., 2014) possibly because the causal mutation has not yet been found, which raises the need for fine mapping studies in the QTL region.
It is interesting to clarify that the DGAT1 gene in bovine cattle has been repeatedly proposed as a major gene for milk fat (Grisart et al., 2002; Winter et al., 2002; Kühn et al., 2004; Wang et al., 2012), yet this study did not find any selection peak in the region occupied by the gene. Furthermore, according to the NCBI’s bovine genome assembly -UMD 3.1-, the gene is located at chromosome 14 between positions 1,795,425-1,804,838b, at the beginning of the chromosome, in the centromeric region (Brown et al., 2015), near the area where we found the largest selection peak for chromosome 14 (Figure 3). It is important to note that, in spite of the fact that the chip has a variant inside the gene, no direct selection signature was found. However, the two most important variants were found at positions 1,463,676b and 1,954,317b, which surround the location of the gene and may be associated with regulating sequences, promoters or enhancers. In spite of this, the absence of a selection signature directly on the gene is not evidence of the absence of a QTL in the region; on the contrary, this study reaffirms the notion that this is a region of great importance where there could be QTLs related to milk fat. Thus, detailed, fine mapping studies should be conducted to attempt reducing the confidence interval for the QTL in order to find possible causal mutations or map the QTLs of the region in a more precise manner.
It is worth noting that the regions of the genome associated with traits of importance for milk yield identified by recent selection signatures are typical of the assessed population or of very close populations which have a very similar demographic history as well as genetic improvement and selection systems with similar criteria and objectives. For this reason, it is possible that studies on positive or negative selection made in different regions of the world could yield different results depending on the criteria, aims, time, demographic history and selection intensity of the genetic improvement programs for the assessed breed (Stella et al., 2010; Utsunomiya et al., 2013).
Finally, it is worth mentioning that, despite having various mapping approaches for over a decade, it is still difficult to find historical selection events on complex traits (Kemper et al., 2014) and different results may be obtained depending on the methodology applied (Qanbari et al., 2011). However, the combination of different tests might improve the ability to localize the candidate regions under selection (Utsunomiya et al., 2013), which is very important considering the relevance of QTN detection and knowledge of the genetic architecture of the traits of importance for milk yield to be used in genetic improvement and genomic selection programs (Pérez-Enciso et al., 2015). The objective of all this is the possibility of using methods that use causal variants such as “genome editing” in genomic selection in the near future. To achieve this, it would be advisable to use denser platforms or sequence data, including slightly more powerful approaches.

