Introduction
Romosinuano, a Creole breed developed in Colombia, is based on cattle that arrived from the Iberian Peninsula five centuries ago. According to De Alba (2011), Romosinuano germplasm entered into México as semen. Semen from Colombia was first exported to North Carolina, USA, in the middle of the 20th century. Then, semen was exported to Venezuela in 1982. A research herd was founded in Turrialba, Costa Rica, in 1955 using sires and heifers imported from North Caroline. Subsequently Romosinuano embryos were imported by Florida State University, from Venezuela. The Mexican herd was developed from germplasm of Turrialba, and later from genetics of Florida State University.
Several breeders in the Mexican tropics have used Romosinuano due to ease of management, longevity (Carroll et al., 2011; 2012), fertility (Riley et al., 2007), tolerance to heat, humidity (Scharf et al., 2010), and to the toxic effects of endophytes commonly present in tall fescue (Riley et al., 2016). The Asociación Mexicana de Criadores de Ganado Romosinuano y Lechero Tropical (AMCROLET) was established in 1998 (De Alba, 2011), and it is responsible for the herd-book and the performance records. Recently, the first Romosinuano genetic evaluation in Mexico was carried out (AMCROLET, 2016), which would allow breeders to identify superior breeding stock for genetic improvement. However, the selection of breeding stock may result in a smaller population size and in higher inbreeding (Bernardes et al., 2016). This is even more important considering that the Mexican herd of Romosinuano is relatively isolated due to sanitary restrictions that would not allow import genetic material directly from Colombia (SAGARPA, 2017).
The main goal of conservation programs is to control the effects of genetic drift in order to maintain the genetic variability of the population and to keep a low rate of inbreeding (Jamieson and Allendorf et al., 2012; Hammerly et al., 2013; Toro et al., 2014). Genetic variability works simmilar to an ´insurance´ for the population to face potential environmental and marketing changes; at the same time, it reduces the unfavorable effects on performance due to inbreeding (Burrow et al., 1993; Santana et al., 2012). The studies on genetic variability of populations have been conducted using pedigree analysis or genetic markers. Pedigree information provides a useful tool for conservation programs to maintain genetic variability and minimize inbreeding (Pinheiro et al., 2013; Santana et al., 2016; Sheikhlou and Abbasi et al., 2016).
Considering the potential of Romosinuano cattle to improve beef production under tropical conditions, the availability of predicted breeding values, and the fact that it is a breed with a small population size and relatively isolated, it is imperative to characterize the structure of this population and evaluate changes in its genetic variability. Therefore, the objective of this study was to assess the evolution of the structure and genetic diversity of Romosinuano breed in Mexico through pedigree analysis.
Materials and methods
Description of the data
Pedigree data (identification of animal, sire and dam, sex, birth date and herd) was obtained from AMCROLET. The database included 4,809 animals born between 1953 and 2017, belong ing to 39 herds located mainly in the Southeast region of Mexico.
Given that the Romosinuano population has been developing from upgrading, pedigree analyses were performed for two datasets: one that includes upgrading from F1 animals (UP; n = 3,432) and the other with only straightbred cattle (SP; n = 1,518); thus, SP is included in UP. For both datasets, three reference populations were defined: 1998-2003 (RP1), 2004-2009 (RP2), and 2010-2017 (RP3) to describe the time-trend of pedigree parameters for approximately three generation intervals after AMCROLET was created.
Pedigree analyses
The analyses of genealogical informa tion were carried out using ENDOG ver sion 4.8 (Gutiérrez and Goyache, 2005).
Demographic parameters
Generation interval (GI). The GI (average age of the parents when their replacements were born) was obtained for the four gametic paths (sire-son, sire-daughter, dam-son, dam-daughter).
Pedigree completeness level. To evaluate the level of integrity of the pedigree, the number of complete (CG), maximum (MG) and equivalent (EG) generations were calculated. The CG implies that the 2n ancestors of an animal are known, where n is the number of fully traced generations, whereas MG counts the number of generations that separate the animal from the oldest ancestor (Gutiérrez y Goyache et al., 2005). For a given animal, EG was calculated as the sum of (1/2)n coefficients of all known ancestors, where n is the number of generations separating the individual to each known ancestor (Maignel et al., 1996). The percentage of known ancestors during the last three generations was calculated, a period that encompasses the time from AMCROLET formation. Finally, the pedigree completeness index (PCI; MacCluer et al., 1983) was generated for each generation.
Gene flow among herds. The role of each herd was evaluated according to the contribution of the sires to the population (Vassallo et al., 1986). Herds were grouped as: a) nucleus, if breeders only use their own sires, which may also be sent to other herds; b) multiplier, when breeders use sires from other herds and provide them to other herds; c) commercial, if breeders use sires from other herds, but do not deliver sires; and d) isolated, when breeders only use own sires and do not provide them to other herds.
Genetic parameters
Inbreeding (F) and average relatedness coefficients (AR). The F was calculated using the algorithm of Meuwissen and Luo et al.(1992), assuming unrelated and noninbred founders. For each animal, AR was defined as the probability that an allele randomly chosen in the population belongs to a particular animal (Gutiérrez and Goyache et al., 2005). The AR for a particular animal is equivalent to the average of the coefficients in the row of the numerator relationship matrix.
Effective population size (Ne). The Ne was estimated using two methods. The first was based on the individual increase in inbreeding (ΔFi) and was computed as follows (Gutiérrez et al., 2009):
where, t is the number of equivalent generations. The Ne was calculated from the average of the inbreeding rate of the n animals included, as .
The second method was based on increases in coancestry (Δcjk) between any pair of individuals j and k (Cervantes et al., 2011), as:
where, cjk is the inbreeding of a progeny from j and k, and gj and gk are the discrete equivalent generation for the parents. Then, Ne was estimated by averaging the rate of coancestry (Nec) for all pairs of the individuals as.
Probability of gene origin. To assess the amount and kind of genetic diversity losses in the populations, the number of founders (f), effective number of founders (fe), effective number of ancestors (fa), and founder genome equivalents (fg) were obtained. The fe counts founders with unknown genetic relationships with other animals in the pedigree, except to its descendant (Lacy, 1989). Preservation of genetic diversity of founders toward the studied population may be evaluated by its contributions, that must add up to one (Boichard et al., 1997).
The fe is the number of equally contributing founders that would be expected to produce the same amount of genetic diversity as observed in the population under study (Lacy, 1989), and was calculated as:
where, pk is the probability of gene origin of founder k to the reference population. The fa is the minimum number of ancestors (founders or not) needed to explain the full genetic diversity of the population (Boichard et al., 1997), and it was obtained as:
where, pi is the marginal contribution of the ith ancestor (genetic contribution not yet explained by other ancestor chosen before), and a is the number of influential ancestors (i.e. ancestors with non-zero marginal contributions). Additionally, based on the marginal contributions, the number of ancestors explaining 50% of the genes in the population and the contribution of the main ancestor were obtained.
The fg was calculated as the inverse of twice the average coancestry of individuals in the predefined reference population. This parameter accounts for all causes of loss of genetic diversity in the population (Caballero and Toro et al., 2000).
The effective number of non-founders (fn) accounts only for the genetic drift effects in non-founder generations (Caballero and Toro et al., 2000):
Thus, the fg has two components, fe that accounts for the contributions of founders to the actual population, and fn which accounts for the contribution of non-founders, and is accumulated over generations. Based on these parameters, the genetic diversity (GD) in the reference population relative to the base population was obtained as (Lacy, 1989, 1995):
Therefore, 1 - GD represents the loss of genetic diversity in the population since the founder generation. The loss of genetic diversity because of unequal contributions of founders was estimated as 1 - GD*, where (Caballero and Toro et al., 2000):
Finally, the difference between GD and GD* accounts for the loss of genetic diversity due to genetic drift accumulated over the non-founder generations (Caballero and Toro, 2000), and it can be expressed as the inverse of twice the number of non-founders (Lacy, 1995).
Results
Demographic parametersTable 6
For the UP, average GI was similar from RP1 to RP3 (6.51 to 6.54 yr); however, for the SP these values tended to decrease from 7.16 in RP1 to 6.57 yr in RP3 (Table 1). Among parent-offspring pathways, the GI for path sire-son were larger and tended to decrease from RP1 to RP3 in both the UP and the SP, and were half to one year longer for the SP than the UP.
Table 1 Generation intervals (yr) for the upgraded and straightbred Romosinuano and their respective reference populations (RP1, RP2, and RP3).

Generation intervals = average age of the parents when their replacements are born; RP1 = 1998-2003; RP2 = 2004-2009; RP3 = 2010-2017.
Table 2 Number of maximum (MG), complete (CG) and equivalent (EG) generations traced for the upgraded and straightbred Romosinuano and their respective reference populations (RP1, RP2, and RP3).

RP1 = 1998-2003; RP2 = 2004-2009; RP3 = 2010-2017.
The level of completeness of the UP and the SP pedigrees improved from RP1 to RP3 more than 69, 43 and 63% for MG, CG and EG, respectively, after herd-book recording started (Table 2).
The EG reached 3.43 and 3.34 yr for the UP and the SP in RP3. The percentage of known ancestors improved during the recent 20 yr and for the UP averaged 76, 73 and 66% for the generations of parents, grandparents and great-grandparents, respectively, and those values for the SP were 93, 85 and 65% (Table 3); thus, the improvement was higher for the SP.
Table 3 Percentage of known ancestors by generation for the upgraded and straightbred Romosinuano and their respective reference populations (RP1, RP2, and RP3).

RP1 = 1998-2003; RP2 = 2004-2009; RP3 = 2010-2017.
Considering various generations, there was a steady improvement of the PCI during the recent 20 yr (Figure 1). Including three generations back, the PCI of RP3 were similar, 65.3 and 65.2% for the UP and the SP, but it increased to 75.4 and 93.1%, respectively, when only one generation was considered.
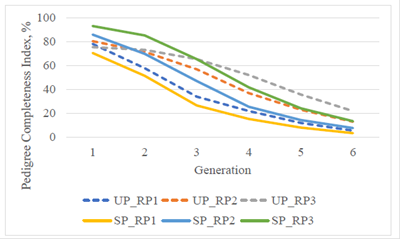
Figure 1 Pedigree completeness index for the upgraded (UP) and straightbred (SP) Romosinuano and their respective reference populations (RP1, 1998-2003; RP2, 2004-2009; and RP3, 2010-2017) for generations 1 to 6.
Mostly multiplier herds were found in this Romosinuano population (67 and 77% in the UP and the SP, respectively). Commercial herds in the UP were about twice as many as those in the SP, while no nucleus was found (Table 4).
Table 4 Classification of herds according to the origin and use of sires for the upgraded (UP) and straightbred (SP) Romosinuano populations.
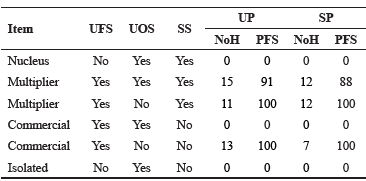
UFS = use foreign sires; UOS = use own sires; SS= sell sires; NoH = number of herds; PFS = percent of foreign sires.
As previously indicated, development of Mexican Romosinuano population was based mainly on germplasm importation from a herd in Turrialba, Costa Rica (herd 75), which is depicted in Figure 2. Regarding the UP, some herds (e.g. herd 12) included a large number of dams in upgrading to Romosinuano. In the SP, the genetic representation of herd 75 is declining, whereas that of Mexican herds are increasing (e.g. herd 40; 9.7 to 23.5% from RP1 to RP3, respectively).
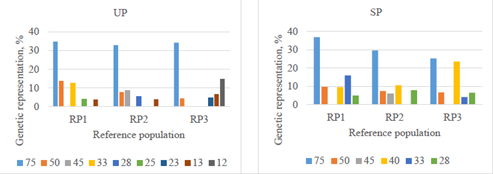
Figure 2 Main founder herds genetically represented (%) in RP1 (1998-2003), RP2 (2004-2009), and RP3 (2010-2017) in upgraded (UP) and straightbred (SP) Romosinuano populations.
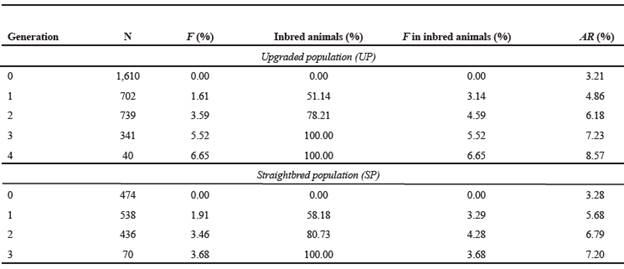
Generally, all inbreeding statistics increased from RP1 to RP3 (Table 5). Considering RP3, all inbreeding statistics were higher in the SP than the UP, except for the percentage of aver age inbreeding in inbred animals.
Table 5 Inbreeding statistics (%) for upgraded and straightbred Romosinuano and their respective reference population (RP1, RP2, and RP3).

RP1 = 1998-2003; RP2 = 2004-2009; RP3 = 2010-2017; IA = inbred animals; AR = average relatedness; IP = average inbreeding in the population; IF = average inbreeding in inbred animals.
Table 6 Average inbreeding coefficients (F), inbred animals and relatedness coefficients (AR) for upgraded and straightbred Romosinuano populations, by complete generations.
Even when both Ne and Nec were larger for the UP than the SP, for Ne there was a reduction of these sizes in RP2 and a subsequent increase to reach sizes of 79 and 48 in RP3 (Table 7).
Estimates of Nec were smaller than Ne and increased over the recent 20 yr for the UP and the SP, reaching in RP3 57 and 45, respectively
Table 7 Realized effective population size (Ne) and effective population size from an increase in coancestry (Nec) for the upgraded and straightbred Romosinuano and their respective reference populations (RP1, RP2, and RP3).

RP1 = 1998-2003; RP2 = 2004-2009; RP3 = 2010-2017.
The parameters describing the probabilities of gene origin for the UP and the SP and their respective reference populations (RP1, RP2, and RP3) are shown in Table 8. The f in the UP were larger than in the SP and increased from RP1 (273) to RP3 (827). Although fe remained approximately constant across reference populations the ratio fe/f for the UP decreased from RP1 (22.0%) to RP3 (7.4%) whereas those ratios for the SP were larger and varied from 20.3 to 32.2%. During the last 20 years, fa in the SP decreased 16.7% from RP1 to RP3 and fg had a reduction of 17.6 and 30.1% for the UP and the SP, respectively. The fa represented about 50% of the fe. The fg represented 27 and 33% of fe for the UP and the SP, respectively. From RP1 to RP3 there was a reduction of the proportion of founder genomes that have been retained in the reference populations (fg/f), from 7.3 to 2.0% in the UP and from 10.6 to 7.4% in the SP.
Table 8 Probability of gene origin parameters for the upgraded and straightbred Romosinuano and their respective reference populations (RP1, RP2, and RP3).

RP1 = 1998-2003; RP2 = 2004-2009; RP3 = 2010-2017; f = number of founders; fe = effective number of founders; fa = effective number of ancestors; fg = equivalent number of founder genomes; Cmax = contribution of the main ancestor; N50= number of ancestors explaining 50% of the gene pool.
Total losses of genetic variability from RP1 to RP3 increased from 2.5 to 3.0% in the UP and from 2.6 to 3.7% in the SP (Figure 3).
More than 66% of the losses on genetic diversity were accounted for genetic drift, except for RP3 in the SP (44%).
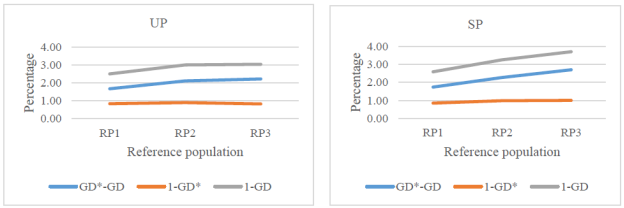
Figure 3 Losses (%) of genetic diversity due to genetic drift (GD*-GD), unequal founder contribution (1-GD*), and both reasons (1-GD) since the founder generation in upgraded (UP) and straightbred (SP) Romosinuano reference populations (RP1, 1998-2003; RP2, 2004-2009; and RP3, 2010-2017).
The main ancestor contributed 8.6 to 11.0, and 9.8 to 10.3% of the genes in the UP and the SP, respectively. The numbers of ancestors that explained half of the genetic variability of the populations ranged from 10 to 12 in the UP, and 9 to 11 in the SP, with a decreasing trend from RP1 to RP3.
Discussion
The average GI observed in the present study for the different reference populations (6.41 to 6.54 yr for UP and 6.47 to 7.16 yr for SP; Table 1) were larger than those of Colombian creole breeds such as Costeño con Cuernos (CCC, 5.4 yr), Blanco Orejinegro (BON, 4.7 yr) and Romosinuano (ROM, 5.7 yr), but similar to Sanmartinero (SM, 6.8 yr) (Martínez et al., 2008), and to Brazilian Lageana Crioula cattle breed (6.41 yr; Pezzini et al., 2018). Gutiérrez et al. (2003) estimated an interval of GI in eight autochthonous Spanish cattle breeds (Alistana, Asturiana de la Montaña, Asturiana de los Valles, Avileña-Negra Ibérica, Bruna dels Pirineus, Morucha, Pirenaica and Sayaguesa) of 3.7 to 6.1 yr. However, compared to the present study, larger GI were reported in Kumamoto (9.4 yr) and Kouchi (10.4 yr) Japanese Brown cattle breeds (Honda et al., 2006). Differences of GI among breeds may be the result of variations in calving age, fluctuating environmental conditions throught the years in the tropic (Rosendo et al., 2018), number of years that sires and dams are used, and breeding objectives; for example, large GI are convenient in conservation breeding programs.
Regarding the integrity of the pedigree, the EG of the present study increased during the recent 20 yr and reached in RP3, 3.43 for UP and 3.34 for SP (Table 2). Those estimates were smaller than those for Romosinuano (4.8), SM (3.8) and CCC (3.7) Colombian creole breeds (Martínez et al., 2008) but higher than the interval 0.81 to 2.97 in eight Spanish autochthonous breeds (Gutiérrez et al., 2003), the EG in BON (3.1; Martínez et al., 2008), and the estimate in Lageana Crioula cattle breed (0.77, Pezzini et al., 2018). The PCI is an important measure of the quality of inbreeding estimates from the pedigree since PCI represents a harmonic mean of parental genetic contributions and equals zero if any parent is unknown regardless of how deep and complete is the pedigree for the other parent. Similarly, inbreeding can be estimated only if information for both parents is known (Battagin et al., 2010; Onogi et al., 2017). Estimates of PCI in RP3 from the present study (65.3 for UP and 65.2% for SP, and considering three generations back, and 75.4 and 93.1% considering one generation back; Figure 1) were lower than the PCI (90 and 69% in 2009 considering 2 and 5 generations, respectively) observed by Battagin et al. (2010) in Burlina native Italian cattle, and those reported by Santana et al. (2014) for Brazilian Gir cattle (99.8, 96.3 and 92.8% for generations 1, 2 and 3, respectively). The observed differences of EG and PCI among studies could be the result of variations in the number of generations traced and the quality of pedigree recording.
The three different ways to evaluate the degree of pedigree completeness (number of MG, CG and EG; percentage of known ancestors up to three generations; and PCI) indicated that for the UP and the SP the integrity of the pedigree was improved during the latest 20 yr. It is clear that an important progress has occurred after AMCROLET was established; however, these alternative measures suggest that greater efforts are needed in the recording of genealogical data to improve the accuracy of inbreeding parameters in this population (Boichard et al., 1997).
Given that Romosinuano breed was developed in Colombia and later introduced into Mexico, no nucleus herds were found. The high proportion of multiplier herds found in the present study indicates that the population is growing. Similar results were reported by Silva et al. (2016). Since the demand for Romosinuano germplasm in Mexico is increasing, commercial herds in the UP were about twice as many as those in the SP. Mexican herds (like herd 40, Figure 3) are having an increasing genetic representation in the population. Thus, it is beneficial if breeders share germplasm from various herds to avoid short-term significant increases in inbreeding, with the consequent reduction in animal performance (Burrow, 1993; Santana et al., 2012). Germplasm used in the UP matings mainly comes from the SP; thus, it is important to compare results of the SP and RP3 with other studies. The percentage of inbred animals in SP (65.8%) was higher than the range 5.8 to 30.8% in Colombian creole breeds (Martínez et al., 2008), and the interval 2 to 32% in Spanish autochthonous breeds (Gutiérrez et al., 2003), but lower than in Alentejana Portuguese (nearly 80%; Carolino and Gama, 2007), and in Burlina Italian cattle (>80%; Battagin et al., 2010). Possible causes of these differences among studies could be the pedigree completeness, monitoring of matings to avoid inbreeding, and gene flow among herds. Even though averages of F for the Romosinuano breed in Mexico have been increasing during the last 20 yr, they are still low (2.5 and 3.9% for all and inbred animals, respectively; Table 5). Lower values (<1.41% for the reference population, and <3.21% for inbred animals) were estimated for various breeds by Martínez et al. (2008), except for Romosinuano that had 3.1 and 4.0%, respectively. These differences may be due mainly to variations in effective population sizes, integrity level of the pedigree, and efficacy to prevent inbreeding. The AR was high (5.9%) as compared to the interval 2.0 to 3.9% reported by Martínez et al. (2008) in four Colombian breeds, and the range 0.10 to 1.70% by Gutiérrez et al. (2003) in eight Spanish breeds. The size of AR is important to predict the F of following generations since, under random mating, F of the progeny will be half of the AR between parents. For RP3, in the SP the expected F in the following generation would be still low at about 3%. However, these estimates may be biased downward because of incomplete pedigree data since pedigree recording in the Romosinuano Herd-Book was formally carried out after AMCROLET was created (1998).
The average Nec and Ne reached 45 and 48 in RP3 SP, respectively (Table 7). The Ne estimates from the present study are within the range (21 to 123) published by Gutiérrez et al. (2003). Larger values of Ne were reported in Romosinuano (66), BON (260), and CCC (143) Colombian breeds, except for SM (27) (Martínez et al., 2008), in Tabapuã (411; Bernardes et al., 2016), and in Brazilian Gir cattle (94; Santana et al., 2014). Estimates of Nec were smaller than Ne and increased over the last 20 yr. Smaller values of Nec than Ne were also reported by Santana et al. (2012) for Marchigiana (98 vs 140) and Bonsmara (55 vs 325) cattle breeds. However, Santana et al. (2014) found higher Nec than Ne in Brazilian Gir (166 vs 94). As indicated by Cervantes et al. (2011), the differences between Ne and Nec are mainly due to population substructures (caused by mating policies, breeding goals or geographical distances) that affect the increase in F, while the increase in coancestry practically does not change. For RP3 in the SP, the size of Nec (45) was lower than the limit (>50) recommended for conservation of genetic resources to have rates of inbreeding per generation smaller than 1.0% (FAO, 1998).
In the present study, there was an uncommon relationship between Ne and F, since there was a trend on both parameters to increase over time (Tables 5 and 7). There is a direct relationship between Ne and . Additionally, we expect that as Ne increases, F decreases. However, sometimes this does not happen, since the depends not only on the F, but also on the number of equivalent generations (). Other authors have reported this situation; for example, Rosendo et al. (2018) published Ne of 68.1 for the total and 64.6 for the selection nucleus Tropical Milking Criollo cattle, but corresponding F were 1.07 and 2.14.
Boichard et al. (1997) indicated that F trend, although commolnly used to quantify the rate of genetic drift, has some limitations; particularly when the pedigree completeness is low. The analysis of probabilities of gene origin is suggested as a complementary approach. In the present study, the fe/f ratio indicated that part of the initial genetic variability was lost due to unbalanced gene contributions of founders to the reference populations (Boichard et al., 1997). Additionaly, the fa represented about 50% of the fe, which results from bottlenecks during the development of the population. Estimates of fg for RP3 in the UP and the SP (Table 8) indicate that the amount of genetic diversity can be generated by 17 and 14 unrelated founders, respectively (Lacy, 1989; Ballou and Lacy, 1995).
Both, genetic drift and unbalanced founder contributions of genes to the reference populations were responsible for the reduction of genetic diversity, and the former accounted for >66% of the total losses, except for the SP most recent reference population (44%). Honda et al. (2006) also reported that the decay in genetic diversity in Kumamoto and Kouchi sub-breeds of Japanese Brown cattle was due mainly to accumulated genetic drift (>78%, except for Kumamoto, 16%, in 2000 reference population; estimated by the authors of the present study).
The numbers of ancestors that explained 50% of the genetic variability of Romosinuano in the present study (9 to 12) were similar to Lageana Crioula breed (10; Pezzini et al., 2018), Romosinuano (8) and CCC (12), but smaller than SM (22) and BON (22) Colombian breeds (Martínez et al., 2008), Marchigiana (13) and Bonsmara (41) (Santana et al., 2012), and Gir (38; Santana et al., 2014).
The estimates of demographic and genetic parameters suggest that the Romosinuano population in Mexico is on the borderline of risk status. One of the purposes of conservation is to maintain, as much as possible, the genetic diversity present in the founder population. Among the alternatives to maintain high levels of genetic diversity in the population, the most efficient has been to minimize the average pairwise coancestries every generation and by definition to maximize fg (Ballou and Lacy, 1995; Lacy 1995; Caballero and Toro, 2000). Therefore, it is important that Romosinuano breeders contribute to reduce losses of genetic variability through matings designed to minimize average pairwise coancestries and a more balanced use of sires.
In conclusion, reduction of the genetic diversity has been occurring since the Romosinuano breed association was established in Mexico, mainly due to random losses of genes. Even though no nucleus herds were found in this study, there was a tendency to concentrate the use of germplasm from a reduced number of herds; therefore, it is important to diversify the sources of genetic material for future matings. Monitoring genetic parameters and defining matings aimed to minimize pairwise coancestries are suggested to increase the effective population size and thus, to reduce the inbreeding rate per generation. Efforts are needed to improve the level of completeness of the pedigree and the accuracy of estimates of demographic and genetic parameters.


