


 Inglês (pdf)
 Artigo em XML
 Referências do artigo
 Enviar este artigo por email
 Citado por SciELO
  Citado por Google
  Similares em
SciELO
Similares em
SciELO  Similares em Google
 Permalink
Introduction
The active tectonics of Turkey are dominated by the westward tectonic escape of the Anatolian Plate, relative to Eurasia, from a collision zone between the converging African and Eurasian plates (~5 Ma) (Bozkurt 2001). The East Anatolian Contractional Province is under the control of a N-S directed compressional-contractional tectonic regime (Bozkurt 2001; Kocyigit et al. 2001; Özkaymak 2003; Özkaymak et al. 2004a, 2004b, 2011; Sengor and Kidd 1979; Sengor and Yilmaz 1981; Şaroğlu and Yilmaz 1986; Yilmaz et al. 1987). The Lake Van basin located on the north ofthe Bitlis-Zagros Suture Zone formed by the collision of the Eurasian and Arabian Plates suffered from historical and instrumental earthquakes of a magnitude greater than 6.0 (Ambraseys and Finkel 1995; Ergin et al. 1967; Soysal et al. 1981). The most recent of these were the Mw=7.2 Tabanli-Van earthquake of October 23, 2011 and the Mw=5.6 Edremit earthquake of November 9, 2011 (Figure 1) (USGS 2011). According to the field-based geologic and seismic geomorphology studies performed soon after the earthquake (Akyuz et al. 2011; Emre et al. 2011; Özkaymak et al. 2011), the Mw 7.2 earthquake occurred on an ENE-striking and north-dipping 70-km-long main thrust fault which was named the Van Fault Zone (VFZ) by Emre et al. (2011). The northern block (hanging-wall) of the thrust fault moved towards the southern block. The reported depth of the hypocenter is about 16 km and the co-seismic thrust offset was approximately 2 m around the hypocenter (Akyuz et al. 2011; KOERI 2011; USGS 2011). According to studies using Synthetic Aperture Radar interferometry after the earthquake, the hanging-wall uplift was about 80 cm (Akyuz et al. 2011). The focal mechanism solution of the November 9, 2011 earthquake and the results of geological studies in the region indicate that the Mw 5.6 earthquake occurred on the NE-SW-trending Edremit Fault (EF) with a sinistral strike-slip character.
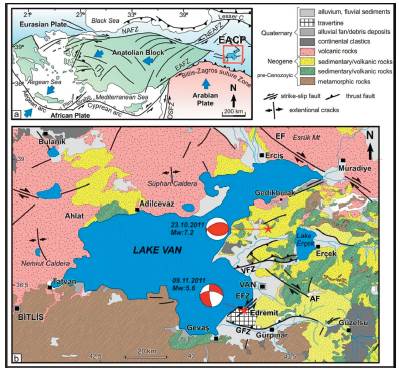
Figure 1 (a) Tectonic outline of the eastern Mediterranean area. Abbreviations: EACP, East Anatolian Contractional Province; DSFZ, Dead Sea Fault Zone; EAFZ, East Anatolian Fault Zone; NAFZ, North Anatolian Fault Zone; (b) Lake Van Basin and simplified geological map showing the main tectonic structures of the Lake Van Basin and the surrounding area. Abbreviations: GFZ: Gurpinar Fault Zone, AF: Alabayir Fault, VFZ: Van Fault Zone, EFZ: Edremit Fault Zone, EF: Ercis Fault (compiled from Emre et al. (2012); Özkaymak et al. (2004a), (2011); Şenel (2002)).
The results of other social and geodetic studies in relation to the tectonics of the region can be found in the relevant references (McClusky et al. 2000; Ozener et al. 2010; Reilinger et al. 2006; Tatar et al. 2012; Yavasoglu et al. 2011; Zare and Nazmazar 2013). Studies carried out after the October 23, 2011 earthquake investigated the amount of dislocation caused by the earthquake using the data from the CORS-TR stations in the region. However, these studies only focused on co-seismic deformation (Altiner et al. 2013; Yildirim et al. 2014). Dogan et al. (2014) determined the post-seismic deformation using the data obtained from the GNSS network after the earthquake. However, research in this area is still limited, thus there is a need for further studies to investigate post-seismic deformation to provide a better and complete understanding of the earthquake cycle of the region.
In this study, the inter-seismic, co-seismic, and post-seismic movements of the two earthquakes were investigated simultaneously with the GNSS time series of the local reference stations selected from the CORS-TR Network. For the inter-seismic period, approximately 1100 daily data were obtained from 21 CORS-TR stations (during the pre-earthquake period from October 1, 2008 to October 23, 2011) and evaluated using the GAMIT/GLOBK software. The behaviour of these stations was investigated by processing 1 Hz data from the GNSS stations during the earthquakes on the GAMIT/TRACK software. In addition to October 23 and November 9, the GNSS data in one day before and after the earthquakes was assessed to determine co-seismic deformations. For the post-seismic period, the GNSS data from 2012 to 2015 was evaluated and time series were obtained. Findings from the time series analysis showed that there were local movements in some of the CORS-TR stations (MALZ, MUUS, SIRN and HAKK). These movements indicate that the post-seismic deformation continued around the stations located close to the earthquake epicenter.
The Tectonic Structure of the Region
The Lake Van Basin is located just north of the Bitlis-Zagros Thrust Zone that was formed by the collision of the Arabian and Eurasian plates (Figure 1). It is also situated to the east of the Karliova Triple conjunctions at the intersection of the North Anatolian Fault and East Anatolian Fault. Since the collision to date, the region has been uplifted approximately 2 km (Kocyigit et al. 2001). The active tectonic structures observed in the region include NW-SE-trending right lateral (e.g., Ercis, Caldiran, and Alabayir faults), NE-SW-trending left-lateral strike-slip faults (eg. Edremit Fault Zone), approximately E-W-trending reverse/ thrust faults (e.g., Van Fault Zone and Gurpinar Fault Zone), and NS-trending extensional faults associated with volcanic activity (e.g., Nemrut opening and Suphan opening). These structures indicate approximately N-S-directed compressional-contractional tectonic regime in the region (Figure 1) (Emre et al. 2012; Özkaymak et al. 2004a; 2011; Çenel, 2002). The Van Fault Zone (VFZ) consists of a large number of E-W-trending north-dipping parallel/semi-parallel thrust fault splays. The first of these was identified by Özkaymak (2003) in the Holocene lacustrine/fluvial sediments striking 70° N and dipping 45° NW with a dominant thrust and minor left-lateral character. According to the surface deformations of the October 23, 2011 earthquake and geomorphologic observations, VFZ is mapped approximately 30 km along the zone between Lake Van to the west and south of the Lake Ercek to the east (Emre et al. 2011) (Figure 1). Another E-W-trending and north-dipping major neo-tectonic structure in the Lake Van Basin is the Gurpinar Fault Zone (GFZ) located in the southeast of Lake Van (Figure 1). Özkaymak et al. (2004a) suggested that this thrust fault could also be the source of the 2003 earthquake (Mw 4.7) in Edremit. According to the focal mechanism solution of the 2003 earthquake and the geological mapping studies in the region, as a result of this event, the Quaternary travertine deposits were thrust over the younger fluvial deposits towards the south. The fault generating the November 9, 2011 earthquake (Mw 5.6) was mapped by Özkaymak (2003) and called the Edremit Fault. The NE-SW-trending left-lateral strike-slip Edremit fault cuts and deforms the Quaternary Edremit travertines and can be traced to a distance of approximately 10 km. The Alabayir Fault located in the east of Van is a NW-SE-trending right lateral strike-slip fault of approximately 32 km (Özkaymak 2003). Datasets of historical and instrumental earthquakes indicate that many destructive earthquakes and surface ruptures occurred along these active structures reflecting the geodynamic setting of the Lake Van Basin and the surrounding area. Several events with the intensity of 9 and higher have been reported for the historical period, including 1110, 1441, 1647, 1696, and 1881 (Ambraseys and Finkel 1995; Ergin et al. 1967; Soysal et al. 1981). However, the source faults of these events are still not clear. During the instrumental period, the focal mechanism solutions of some moderate-scale earthquakes that occurred between 1988 and 2002, the most recent earthquake on October 23, 2011 (Mw 7.2), and a large number of aftershocks demonstrate that E-W-trending thrust faults are active. Furthermore, NE-SW- and NW-SE-trending strike-slip faults are also observed in the region.
GNSS network and data analysis
CORS-TR is a nationwide GNSS network established in Turkey through a project implemented by Istanbul Kultur University (IKU) in collaboration with the General Command of Mapping and General Directorate of Land Registry and Cadastre between 2006 and 2009 and sponsored by the Scientific and Technological Research Council of Turkey (TUBITAK) (Eren et al. 2009). One of the objectives of this project was to establish a spatial infrastructure to monitor the tectonic plate movements using continuous GNSS data, ultimately to contribute to the prediction of earthquakes and early warning studies within the network area (Uzel et al. 2013).
The CORS-TR network has 21 reference stations located near the epicentres of the Van earthquakes, covering a total area of ~ 100000 km2 (Figure 2). The closest station to the epicentres of both Van earthquakes is VAAN at a distance of 21 km and the furthest is ARDH at a distance of approximately 275 km.
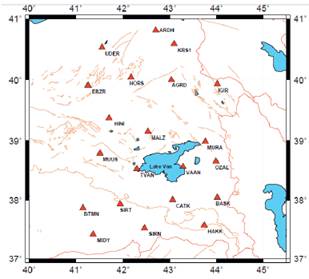
In this study, 2300 days of GNSS observations of the 21 CORS-TR stations were recorded at 30-second intervals in the RINEX data format (01.10.2008-31.12.2014, covering inter-seismic, co-seismic and post-seismic periods). The data from the GNSS day 2008.75 to 2015.00 was processed on a daily basis on the GAMIT/GLOBK software (Herring et al. 2010).
Data from each daily measurement were processed using two International Terrestrial Reference Frames (ITRF); ITRF2008 and ITRF08_ EURA. As in many studies, the following processing parameters are used in this research. The antenna phase center was derived according to the height-dependent model. The precise orbit information (IGS-F) in the SP3 format required by the GAMIT process was downloaded from the Scripps Orbit and Permanent Array Center (SOPAC) database (Herring et al. 2010). The Earth rotation parameters (ERPs) were obtained from United States Naval Observatory Bulletin B (USNO Bull. B). LC (L3) the ionosphere independent linear combination of the L1 and L2 carrier waves was used during the analysis. The FES2004 Ocean Tide Loading (OTL) grid was used to interpolate the components of the displacement caused by ocean tides (Gulal et al. 2013; Herring et al. 2010; Lyard et al. 2006; Ozener et al. 2010; Tiryakioglu et al. 2013; Tiryakioglu 2015).
Analysis of inter-seismic deformation with long-term time series and inter-seismic strain field
For the inter-seismic period, time series of station coordinates (ITRF08 and ITRF08_EURA) were obtained from the GAMIT software starting with the first measurement taken at the time of the earthquake (2008.75-2011.85). With the time series analysis, it is possible to determine the linear (trend), periodic and irregular (stochastic) movements of the reference stations. For the north, east, and up coordinates of the reference stations, the times series of χ (ti) depending on the time of ti (i= 1,2,3,...,N) can be expressed as follows (Gulal et al. 2013, 2015):

where,
ak : Trend component parameters,
bc; sc : Periodic component parameters,
fs : Frequency,
αj: Auto-regressive (AR (p)) model parameters,
βjj: Average Movement (MA (q)) model parameters,
v(ti) : Random errors with average zero and variance σ2
m,k; r,s; p,j; q,jj: Degree and order of the time series.
In order to perform the time series analysis of x (ti) , the data must be continuous and systematic. In the analysis of the time series, first, the general state of time series should be visually interpreted based on the time-dependent graphics of the series. In the time series of the 21 reference stations located in the study area, some measurements were observed to have sudden and non-recurring peaks. These measurements called 'outliers' provide values that are either significantly smaller or larger than the average values of the time series. In this study, we discuss the 'additive outliers' (AO), first defined by Fox (1972) as the first type outliers that occur due to incorrect data entry or measurements, and affect only one measurement. After the removal of the measurements that are significantly larger or smaller than the expected values, the time series returns to its normal course (Gulal et al. 2013).
In cases where some of the measurements of the χ (ti) series are affected by AO at time ti, the new series that is obtained can be expressed by y (ti) as in the following Eq. (2).

Outliers in time series are usually determined using a function that fits the series. The function used to eliminate outliers in the y(ti) series can be expressed as the sum of linear and trigonometric functions (periodic motion) (Erdogan 2012; Gulal et al. 2013).
The analysis of the trend component in the coordinate time series derived from the GNSS data is crucial for earth sciences since the linear movements of time series, 'ak • t' in the trend component are used to determine the plate movements (or velocity) based on the time unit and the direction (Gulal et al. 2013; Gulal et al. 2015). It is also assumed that annual periodic movements are produced by the effect of atmospheric and hydrologic loading (Blewitt and Lavallee 2002; Wdowinski et al. 1997). Furthermore, Van Dam et al. (2001) and Romagnoli et al. (2003) suggested that due to the climatic effects such as the accumulation of ice on antennas and antenna shields, there are periodic movements that occur quarter-yearly, half-yearly and yearly.
The outliers in the time series of y(ti) were detected using the method described by Gulal et al. (2015) and then these outliers were removed from the series. To avoid complexity, the stochastic component was not added to the function. The same function can be used to estimate new values for missing data due to the removal of outliers. Furthermore, as shown in Figures 3A and 4A, this function can estimate values to fill the gaps caused by GNSS data loss.
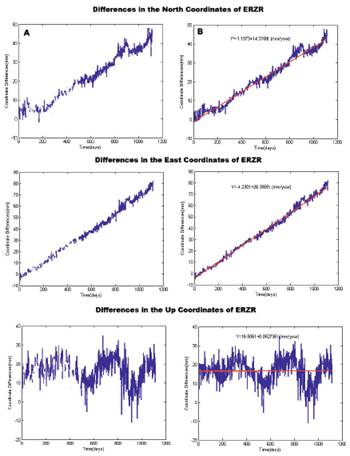
Figure 3 Time series (Column A) and linear function (Column B) for the components in the north, east, and up coordinates of the ERZR station in ITRF08
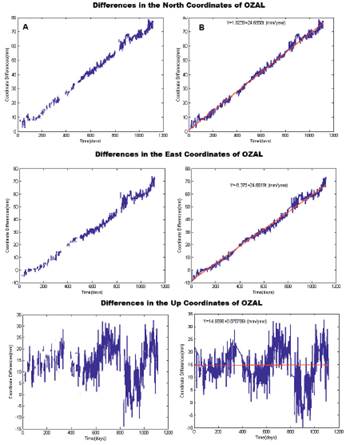
Figure 4 Time series (Column A) and linear function (Column B) for the components in the north, east, and up coordinates of the OZAL station in ITRF08
To determine the temporal movements of the GNSS stations, the coefficients of the linear function that fits the time series were estimated using the software developed in MATLAB (Figure 3B-4B). The inter-seismic velocities of the stations were determined by the estimated coefficients (Figure 5) using the core stations of the International GNSS Service (IGS).
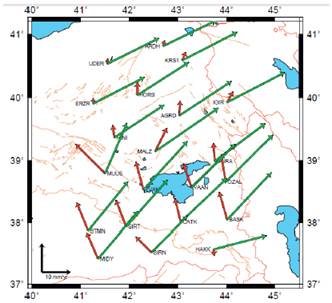
Figure 5 Velocities obtained from the time series analyses; the red arrows indicate Eurasia-fixed velocities and the green arrows shows ITRF08 velocities.
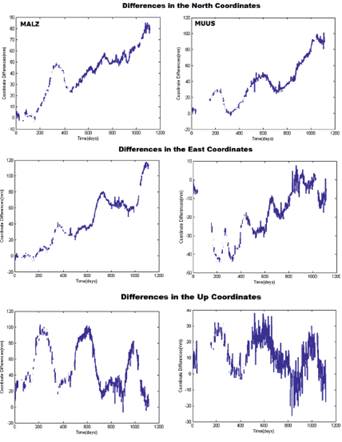
Based on Figure 5, it was observed that the MALZ, MUUS, SIRN, and HAKK stations move in different directions compared to other stations due to local movements (Ozdemir 2016). Furthermore, some sudden fluctuations were identified at the MALZ and MUUS stations (Figure 6). The Normalized Root Mean Square (NRMS) values of these stations are ±4.1 mm, ±5.8 mm, ±3.1 mm; ±6.0 mm, ±4.6 mm, ±1.3 mm, respectively. Furthermore, for these stations, the annual, semi-annual, and seasonal periodic movements explained earlier were found to be greater. This can be attributed to the changes in water level according to seasons and varied amount of precipitation. Although no fluctuations were observed in the times series of the HAKK and SIRN stations, they acted in a way contrary to the region's tectonic structure. This might be due to local deformations that occurred at these stations.
Calculation of the Inter-seismic Strain Rate
The strain analysis was performed using the inter-seismic velocities to obtain the strain fields of the region. For reasons explained in detail earlier in the paper, the MALZ, MUUS, HAKK, and SIRN stations were excluded from the analysis. After determining the velocity vectors, the stress and strain parameters of the region were calculated. In the literature, various methods have been suggested for the determination of stress and strain parameters (Brunner 1979; Deniz 1990; Dogan 2002; Kakkuri and Chen 1992; Lambeck 1988).
In this study, the GNSS sites were used to create geodetic triangles, and from these triangles, the strain rates were calculated. The general approach associated with this method is to obtain a strain field of the east and north velocity components determined through the analysis of time series. Figure 7 presents the calculated strain rates of the generated triangles. The MIDV station was excluded from figure 7 because of the geometric distortion.
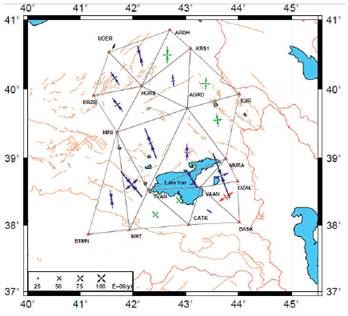
In Figure 7, the dominant extension areas, pure compression areas and the strike-slip faults are indicated by red, blue and green arrows, respectively.
Figure 7 shows that compressions consistent with the tectonic regime are widely seen. The largest compressions in the region were observed in the NNW-SSE direction, located in the triangles of MURA-OZAL-VAAN (-128 E-09/yr), HINI-TVAN-SIRT (-88 E-09/yr) and HINI-AGRD-TVAN (-84 E-09/yr). The October 21 earthquake occurred in the MURA-OZAL-VAAN triangle. This demonstrates, once again, that the focal mechanism solution of the earthquake complies with the strain. The United States Geological Survey (USGS) observed a rotation of 66 degrees in the NNE direction from the earthquake solutions and 50-70 degrees from the surface measurements (USGS 2011). In the strain analysis, the rotation of the axis direction was found to be 70 degrees in the NNE direction. The largest extension was observed in the ENE-WSW direction and located in the VAAN-OZAL-BASK (46 E-09/yr) triangle. Furthermore, strike-slip faults were observed in the south of Lake Van in the TVAN-VAAN-CATK and TAVN-CATK-SIRT triangles. The EFZ fault is another example of these strike-slip faults. The focal mechanism solutions of the November 9 earthquake in EFZ in the TVAN-VAAN-CATK triangle comply with the strain. In addition, in the AGRD-IGIR-MURA triangle, strike-slips faults are active in the north of Lake Van. The Caldiran fault located in the same region is another strike-slip fault that is in compliance with the 1976 earthquake (Ms:7.3) solutions (Tan et al. 2008). Similarly, the solutions of the November 15, 2000 earthquake (Mw: 5.6) in the same triangle indicate the presence of strike-slip faults in the region (Pinar et al. 2007).
Determination of Co-seismic Motion and Deformation
In order to determine the co-seismic motion, 1 Hz GNSS data obtained from the CORS-TR stations in the region were analyzed (10:00 to 11:00 UTC on Oct. 23, 2011, doy296). Since the 1 Hz GNSS data of the November 9 earthquake was not available, this earthquake was excluded from this study. Furthermore, some of the CORS-TR stations in the region were not operational on October 23, 2011; therefore, the co-seismic motions of these stations were not analyzed due to the lack of data. As a result, the co-seismic motions of 11 stations were analyzed (MALZ, IGIR, HAKK MURA, OZAL, TVAN, SEMD, SIRT, MUUS, HINI, and HORS).
The kinematic positions of the 11 stations were determined using the kinematic data processing program, TRACK developed at Massachusetts Institute of Technology. TRACK version 1.21, released with the GAMIT/ GLOBK version 10.4 (Herring et al. 2010) and the IGS final orbits were used to determine the kinematic baseline lengths. The displacement components of the 11 stations were plotted as differences in one-second-epoch coordinates relative to the reference coordinates of the stations. Figure 8 presents the co-seismic motions of the MALZ, HAKK, and MURA stations between 10:40:00 and 10:45:00 UTC. Similar results were observed in the TVAN, SEMD, OZAL, IGIR stations. There were no significant changes in the SIRT, MUUS, HINI, and HORS stations.
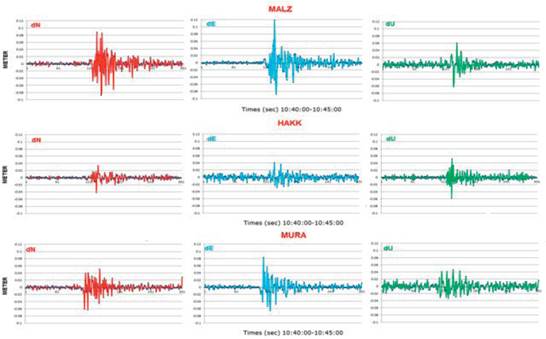
Figure 8 Velocity waveforms at the MALZ, HAKK, and MURA stations during the earthquake along the three coordinates
The coordinates of the stations obtained in the days before and after the earthquakes were evaluated to determine the co-seismic deformations of both earthquakes. As mentioned earlier, outliers were detected and removed from the series. New values were estimated using a linear function that fit the series. From the GNSS data one day before and after the earthquake was not available for all stations; the missing coordinates in the series were estimated using the linear functions. The post-seismic earthquake data for the VAAN station was derived using a logarithmic function as explained in Section 3.4.
The inter-seismic 1 Hz kinematic solution of MURA (the closest station to the earthquake epicenter, Van-Ercis) shows the maximum movements as 11.5 ± 1.5 cm in the direction of N-S, 14.8 ± 1.3 cm in the direction of E-W, and 6.9 ± 3.2 cm in the vertical direction. Similarly, the maximum movements of the OZAL station were 14.2 ± 1.5 cm in the direction of N-S, 7.6 ± 1.6 cm in the direction of E-W, and 7.0 ± 3.6 cm in the vertical direction. The highest displacement was obtained from the MALZ station with the movement being 17.5 ± 1.5 cm in the direction of N-S, 20.5 ± 1.6 cm in the direction of E-W and 12.1 ± 3.2 cm in the vertical direction. Contrary to Altiner et al. (2013), in the current study, the MALZ station was observed to have shaken more, despite being further from the earthquake epicenter compared to the MURA and OZAL stations.
The analysis of co-seismic deformation showed that the November 9, 2011 earthquake did not cause any deformation in the trends of the GNSS stations, whereas the October 23, 2011 earthquake caused deformation to the GNSS stations, as mentioned in Konca 2015. (Figure 9)
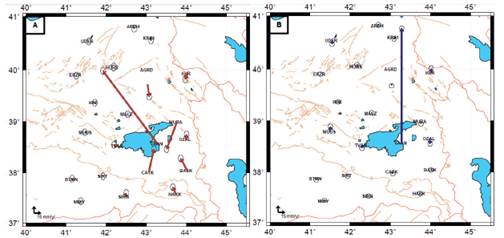
Figure 9 Co-seismic deformations. The red arrows indicate horizontal movements (A) and the blue arrows show vertical movements (B).
Figure 9 shows that the largest co-seismic deformation occurred at the VAAN station with a movement of 226 ± 3 mm in the direction of NW. This supports the data reported by other studies (Altiner et al. 2013; Dogan et al. 2014). In addition, at this point, a positive movement (169 ± 5 mm) was found in the vertical direction. This shows that the VAAN station is on the footwall block (Figure 9B).
In the stations to the north of the earthquake epicenter (on the hanging block), deformations were in the S-SW direction, whereas in the stations to the south of the earthquake epicenter (on the footwall block) deformations were in the direction of N-NW. This indicates that deformations are compatible with the characteristics of the respective earthquake. Despite the high number of inter-seismic movements in the MALZ station (Figure 8), there was almost no co-seismic deformation. Furthermore, no co-seismic deformation was observed in the BTMN, MIDV, SIRT, and MUUS stations.
Post-seismic Deformation
In order to determine the post-seismic deformation, 1100-days of data from post-earthquake years (between 2012.0 and 2015.0) was processed using the GAMIT software. The coordinates of the stations relative to the Eurasian plate were analyzed using time series as described in Section 3.1. According to the time series analysis, the post-seismic deformation of the VAAN station did not show any linear trends.
The linear function is not suitable for the analysis of time series data obtained after a megathrust earthquake. The time series of the VAAN station can be characterized with a logarithmic relaxation function (Figure 10). Satirapod et al. (2008) found that a Logarithmic decay function presented by Marone et al. (1991) better fits the post-seismic time series of the 2011 earthquakes.
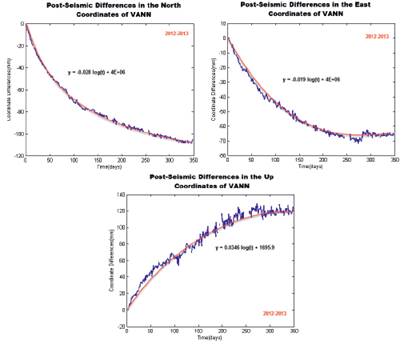
Figure 10 Time series of the VAAN station. The thin curved line in red fits the changes in coordinates as a logarithmic function of a + b log(t) (where t is time after the earthquake in years, and a and b are constants) (Savage et al. 2005).
The functions of time series are used to derive velocity combinations with respect to different years to determine whether the post-seismic movements continue (Figure 11). The accuracy of all velocity combinations was found to be lower than ±1mm/year. The black arrows in Figure 11 indicate the pre-seismic velocities presented in Figure 5. At the VAAN station, which is the nearest station to the epicenter of the earthquake, the post-seismic velocity between 2012 and 2013 is 131 ± 1 mm in the direction of EW which is significantly different from the pre-seismic velocity. Furthermore, the MURA and AGRD stations which are also close to the earthquake epicenter move in the SE direction contrary to the pre-seismic velocity. However, in the BASK, CATK, TVAN, OZAL, and HINI stations the pre-seismic and post-seismic directions are similar with the only difference being an increase in the post-seismic velocities. The post-seismic and inter-seismic velocities are almost the same in other stations further from the epicenter of the earthquakes; such as the SIRN, MIDV, BTMN, and SIRT stations.
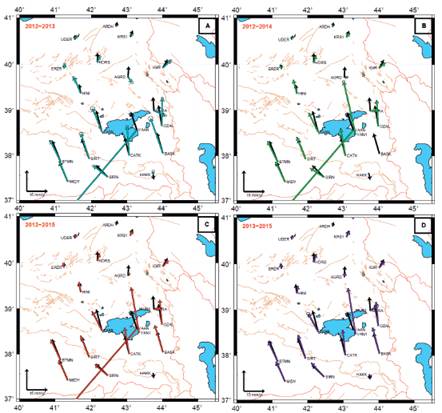
Figure 11 Post-seismic motions by periods. The red, green, purple and turquoise arrows indicate horizontal movements.
After the earthquake, the VAAN station has been re-constructed 10 km away from its initial location and was renamed as VAN1. This new location is on the same hanging block as the VAAN station. The postseismic velocity of VAN1 for the years between 2012 and 2014 is 26 mm greater than the pre-seismic velocity of the VAAN station. However, both velocities are in the NW direction. The MURA and AGRD stations changed their direction of motion from SE to E. Contrary to the previous year, their post-seismic velocities decreased getting closer to their inter-seismic velocities.
Despite the 6mm decrease in the post-seismic velocity of the VAN1 station from 2012 to 2015, it was still 20 mm greater than the pre-seismic velocity. The TVAN and MURA stations were renamed as TVA1 and MUR1 following their movement after the earthquake. For all stations except the VAN1, OZAL, BASK, CATK, MURA, and AGRD stations, the post-seismic and pre-seismic velocities were almost the same. However, the stations closer to the earthquake epicenter such as VAN1, BASK, and CATK still had post-seismic movements.
The analysis of the post-seismic velocities of the GNSS stations between 2013 and 2015 demonstrated that the post-seismic motion was transformed into an inter-seismic motion.
Conclusions
In this paper, a total of 2300 daily data was obtained from the GNSS observations of 21 CORS-TR stations (between 2008.75 and 2015.00) using the GAMIT software. The coordinates of the stations were determined on a daily basis according to ITRF08 and ITRF08_EURA. The outliers were eliminated from the time series. The trends of these time series were used to derive the velocities of the GNSS stations.
The period from October 1, 2008 to October 23, 2011 was evaluated in terms of the inter-seismic movements. Based on the analysis of the inter-seismic time series at the MALZ and MUUS stations, the annual periodic differences were considered to have been caused by changes in ground water level. It was also observed that there were some local deformations at the HAKK and SIRN stations. Therefore, these four stations were not included in the strain analysis. The largest compressions in the region were observed in the VAAN-MURA-OZAL triangle, which indicates that the thrust faults are active. The focal mechanism solutions of the October 23, 2011 earthquake showed that the earthquake occurred on a thrust fault. The directions of the compressions were found to be in agreement with the solutions of the earthquake. Furthermore, the focal mechanism solutions of the 2011 earthquakes and the previous earthquakes that had occurred in the region were consistent with the results of the strain fields. This also indicates the possibility that the thrust faults are active particularly in the south of Lake Van. Strain analysis is a powerful method to predict the possible strong ground motions in a region. As in the case of HINI-AGRD-SIRT region (figure 7), strain values indicate the approximately NNW-SSE directional compressional tectonic regime. It means that the thrust faults located at the west of VFZ can produce destructive earthquakes in the future.
The co-seismic displacements were determined only for 11 stations due to the lack of 1 Hz GNSS data for the co-seismic period for the remaining stations. Despite not being the closest station to the earthquake epicenter, the MALZ station was affected most (Figure 8). Earthquakes may cause different movements at the roof level depending on the dynamic character of the buildings. For a building with a lower horizontal rigidity, the motion of the roof is greater than the ground motion. The ground facility type of the MALZ station is a pillar. Therefore, it is considered that MALZ had been affected most since its GNSS receivers on the building measured not only the ground motion, but also the motion of the building relative to the ground motion.
The VAAN station had a logarithmic trend after the earthquake, which continued for approximately a year. After re-construction to new location (VAN1), its trend became linear.
According to the analysis of inter-seismic deformation calculated from the stations on the footwall block, the direction is NNW while the stations on the hanging block, the direction is SSW. The VAAN station was located close to the deformation zone, 400 meters away from the surface rupture caused by the earthquake. Therefore, it was observed that the VAAN station was uplifted about 17 cm due to the thrust fault movement.
In terms of the post-seismic deformation, after slip was normally the main physical mechanism for the ground motion after the main shock. We processed the continuous GNSS data to create deformation maps and calculate the variations in time-series. Furthermore, the results indicate the potential presence of a low angle fault splay as suggested by Dogan et al. (2014).
We also processed the post-seismic data in four periods, 2012-2013, 2012-2014, 2012-2015 and 2013-2015 (Figure 11). The post-seismic movement was composed of thrust slip with a significant left-lateral component in the region affected by the main shock. Both left-lateral and thrust components of the post-seismic slip are in agreement with the results of earlier studies (Dogan et al. 2014; Feng et al. 2014). The post-seismic deformation was found to have different rotational components when the velocities were determined from the time for different periods (Figure 11). The IGIR, MURA and AGRD stations, in particular, underwent unequal rotational deformation throughout the four periods. After the earthquake, the stress may have been shifted to the northern and western part of the region.

