


 Inglês (pdf)
 Artigo em XML
 Referências do artigo
 Enviar este artigo por email
 Citado por SciELO
  Citado por Google
  Similares em
SciELO
Similares em
SciELO  Similares em Google
 Permalink
INTRODUCTION
Decision making can be defined as selecting the best alternative after evaluating the possible options (Jariwala, 2015). Financial literacy is an important factor in influencing financial decision making (Ates et al., 2016), including investment choice decision-making (Gallery et al., 2011). Financial literacy assists investors in money management as they assume more responsibility for their own financial security (Murugiah, 2016). It also enhances investors' abilities and skills, enabling them to make more informed decisions (Lusardi & Mitchell, 2011b), ultimately leading to improved financial decision making (Grohmann, 2018). Financial literacy also affects stock investment decisions and stock market participation (Mishra, 2018), providing investors with the necessary confidence and knowledge to participate in the financial markets (Moreira Costa et al., 2021). High financial literacy helps investors make informed decisions overcoming barriers caused by lack of knowledge, like wrong opinions and lower predictive ability (Chen & Volpe, 1998).
A country's economy and its financial system can be efficient and robust if financial literacy levels are high (Murugiah, 2016). Financial literacy can promote sustainable development by improving investment in financial markets, leading to increasing accumulation of capital funds necessary for productive economy activity in the country (Khan et al., 2020).
The development and expansion of financial markets in India and the country's economic growth have offered Indian investors many investment opportunities and financial products. To make informed decisions and earn good returns from the market, financial literacy plays a very important role (Sahi, 2009). A survey conducted by VISA (2012) during in 2012 ranks India 23rd out of 28 countries with a score of 35 out of 100 in financial literacy. Another financial literacy survey conducted by Aggarwal et al. (2012) in the Indian market also showed low financial knowledge among the Indian investors compared to global standards. The survey also showed that younger investors, female investors and low-income investors had lower financial knowledge compared to their counterparts. Despite this, most Indian investors surveyed had a positive financial behavior, a saving attitude, and were disciplined in their dealings. Policy makers in India have recognized the importance of financial literacy as a life skill and have prioritized developing financial education to promote financial inclusion, consumer protection, and prudential regulation (Jariwala, 2015).
The Indian equity market, after the United States, hosts the highest number of listed companies. Most international investors now look at the Indian equity market as their preferred investment avenue (Karthikeyan & Mohanasundaram, 2012). Though the total number of demat account holders in India rose to 11 crore in January 2023, when compared to only 8.4 crores in 2022, active investors only contribute to 3% of the Indian household population. Unfamiliarity and risk prevent Indian investors from investing in the Indian equity market (Choice, 2023, March 13). Financial literacy levels in India are relatively low compared to developed countries, with only 27% of Indian men and 24% of Indian women meeting the minimum financial literacy requirement as laid out by the Reserve Bank of India (Asian Development Bank, 2022, March 8). According to the India Brand Equity Foundation (2022, January 27), India has the potential to be one of the top financially literate countries worldwide, as 27.6% of its population in the age category of 25-44 participate in financial inclusion programs. This rate can increase by many folds if proper financial education is provided. Hence, assessing the financial literacy level of the Indian equity market becomes very important.
The moderating role of financial literacy has been explored in various studies. Financial literacy moderates the relationship between behavioural biases and investment decisions (Hayat & Anwar, 2016); between the overconfidence heuristic and investment performance (Ahmad & Shah, 2022); between the herding bias and the cognitive investor profile (Sabir et al., 2019); between financial access and the development of SMEs (Bongomin et al., 2017; Fatoki, 2021), as well as the growth of firms (Adomako et al., 2016); between financial behaviour and internal locus of control (Mutlu & Özer, 2021); between accounts receivable management practice and the development of SMEs (Sindani, 2019); between locus of control, risk averseness, and risky investment intention (Aren & Aydemir, 2015), and between emotional intelligence and investment decision (Hadi, 2017). The moderation of financial literacy on the relation between decision-making tools and equity returns, especially with respect to the Indian equity market, has not been studied. This is the novel contribution of this study.
Given the importance of financial literacy in India, where financial market opportunities are widespread, this study aims to test the moderating influence of investors' financial literacy on the relationship between the decision-making tools and equity returns earned in the market. The paper begins with an elaborate literature review comprising decision making in the Indian equity market, fundamental analysis, technical analysis, financial literacy and its influence on stock market participation, and the returns earned. The literature review is followed by the research question and the hypotheses formulated, then the sample and methodology. This is followed by the results and discussion and the conclusion.
LITERATURE REVIEW
Decision Making Tools
The Indian equity market is an attractive investment destination for both fundamental and technical investors (Singh et al., 2016). One of the most challenging problems for investors and analysts is stock market prediction. Fundamental analysis and technical analysis are the two main decision-making tools formulated to handle this problem. These schools of thought are completely opposite and are very popular. Fundamental analysis bases its investment decisions on exploiting the information generated from sources like the media and other macroeconomic and profitability factors (Picasso et al., 2019). The fundamental analysis technique can predict abnormal returns in the future (Abarbanell & Bushee, 1998). In the Indian stock market, fundamental analysis has also been proven to generate excess returns (Aggarwal & Gupta, 2009). Both professional and amateur investors use more fundamental analysis to make buy/ sell decisions in the stock market compared to technical analysis (Cohen et al., 2011).
Technical analysis is the usage of past price behavior along with other market parameters like volume to help make decisions in the financial markets. Buy/sell decisions are made in technical analysis by applying simple rules to historical price data (Neely & Weller, 2012). Technical analysis decisions are based on mathematical indicators constructed from stock prices (Picasso et al., 2019). Investors employing technical analysis earn lower returns due to poor portfolio decisions, such as speculation on stock market changes in the short term and exposure to non-systematic risk (Hoffmann & Shefrin, 2014). Some studies, such as Moosa and Li (2011), show that technical analysis is more effective than fundamental analysis.
Fundamental and technical analysis are conceptually different techniques adopted to predict stock returns. They exploit different patterns, and pooling their information helps to earn abnormal returns (Neely et al., 2010). Depending on the expectations and term of investment, investors choose the appropriate decision-making tool to maximize returns. Every tool has its advantages and disadvantages. A combination of techniques could cover the flaws of individual tools and aim to optimize the performance of the investors' portfolio (Flotyński, 2016).
Fundamental analysis is preferable for making long-term investment decisions, and technical analysis for making short-term investment decisions (Oberlechner, 2001). Both fundamental and technical analysis generate excess returns in the financial market (Swart, 2011). Fundamental analysis and technical analysis complement each other very well (Neely et al., 2010), and their integration showcases better results than isolation (Bettman et al., 2009). By combining the predictions of both fundamental and technical analysis, robust investment decisions that earn higher returns can also be made (Picasso et al., 2019). Most investors use fundamental indicators to make stock purchase decisions and technical indicators to make sell decisions (Cohen et al., 2011).
Financial Literacy
The financial literacy level has a significant relationship with investment decisions (Al-Tamimi & Kalli, 2009; Prasad et al., 2021a; Prasad et al., 2021b). Financially literate individuals are more likely to invest in financial markets because there is a significant positive association between financial literacy and investment (Khan et al., 2020). The investment behavior of investors is strongly influenced by their financial literacy level (Mouna and Anis, 2017). Some studies, such as Prasad et al. (2021a), also report that the influence of financial literacy on investment decisions is stronger in male investors than in female investors. Investors' financial literacy improves their financial knowledge and information, thereby making them more confident in making investment decisions (Jariwala, 2015). Investors with good financial literacy i.e., with good financial knowledge, have the advantage of undertaking robust analysis and have the capability to collect relevant information and employ various procedures during investment decision-making (Sabir et al., 2019). Investors with high financial literacy have good investment skills such as grasping the concepts of inflation, interest compounding, and risk diversification, among others (Fong et al., 2021). Financial literacy helps investors think in a settled way and make rational and well-calculated investment decisions confidently (Raut, 2020).
Investors with high financial literacy also exhibit lower behavioral biases in the equity market (Mouna & Anis, 2015; Ates et al., 2016), as there is a negative association between financial literacy and such biases (Rasool and Ullah, 2020). Financial literacy helps to absorb investors' irrational behavior and make sound decisions to attain the required profits. Financial literacy improves investors' stock selection knowledge, the timing of stock sale/purchase, and the estimation of risk/return without any uncertainty (Suresh, 2021). Cognitive ability is also a good predictor of financial literacy levels, and investors with high cognitive ability are found to have high financial literacy levels (Lusardi et al., 2010).
Financial literacy is influenced by demographic, socioeconomic, and social factors such as information and sources of advice and risk factors (Gallery et al., 2011). The financial literacy level is influenced by the education level, the income level, age (Mouna & Anis, 2017), and the workplace activity of the investor. High-income investors, who usually have high educational levels and work in banking/finance/ investment, have higher financial literacy levels compared to others (Al-Tamimi & Kalli, 2009). Financial literacy moderates the relationship between education/ experience and investment decisions. Thus, in addition to investing experience and education, financial literacy is essential to make investment decisions (Fachrudin & Fachrudin, 2016).
Female investors have lower financial literacy levels compared to male investors (Al-Tamimi & Kalli, 2009; Chen & Volpe, 1998; Lusardi et al., 2010; Bucher-Koenen et al., 2021; Rasool & Ullah, 2020; Lusardi & Mitchell, 2008; Lusardi & Mitchell, 2011a) owing to their lower investment knowledge (Volpe et al., 2002) and lower confidence levels (Bucher-Koenen et al., 2021). Female investors are also aware of their lower financial literacy level (Lusardi & Mitchell,2011a). Female investors with low financial literacy are less likely to plan for retirement and be successful planners (Lusardi & Mitchell, 2008). The financial literacy differences exist even after controlling for demographics, peer characteristics, and family background characteristics (Lusardi et al., 2010). The gender gap in stock market participation is due to the lower financial literacy level of female investors (Almenberg & Dreber, 2015) and their lower confidence levels (Bucher-Koenen et al., 2021).
In general, younger investors with less experience, less income, and higher familiarity bias tend to be less financially literate (Mouna & Jarboui, 2015). Older investors are found to have higher investment literacy compared to younger investors (Volpe et al., 2002). Some older investors believe that they are more financially literate and better informed, though that may not be the case in reality (Lusardi & Mitchell, 2011a). Younger investors have less experience and a lower level of knowledge, resulting in lower financial literacy levels (Chen & Volpe, 1998). Young investors tend to face complex financial decisions at a young age and hence adequate financial literacy becomes important at a very young age (Lusardi et al., 2010). A survey of Indian investors also showed that financial literacy was higher for male investors and increased with educational level and aggressiveness of the investor. Investors with higher goals, liabilities, insurance policies, and investments tend to have higher financial literacy (Agarwal et al., 2015).
Financial literacy significantly influences stock market participation (Thomas & Spataro, 2018). It positively influences the investors' attitudes towards investing in the stock market (Raut, 2020). Basic financial literacy is required to get the non-investors to invest in the stock market, and subjective financial literacy is necessary to enhance equity holding (Sivaramakrishnan et al., 2017). Therefore, stock market participation can be increased only by enhancing the financial literacy of the potential equity investors (Sivaramakrishnan et al., 2017; Hermansson et al., 2022; Van Rooij et al., 2011). Individuals do not blindly participate in the stock market; instead, they equip themselves with enough understanding of the financial markets and products before investing. Hence, only individuals with high financial literacy are more likely to participate in the stock market (Hii et al., 2022). Investors with low financial literacy are less likely to invest in the stock market (Mouna & Anis, 2017), as stocks are complex assets (Van Rooij et al., 2011). The positive significant relationship between stock market participation (in terms of the probability of owning stocks and the investors' share of their portfolio in stock investments) and learning about financial markets through the media is significantly moderated by financial literacy. Hence, stock market participation is increased only by the combined influence of financial literacy and learning from the media (Hermansson et al., 2022).
High financial literacy investors also invest in a wide range of financial products and services (Grohmann, 2018). Investors with low financial literacy levels hold poorly diversified portfolios (Mouna & Jarboui, 2015). Investors with high financial literacy hold well diversified portfolios as financial literacy influences the number of different assets held in a portfolio. Diversification increases with the level of financial literacy (Abreu & Mendes, 2010). Hence, financial literacy is one of the significant predictors of portfolio diversification (Mouna & Jarboui, 2015).
Financial literacy's influence on returns
Financial literacy also facilitates wealth accumulation (Van Rooij et al., 2012; (appelli & Padula, 2013). High financial literacy leads to better positive financial outcomes, such as high investment returns (Chu et al., 2017), and reasonable investment outcomes (Gaudecker, 2015). The study by Bianchi (2018) showed that, after controlling for risk, financially literate investors earn 0.4% higher annual returns compared to the less literate investors. Financially literate investors have higher risk exposure and rebalance their portfolios to ensure consistent risk exposure. They also buy assets that generate higher returns. Financially literate investors have better knowledge about the risk and return philosophy of investing in financial markets and invest in riskier investments to earn higher returns (Khan et al., 2021).
Korniotis and Kumar (2013) show that smart investors beat less informed investors by 3% annually on a risk-adjusted basis. Regarding stock investments, the smart investors outperform the less informed investors by 3.5% annually. Investors with high financial literacy hold mutual funds in their portfolios due to the correlation between financial literacy and risky asset investing behavior (Chu et al., 2017). High financial literacy investors are better at timing the market. They also follow normative models of investing and diagnose potential conflicts of interest (Guiso and Viviano, 2015). Investors with poor investment knowledge should seek professional help to prevent costly investment mistakes, such as poor diversification and huge losses (Gaudecker, 2015).
Several studies, such as Bongomin et al. (2017), Ahmad and Shah (2020), Sabir et al. (2019), Mutlu and Özer (2021), Singh and Misra, (2020), Adomako et al. (2016), Hayat and Anwar (2016), Sindani (2019), Fatoki (2021), Niazi and Malik (2019), Sadiq and Khan (2019), Aren and Aydemir (2015), Hadi (2017), etc., have tested the moderating effect of financial literacy in various relationships in the finance domain. To the best of our knowledge, the moderating effect of financial literacy on the relationship between decision-making tools and equity returns has not been studied, especially in the Indian equity market. This study aims to bridge that research gap, given the importance and influence of financial literacy elaborated in the literature review.
Research Question and the Hypotheses Formulated
This study aims to answer the research question: "Does the effect of decision-making tools on the equity returns earned by Indian secondary market investors vary by the investor's financial literacy level?"
Based on this research question, the hypotheses thus formulated are:
H1: The financial literacy level of the investor moderates the relationship between the decision-making tool, Economy analysis, and the equity return earned by the investor.
H2: The financial literacy level of the investor moderates the relationship between the decision-making tool, Industry analysis, and the equity return earned by the investor.
H3: The financial literacy level of the investor moderates the relationship between the decision-making tool, Company analysis, and the equity return earned by the investor.
H4: The financial literacy level of the investor moderates the relationship between the decision-making tool, Technical analysis, and the equity return earned by the investor.
H5: The financial literacy level of the investor moderates the relationship between the decision-making tool, Advocates recommendation, and the equity return earned by the investor.
SAMPLE AND METHODOLOGY
The population for this study consists of Indian secondary equity investors who reside in the city of Chennai and have been actively investing in stocks for a minimum of two years. The sample for this study was drawn from the members of the Tamil Nadu Investors Association (TIA) and the customers of the financial service provider, Integrated. TIA was chosen as the only formally organized body which permitted access to gather data, and Integrated was chosen as the only corporate body which permitted access to gather data. Data was gathered through a questionnaire survey method, and the final number of valid questionnaires gathered was 436.
According to the 2011 census data, the Indian urban population is 377 million, and Tamil Nadu (with its capital city of Chennai) records 34 million people (CensusIndia, 2011), which is nearly 10% of the Indian urban population. Therefore, the capital city of Chennai was chosen as the sample for this study. In India, the equity market penetration is only 2.5% (Financial Express, 2018, December 31), so the sample size is small but representative of the population. However, the article's results cannot be generalized to the Indian population and are limited only to the investors residing in Chennai.
Table 1 provides details of the questionnaires distributed, collected, and the response rate. The response rate was very high and the number of incomplete questionnaires returned was negligible.
Definition and measurement of the variables of study
The main variables of the study are the decision-making tools, derived from Principal Component analysis and Varimax rotation of the stock selection variables. The variables were grouped under the decision-making tools as follows:
Technical analysis:
Advocate's recommendation:
Economy analysis:
Industry analysis:
Government policies relating to the industry to which the company belongs.
Future prospects of the industry to which the company belongs.
Technology changes in the industry to which the company belongs.
Supply chain constraints in the industry to which the company belongs.
Market for the industry to which the company belongs.
Company analysis:
The next variable, the financial literacy level, was measured by asking the respondents to rate their equity investment knowledge on a scale of 1 to 5, with 5 being the highest and 1 being the least. The last variable, equity returns, was measured by asking the respondents to mention their actual capital appreciation in equity investment (annually) in the previous two years.
RESULTS AND DISCUSSION
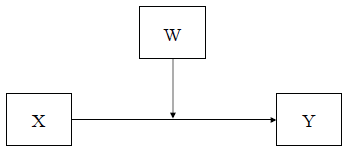
This study aims to explore if the relationship between the decision-making tools of Technical analysis, Industry analysis, Economy analysis, Company analysis, and Advocate recommendation (M) and the equity returns (Y) vary as a function of the financial literacy level of the investor (W). Hence the decision-making tools are the dependent variable, M; the equity return earned in the secondary equity market is the independent variable, Y, and the financial literacy level is the moderator, W. The following figures, Figure 1 and Figure 2, illustrate this model, which is the Simple Moderation Model.
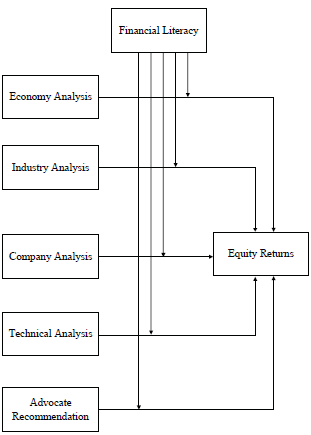
The decision-making tools were derived from 20 variables that influence stock investment decisions, which were assessed on a Likert scale. These variables were then reduced to five factors using Principal Component Factor analysis and rotated orthogonally using Varimax rotation. These factors were renamed as (i) Economy analysis, (ii) Industry analysis, (iii) Company analysis, (iv) Technical analysis, and (v) Advocates recommendation.
The financial literacy level was measured by asking respondents to rate their equity investment knowledge on a scale of 1 to 5, with 5 being the highest and 1 being the least. The financial literacy profile on the respondents is shown in Table 2. The mean financial literacy level is 2.21, indicating that the sample is knowledgeable.
Table 2 Frequency Distribution of the Financial Literacy Level
| Financial Literacy Level | Frequency | Percent | Cumulative % |
|---|---|---|---|
| Level 1 (Lowest) | 108 | 24.8 | 24.8 |
| Level 2 | 177 | 40.6 | 65.4 |
| Level 3 | 111 | 25.5 | 90.8 |
| Level 4 | 33 | 7.6 | 98.4 |
| Level 5 (Highest) | 7 | 1.6 | 100 |
| Total | 436 | 100 |
Source: Author's elaboration
Equity returns were measured by asking respondents to report their actual capital appreciation in equity investment (annually) in the previous two years. The profile of the equity returns earned by the investors is shown in Table 3. Table 4 shows the statistics of both variables: Financial literacy level and Equity returns.
Table 3 Frequency Distribution of the Equity Returns Earned
| Equity Return | Frequency | Percent | Cumulative % |
|---|---|---|---|
| -2.5% | 56 | 12.8 | 12.8 |
| 2.5% | 118 | 27.1 | 39.9 |
| 7.5% | 79 | 18.1 | 58.0 |
| 12.5% | 70 | 16.1 | 74.1 |
| 17.5% | 43 | 9.9 | 83.9 |
| 22.5% | 30 | 6.9 | 90.8 |
| 27.5% | 40 | 9.2 | 100 |
| Total | 436 | 100 |
Source: Author's elaboration
Table 4 Statistics of Financial Literacy Level and Equity Returns
| Statistics | Financial Literacy Level | Equity Return |
|---|---|---|
| Mean | 2.21 | 9.5183% |
| Median | 2 | 7.5 |
| Mode | 2 | 2.5 |
| Skewness | .552 | .572 |
| Std. Error of Skewness | .117 | .117 |
| Kurtosis | -.085 | -.696 |
| Std. Error of Kurtosis | .233 | .233 |
Source: Author's elaboration
The following results describe a moderation phenomenon, also known as interaction. When the financial literacy level (W) moderates the effect of the relationship between the decision-making tools (X) and the equity returns (Y), this implies that the relationship depends on the moderator, the financial literacy level (W). That relationship is contingent or conditional on the financial literacy level (W). The size of the relationship is some kind of function of the moderator, the financial literacy level (W). Moderation gives information about when an effect exists or not, when it is small or large, when it is positive or negative, etc.
Moderation analysis was conducted using the Process Macro plugin in SPSS (Hayes, 2013). Bootstrapping was done, and the number of bootstrap samples was 5000.
The study assessed the moderating role of the financial literacy level on the relationship between the decision-making tools (Economy analysis, Technical analysis, Company analysis, Industry analysis, and Advocate recommendation) and the equity returns.
Economy analysis
Based on the results in Table 5, the model is significant as the p-value (0.0000) is less than 0.05 (alpha value). The R2 value is 0.1323, indicating that 13.23% of the variance in the equity returns is explained by the predictors: economy analysis, financial literacy level and the interaction between the economy analysis and financial literacy level.
Table 5 Model Summary for Economy Analysis
| R | R2 | MSE | F(HC0) | dfl | df2 | P |
|---|---|---|---|---|---|---|
| .3637 | .1323 | 71.4564 | 18.3440 | 3.0000 | 432.0000 | .0000 |
Source: Author's elaboration
The moderation results in Table 6 revealed a negative and significant moderating impact of financial literacy level on the relationship between Economy analysis and the Equity returns (b = -1.5136, t = -3.1448, p = 0.0018), supporting H1. Hence, economy analysis interacts with financial literacy as the moderation is significant.
Table 6 Model Summary of the Moderation effect on Economy analysis
| Coefficient | se(HC0) | T | P | LLCI | ULCI | |
|---|---|---|---|---|---|---|
| Constant | 9.5432 | 0.4035 | 23.6527 | 0.0000 | 8.7502 | 10.3362 |
| Economy Analysis | -.4339 | 0.4306 | -1.0075 | 0.3142 | -1.2802 | 0.4125 |
| Financial Literacy | 2.9933 | 0.4536 | 6.5993 | 0.0000 | 2.1018 | 3.8848 |
| Int_1 | -1.5136 | 0.4813 | -3.1448 | 0.0018 | -2.4596 | -0.5676 |
Source: Author's elaboration
The p-value of the interaction between the financial literacy level (moderator, W) and the economy analysis (dependent variable, X) is 0.0018, which is less than 0.05 (alpha value). Therefore, the interaction between the moderator, the financial literacy level, and the dependent variable, the economy analysis, is significant. Thus, the financial literacy level negatively moderates the relationship between Economy analysis and Equity returns. This implies that the higher the financial literacy level, the weaker the relationship between economy analysis and equity returns. Similarly, the lower the financial literacy level, the stronger the relationship.
The mathematical equation of the model, based on Table 6 results is
Y = 9.5432 - 0.4339X + 2.9933W - 1.5136XW
which can be rewritten as, Y = 9.5432 - (0.4339 + 1.5136W)X + 2.9933W. Therefore, the effect of X on Y is not a single number but a function of W, the moderator.
Where Y is the independent variable, the equity returns; X is the dependent variable, the economy analysis; W is the moderator, the financial literacy level; and XW is the interaction between the dependent variable, the economy analysis and the moderator, the financial literacy level.
To better understand the moderation effect, a visual representation of the interaction shown in Figure 3 was conducted. The figure implies that when Financial Literacy Level is low (blue bubble), the relationship between Equity returns and Economy Analysis increases (from 6.0 to 7.6 approximately), i.e., as Economy Analysis increases, Equity returns increase. When the Financial Literacy Level is high (green bubble), the relationship between Equity returns and Economy Analysis decreases (from 14 to 10.5 approximately), i.e., as Economy Analysis increases Equity returns decrease.

Source: Author's elaboration
Figure 3 Visual Representation of the Interaction Between Economy Analysis and Equity Returns
The figure clearly shows that when the moderator, the financial literacy level, is lower, the positive relationship between equity returns and economy analysis is stronger. And when the financial literacy level is higher, the negative relationship between equity returns and economy analysis is weaker, as the moderator, the financial literacy level, weakens the relationship. Hence, when the financial literacy level is lower, the high equity returns are due to the decision-making tool, economy analysis, which was employed. But when the financial literacy level is high, the financial literacy level weakens the relationship between economy analysis and equity returns, as investors with high financial literacy level earn high returns, similar to the results of Chu et al. (2017), Bianchi (2018), Gaudecker (2015), and Korniotis and Kumar (2013).
Test of Unconditional Interaction
The test of unconditional interaction shows the change in R2 due to the interaction between the moderator, the financial literacy level, and the dependent variable, Economy analysis. This test is significant at p-value 0.0018, based on the results in Table 7.
Johnson-Neyman Interval analysis
Johnson-Neyman interval analysis tells us the range of values of the moderator, in which the slope of the predictor is significant or. non-significant at a specified alpha level. This method identifies regions in the range of the moderator, i.e., the financial literacy level, where the effect of the focal predictor, i.e., the economy analysis on the outcome, which are the equity returns, is statistically significant or not significant.
Based on the results in Table 8 and 9, when the value of the moderator, i.e., the financial literacy level, is below -1.0367, the relationship between the dependent and the independent variable is positive, and the moderation is significant. That is, when the financial literacy level is below -1.0367, the financial literacy level moderates the positive relationship between the economy analysis and the equity returns. And when the financial literacy level is above 0.3649, the relationship between the dependent variable and the independent variable becomes negative, and the moderation by the financial literacy level is also significant. That is, when the financial literacy level is above 0.3649, the financial literacy level moderates the negative relationship between the economy analysis and the equity returns. However, when the value of the financial literacy level is between -1.0367 and 0.3649, the financial literacy level has no effect on the relationship between economy analysis and equity returns.
Table 8 Moderator Value(s) Defining Johnson-Neyman Significance Region(s) for Economy Analysis

Source: Author's elaboration
Table 9 Conditional Effect of Focal Predictor at Values of the Moderator for Economy Analysis
| Q12EqKnw | Effect | se(HC0) | t | P | LLCI | ULCI |
|---|---|---|---|---|---|---|
| -1.2064 | 1.3922 | 0.6367 | 2.1866 | 0.0293 | 0.1408 | 2.6436 |
| -1.0367 | 1.1354 | 0.5777 | 1.9655 | 0.05 | 0 | 2.2707 |
| -0.9959 | 1.0735 | 0.5643 | 1.9025 | 0.0578 | -0.0356 | 2.1826 |
| -0.7854 | 0.7549 | 0.502 | 1.5037 | 0.1334 | -0.2318 | 1.7416 |
| -0.5748 | 0.4362 | 0.454 | 0.9608 | 0.3372 | -0.4561 | 1.3286 |
| -0.3643 | 0.1176 | 0.4252 | 0.2765 | 0.7823 | -0.7181 | 0.9533 |
| -0.1538 | -0.2011 | 0.4195 | -0.4794 | 0.6319 | -1.0256 | 0.6234 |
| 0.0567 | -0.5197 | 0.4378 | -1.1871 | 0.2358 | -1.3803 | 0.3408 |
| 0.2673 | -0.8384 | 0.4774 | -1.756 | 0.0798 | -1.7768 | 0.1 |
| 0.3649 | -0.9861 | 0.5017 | -1.9655 | 0.05 | -1.9722 | 0 |
| 0.4778 | -1.1571 | 0.5336 | -2.1684 | 0.0307 | -2.2059 | -0.1083 |
| 0.6883 | -1.4757 | 0.6017 | -2.4525 | 0.0146 | -2.6584 | -0.293 |
| 0.8988 | -1.7944 | 0.6782 | -2.6459 | 0.0084 | -3.1273 | -0.4614 |
| 1.1094 | -2.113 | 0.7605 | -2.7785 | 0.0057 | -3.6077 | -0.6183 |
| 1.3199 | -2.4317 | 0.8469 | -2.8712 | 0.0043 | -4.0963 | -0.7671 |
| 1.5304 | -2.7503 | 0.9363 | -2.9373 | 0.0035 | -4.5907 | -0.91 |
| 1.7409 | -3.069 | 1.028 | -2.9855 | 0.003 | -5.0895 | -1.0485 |
| 1.9515 | -3.3877 | 1.1213 | -3.0212 | 0.0027 | -5.5915 | -1.1838 |
| 2.162 | -3.7063 | 1.2159 | -3.0483 | 0.0024 | -6.0961 | -1.3166 |
| 2.3725 | -4.025 | 1.3115 | -3.0691 | 0.0023 | -6.6026 | -1.4473 |
| 2.5831 | -4.3436 | 1.4079 | -3.0853 | 0.0022 | -7.1108 | -1.5765 |
| 2.7936 | -4.6623 | 1.5049 | -3.098 | 0.0021 | -7.6202 | -1.7044 |
Source: Author's elaboration
Other Decision-Making Tools
Based on the results in Table 10, though the model was significant with p = 0.0000, for the other decision-making tools, namely Industry analysis, Technical analysis, Company analysis, and Advocate's recommendation, the p-value of the interaction between the decision making-tool and financial literacy (Int_1) was insignificant with p-values of 0.0728, 0.5697, 0.0644, and 0.3722, based on Table 11 results. Hence, the moderator, the financial literacy level, did not moderate the relationship between the decision-making tools of industry analysis, technical analysis, company analysis, and advocates' recommendation, disproving the hypotheses H2, H3, H4, and H5. Similar to the results of Jariwala (2015) and Ranaweera and Kawshala (2021), which reported that the investors' financial literacy level does not statistically influence investment decisions.
Table 10 Model Summary for the Other Decision-Making Tools
| Decision-Making tools | R | R2 | MSE | F(HC0) | df1 | df2 | p |
|---|---|---|---|---|---|---|---|
| Industry analysis | 0.3736 | 0.1395 | 70.8561 | 21.9687 | 3.0000 | 432.0000 | 0.0000 |
| Company analysis | 0.3281 | 0.1077 | 73.4802 | 16.6595 | 3.0000 | 432.0000 | 0.0000 |
| Technical analysis | 0.3511 | 0.1233 | 72.1944 | 19.1201 | 3.0000 | 432.0000 | 0.0000 |
| Advocates' recommendation | 0.4416 | 0.1950 | 66.2872 | 35.8978 | 3.0000 | 432.0000 | 0.0000 |
Source: Author's elaboration

CONCLUSIONS
This study pioneers in analysing the moderating influence of investors' financial literacy on the relationship between decision-making tools and equity returns in the Indian secondary equity market. The questionnaire survey method was used to collect data from a sample of Indian secondary equity investors who actively transact in the market. The sample of 436 investors was found to be financially knowledgeable, earning an average return of 9.5%.
The decision-making tools were derived using Factor analysis (Principal Component) followed by the orthogonal Varimax rotation of the variables influencing the stock selection decision. Using the Process plugin of SPSS, the significance of the moderating effect was tested. The results showed that when the moderator, the financial literacy level is lower, the positive relationship between equity returns and economy analysis is stronger. And when the financial literacy level is higher, the negative relationship between equity returns and economy analysis is weaker, as the moderator, the financial literacy level, weakens the relationship.
Thus, financial literate investors earn good returns in the equity market, independent of the economy analysis tool employed to make decisions. Investors with poor financial literacy earn good returns in the market when economy analysis is adopted. The findings of this study encourage investors to improve their financial literacy level so that they can earn good returns in the market, independent of the decision-making tool employed. Government and policymakers need to roll out financial education programs to advance investors' financial literacy levels, so that the investors are equipped to handle market uncertainties and the risk involved. Wealth managers and financial advisors should also help improve investors' financial literacy levels through education programs so that investors are better able to handle the complexities of stock market decisions.
The scope of this study is limited to the Indian investors residing in Chennai, and generalization of these results to the Indian population is not possible given the diversity and cultural differences across India. Academic researchers and practitioners could replicate this study across the country using investor samples from across India. The study could also be replicated in other countries and cross-country analysis could help to assess the moderating role of financial literacy levels across the globe.

