


 English (pdf)
 Article in xml format
 Article references
 Send this article by e-mail
 Cited by SciELO
  Cited by Google
  Similars in
SciELO
Similars in
SciELO  Similars in Google
 Permalink
Introduction
Currently, the infrastructure asset management for urban drainage has changed the perspective from reactive management (acting after failure) to adopt proactive strategies that seek to prevent failures in network components and their effects. In fact, the urban system stakeholders are facing important challenges to achieve a rational, efficient, effective and sustainable management and maintenance of this infrastructure while simultaneously considering the diversity of actors and constraints involved (budget limitations, environmental regulations and urban water infrastructure benefits) (Baik et al., 2006; Cardoso et al., 2012; Younis and Knight, 2012).
Nevertheless, this approach requires an in depth understanding of the multiple factors that affect the aging and deterioration processes of drainage infrastructure (Renaud et al., 2007; Le Gauffre et al., 2007;Tagherouit et al., 2011)
Many authors have demonstrated that, generally, the development of a rational framework for proactive asset management requires a systematic approach: first, evaluate the current condition, performance and capacity of each element in the network; second, predict their future states within their life cycles; and finally, determine the priority of interventions before failure or malfunction (Fenney, 2009). Le Gauffre et al. (2007) highlight four types of assessment methods: a) direct observation using CCTV inspections, acoustic technologies, electrical/electromagnetic tools, etc. (Liu & Kleiner, 2013; Hao et al., 2012); b) run evaluations based on observation, in which latent problems are identified from inspection results; c) run evaluations based on explanatory variables, using statistical or aging models to assess the likely condition of a segment of the sewer system, even before assessment by CCTV; and d) composite indicators, which are a combination of two or more previous performance indicators. However, several factors bring significant complexity to the adoption of such a generalized framework. The inherent heterogeneity of the environmental, physical and operational conditions to which urban drainage infrastructures are subject, the difficulty in keeping an up-to-date census of network elements and the difficulty in quantifying the impact of the environmental factors usually require a trade-off between effectiveness and cost for the predictive/preventive approach. Studies have shown that some parameters, including sewer size, sewer depth, age of sewer, sewer material, root interference and ground movement, among others, exert an influence on the likelihood of a sewer failing structural and hydraulically (Davies et al., 2001a; Anbari et al., 2017). However, these factors are determined mainly from an experience base and therefore, many of the factors identified are difficult to support monitor comprehensively. Other studies include statistical analysis of data acquired from CCTV inspections: Davies et al. (2001b) and Koo & Ariaratnam (2006) undertook logistic regression in order to predict the probability that a particular sewer is collapsed or the collapse is imminent based on the value of 18 explanatory variables. However, logistic regressions have extensive data requirements (Ana & Bauwens, 2010), and its binary nature could hide important information, limiting their decision-making in sewer asset management (Salman, 2010). Younis & Knight (2010) developed an ordinal regression model for the deterioration of wastewater pipelines based on cumulative logits, which has been applied to the city of Niagara Falls wastewater collection system. This model was constructed by using the Generalized Linear model formulation and took into account the effect between the explanatory variables. However, this model was proposed for the prediction of deterioration behavior for pipes in service and not for the investigation of explanatory variables. Between 2002 and 2005, the European Commission under the Fifth Framework Programme developed a joint research project between institutions from eight European countries known as CARE-S, Computed aided rehabilitation of sewer networks (Saegrov & Schilling, 2005). The project developed a set of tools to assess, predict and manage the problems found in aging networks.
In the city of Bogota, Colombia, most of the current efforts to improve sewer management are based on direct observation, so the adoption of a generalized framework still faces several limitations. In Bogota, with a total population of approximately 8 million, the Water Utilities Company (Empresa de Acueducto de Bogotá - EAB) has recently promoted several strategies to modernize asset management, by implementing CCTV inspections of the pipelines, developing standards to assess and qualify the system's structural and operational status, improving cadastre GIS systems for networks and users and integrating support technologies such as enterprise risk management (ERM) and modeling tools for hydraulic systems. The NS-058 standard (EAAB, 2001), implemented by EAB in 2001 and revised in 2007, allows EAB to qualify problems and prioritize required interventions based on an evaluation of the pipe segments, as well as on defects found during inspections, according to three criteria: structural condition, operational status and inventory (i.e., incorrect connections, pests, water level, etc.). The standard prioritizes infrastructure rehabilitation based on a five-grade scale: immediate intervention (grades 4 and 5), inspection or rehabilitation in the medium term (grades 2 and 3, 3 years) and inspection in the long term (grade 1, 5 years). However, the inspection rate is less than 2% per year, equivalent to an average inter-inspection period of more than 50 years, which is low compared with others (Caradot et al., 2013a). In addition, inspection activities do not respond to an established strategy based on field data or cost-risk optimization (Berardi et al., 2009). Additionally, a comparison between the EAB and CARE-S indicators shows that the information handled by EAB cannot provide enough input to construct indicators similar to those used by CARE-S to predict future asset status. Consequently, despite the fact that the company collects information and that it can be quickly accessed, (i) the type of data currently collected does not provide enough information to make decisions using tools such as CARE-S, i.e., there is a lack of information about pipe characteristics such as their width and roughness coefficients, conditions such as infiltration and exfiltration rates, environmental data such as tree locations and soil information, etc.; and (ii) the information is not collected as often as necessary (Perez P. et al., 2011).
On the other hand, there are other local studies which have detected linear and non-linear relationships between physical sewer pipes characteristics and the structural condition of sewer pipes using PCA and clusters (López-Kleine et al., 2016) and entropy concepts (Hernández et al., 2016) in order to develop deterioration models of the sewer pipes. However, according to Caradot et al. (2013b), the deterioration models based on the prediction of overall structural and operational condition overestimate them, because of the deterioration rates can vary significantly depending on the failure type.
Therefore, this paper considered two main objectives: (i) identifying and quantifying physical and environmental explanatory variables for the structural state of urban drainage networks in a pilot study in Bogota (Colombia); and (ii) identifying possible improvements in the inspection process itself, thus increasing the success rate in detecting structural failures, given the resources currently allocated for CCTV inspection.
Data and Methods
This pilot study was performed in the segment of the sewer network of the city called Zone 1 (See Figure 1), with a total pipe length of 2091,3 km, for which inspection data during 2008-2010 collected by means of two tele-operated CCTV equipment were available. Total inspected length is 98,4 km of sanitary, storm and combined sewer pipes (2267 surveys) chosen arbitrarily, corresponding to 4,7 %% of the total length of the sewer network. The inspection records used in this study were originally collected to directly assess the state of the pipes and for maintenance planning according to the NS-058 standard (EAAB, 2001).

Each inspection record contains the following information: the date of the inspection, identification of the pipe, network type, length, diameter, material, state of the road, weather conditions, a field identification of the upstream and downstream wells, and the severity and type of operational or structural failures. These failures found by CCTV inspections were identified following the NS-058 standard. Figure 2 and Table 1 present the frequencies and descriptions of each type of failure. The most frequent defects were connection defects, displaced joints, flow in connections and fissures, cracks or fractures. The less common defects were the presence of pests and introduction of seal material into the pipe.


The inspection dataset is summarized in Figure 3, showing scatter density diagrams between the variables of interest for the 2267 surveys.

Three groups of linear regression models were proposed to establish the relative influence of the physical and environmental factors on the structural state of the pipes. In Group I, the output variable is the structural score. This score is intended to reflect the cumulative effect of several defects occurring simultaneously in a pipe segment. In Group II, the output variable is the structural score of a particular defect, intended to predict the severity of a specific point of damage. Group III takes into account defect scores as output; however, the defects are differentiated by the type of failure, e.g. fissures, cracks or fractures. Even if nonlinear behaviors can be identified using statistical methods, these models are proposed as the simplest way to identify linear relationships between the physical and environmental factors and the structural condition of the pipes, thereby determining the explanatory variables. A summary of the model templates is given in Table 2.
Table 2 Groups of models (I, II and III) and variables (a, b, c and d) evaluated to identify structural and environmental explanatory variables of the sewer pipes

Source: Authors
For each model group, linear regression analysis was performed to explore and quantify the relationships between the dependent variable Y (the structural score) and each of the independent random variables xi: diameter, material, network type and area type. The structural score (Y) is the rating of the failure type and its severity observed during CCTV inspection according to the local standard NS-058 (EAB, 2001).
The purpose of the regression analysis was to find, among all the possible available explanatory variables, those that best explain the dependent variable. To determine whether the association between xi and Y was significant statistically, the following hypothesis was tested with a level of significance < 0,05: Ho, the regression coefficient of a variable is equal to 0; H1, the regression coefficient is not 0. The regression models for the qualitative variables, such as pipe material and network type, use dummy variables that take values of 0 or 1 to sort the data into mutually exclusive categories. The regression model with m categories takes the following form:

Equation (1): Regression model
Where Di are the variables defined as 1 if X is within a given category i (for instance, if material = concrete), and defined as 0 otherwise. Therefore, the dummy-variable coefficients γi represent the differences between each of the categories and the reference category m, whose estimate is given by α. Once a statistical association between a variable and a category is found to be statistically significant, the estimates of γ or, conversely, the slope are compared to determine the relative importance of the explanatory variable to the structural state of the pipe. For each model, it was verified that the number of elements in a given category i was greater than 30 to improve the consistency of the sample sizes. As a result, some models excluded some categories because of this sample size requirement. (i.e., materials such as polypropylene, polyethylene, etc.)
Results and Discussions
Figure 4 and Table 3 shows the results of the models for the prediction of the structural state of a pipe segment (Group I). The regression results show that several categories have a significant correlation with the pipe's structural score (p-value < 0,05). Based on the slope estimates, the most important factors are (i) material type: stoneware (slope estimate = 58,3) or PVC (31,5); (ii) network type: sanitary (52,8); and (iii) area type: green (41,4). Additionally, a greater prevalence and frequency of failures for small-diameter pipes, especially those smaller than 500 mm (20 in), was observed. In contrast, the factors that did not show a significant level of association with the structural state of the pipes include material type (masonry), the network type (combined), and the area type (unpaved).

Source: Authors
Figure 4 Models in Group I. Structural score of pipe = f(xi); a) x1: material, b) x2: diameter, c) x3: xarea type y and d) x4: network type.
Table 3 Regression summary -Models in Group I

Significance codes: *** = 0, ** = 0,001, * = 0,01
Source: Authors
Figure 4 and Table 4 shows the results of the models for Group II. Some categories for all the explanatory variables show significant correlation with the defect scores. However, the most important relationships found with the structural scores of the defects were (i) material type: PVC (slope estimate = 23,3) or stoneware (20,4); (ii) network type: sanitary (24,1); and (iii) area type: green (26,6). Conversely, materials such as masonry, concrete and brick did not show a significant level of association with structural pipe defects. The above results support conclusions reached by previous studies such as one by Salman (2010).
Table 4 Regression summary -Models in Group II

Significance codes: *** = 0, ** = 0,001, * = 0,01
Source: Authors
Figures 5 and 6 (Table 5 and 6) show the results of the Group III models. Unlike the two previous model groups, the area type (paved, uncovered or green) was a significant explanatory variable (p-value < 0,05).

Source: Authors
Figure 5 Models in Group II. Individual defect score = f(xi); a) x1: material, b) x2: diameter, c) x3:network type and d) x4: area type.

Source: Authors
Figure 6 Models in Group III. Failure type 1115: Displaced joint (n = 437). Score = f(xi); a) x1: material, b) x2: diameter, c) x3: network type and d) x4: area cover.
Table 5 Regression summary -Models in Group III (Failure type: 1115)

Significance codes: *** = 0, ** = 0,001, * = 0,01
Source: Authors
Table 6 Regression summary - Models in Group III (Failure type: 1112, 1123, 1113, 1121
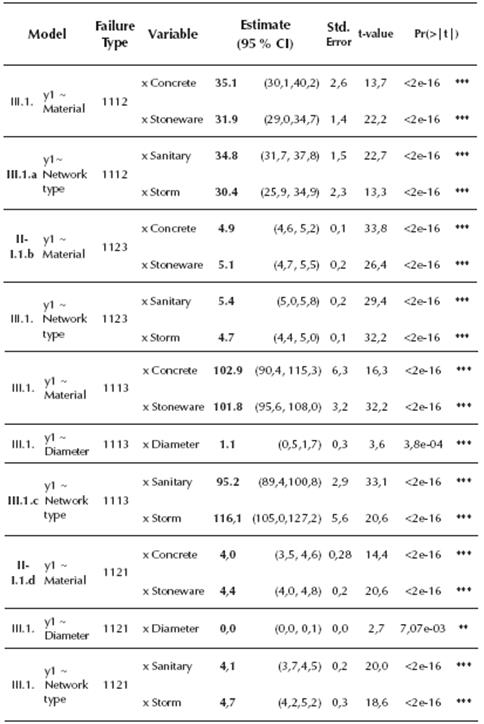
Significance codes: *** = 0, ** = 0,001, * = 0,01
Source: Authors

Source: Authors
Figure 7 Other models in Group III. Significant associations with other types of failures: 1112: Crack or fracture, 1123: Deposits stuck, sediment or soil entering, 1113: Breakage or collapse, 1121: Obstruction by connection.
These figures and tables shows that the material, diameter and network type did not show a significant level of association with the failure type 1.1.1.5 - displaced union. For less common failure types (Figure 1), the area type (faults 1.1.1.2 and 1.1.2.3), the network type (faults 1.1.1.2, 1.1.2.3, 1.1.1.3 and 1.1.2.1) and the diameter (faults 1.1.1.3 and 1.1.2.1) showed high levels of significance.
The prioritized explanatory variables are summarized in Table 7. This table provides a two-level guide for sewer inspection planning. The first level is based on the existence of a statistically significant relationship between the variables and the structural condition of the pipes. The second level is based on the relative importance of the explanatory variables using the magnitude of the slope. From the results of the second level in Table 3, sanitary sewers, VCP, small diameters and green areas correlate with the worst structural states, and therefore should be targeted for future inspections. Level 1 in Table 3 gives additional categories that should be considered during further development of the inspection process, i.e., PVC pipes, storm networks and paved areas.

Conclusions and Recommendations
This pilot study identified and quantified explanatory variables associated with the structural and structural defects of urban drainage pipes. This identification is intended to guide sewer inspections and not to predict the condition of pipes used for different purposes (i.e., failure modeling - see Ana & Bauwens, 2007 for more information). Statistically significant associations (obtained by linear regressions without interactions) between the occurrence, magnitude and type of sewer pipe defects were found in the data from 2291 CCTV inspections compiled by the Water and Sewerage Company of Bogotá (EAB).
The primary explanatory variable identified is the material type. There is a significant relation between stoneware (VCP) and PVC and the severity and number of failures identified in a pipe. The association of these two materials with both the general structural state of a pipe and the gravity of a specific failure was verified with a confidence level higher than 95 %. In addition, for stoneware (VCP) and PVC, the average number of failures found by inspection was 1,10 and 0,64, respectively, which is higher than the mean of the entire sample (0,50). The other materials had a considerably lower average number of defects per inspection (0,22 and 0,07 for concrete and masonry, respectively).
Additionally, despite the fact that the dataset included more inspections of concrete pipes (1331) than other materials (660 for VCP and 156 for PVC), most of the failures were in the latter. Thus, the effectiveness of the inspections can be increased if material type is included as a primary criterion for selecting assets to inspect. In the analysis of the specific types of faults, it was found that PVC is significantly associated with pipe breaking and cracking, while brick is associated with deposits and sediments.
Diameter was also identified as an explanatory variable. The analysis of the data shows a higher incidence and frequency of failures in small-diameter pipes, especially those with diameters less than 500 mm (20 in). This should also be a determining factor in the planning of inspections.
The other variables had a lower level of association with the structural condition of the networks. However, from the analysis performed at the level of specific failure types, it was possible to identify some relationships between variables such as the type of surface (paved, unpaved or green) and the network type (sanitary, storm or combined) with failures such as cracks and fractures, deposits, breakages and obstructions.
The analysis presented in this paper shows that through data currently collected by EAB, it is possible to establish explanatory variables for the infrastructure that can optimize the use of resources in the inspection process. This methodology and these results demonstrate that information available from sewer inspections can be used to identify inspection priorities, regardless of the completeness of the data or its coverage of the studied sewer network, which is important for asset management in developing countries. The identification of explanatory variables could reduce uncertainty for interventions in the drainage network and could also provide tools for better planning of future inspections with a higher success rate.
Nevertheless, this study does not analyze some variables proposed by other authors (i.e., Chughtai & Zayed, 2008), such as the depth and the age of the networks, because of the limited information currently available in the CCTV inspection datasets. Additionally, this study did not use other deterministic (Salman & Salem, 2012), probabilistic (Sinha & McKim, 2007) or expert-based (Tagherouit et al., 2011) tools explored by other authors, nor did it take uncertainties in the overall condition assessment into account (Dirksen et al., 2011). However, the results demonstrate the possibility of increasing the success rate in detecting equipment failures through inspections by adopting a prioritization scheme based on explanatory variables. Additionally, in light of the results, the authors recommend that EAB further develop the methodology presented in this paper by including in their datasets all the physical information available in other datasets, such as pipe class, age and slope, as well as street categories and construction conditions, which are identified as relevant variables in related studies (Salman & Salem, 2012; Ana & Bauwens, 2007; Chughtai & Zayed, 2008).

