


 English (pdf)
 Article in xml format
 Article references
 Send this article by e-mail
 Cited by SciELO
  Cited by Google
  Similars in
SciELO
Similars in
SciELO  Similars in Google
 Permalink
1. Introduction
Machine Prognosis according ISO 13181 - 4 [1] “is the convenient process that allows to estimate the Remaining Useful Life (RUL) of the system and thus taking appropriate decision”.
In recent years research in machine component prognosis has been increasing due to the understanding of the importance of prognosis in Condition Based Maintenance (CBM). Beyond corrective and preventive maintenance there is a wide research field in predictive maintenance where the Remaining Useful Life (RUL) of machine components is calculated based in data from the normal operation or through system mathematical modeling.
There are three principal techniques in machine prognosis [2,3]. The first one is based in vibration data or any measure data from the component studied, this variable permits the formulation of a data-based model which could be probabilistic or AI based. The second technique is model-based prognosis, here a residual is calculated from the real signal and the mathematical model of the system and there must be a degeneration modelling of the material or the machine component. The third technique is experience-based. Different reliability models are used as Weibull, exponential or another probability distribution which estimates the RUL of the component studied.
The Prognostics Data Repository from NASA was used in IEEE contest in 2012 which rewarded the team with the minor error percentage in ball bearing RUL estimation. Sloukia et al. [4] used Mixture of Gaussians-Hidden Markov Models (MoG-HMM) and Support Vector Machine (SVM) with accuracy superior to 99%. Another approach used by Mosallam et al [5], is Empirical Mode Decomposition (EMD) to discover the trend in the failure evolution with an absolute error of 0.0751. Li and Wang used Logistic Regression Model (LRM) to define a reliability model. The error from the RUL estimation is 4.77%. Most of these techniques are mathematical and time computing demanding. The aim of this work is the RUL estimation based in the simplest as possible GP implementation. This permits the future implementation in online industrial schemes.
The Gaussian Processes (GP) technique shows an interesting application, establishing a probabilistic model over data, adjusting an underlying function for posterior bearing prognostics. This procedure is simplest than most of the previous works, showing an elevate accuracy in bearing RUL and speed in computing.
In section 2 the mathematical formulation of Gaussian Processes for regression and classification is briefly explained.
In section 3 the application of GP’s technique in prognosis is shown comparing the RUL estimation error with the actual RUL results from the full data basis.
Finally, Section 4 discusses the results of the methodology applied to mechanical vibration signals of ball bearing failure.

2. Time - frequency features
Several time-frequency features can be used in a prognostics scheme. The aim of this part in methodology is the identification of the process most defining characteristics. However there are many dimensionality reduction methods e.g. Principal Components Analysis (PCA) or Independent Component Analysis (ICA), the purpose of this work is use all the amount of features in RUL identification.
Table 2 shows the time domain features with their formulae and Table 3 shows the features in frequency domain which consist in energy by frequency bands. The bands are related to the defects in rotating machinery. First band is associated with misbalance, alignment problems and cage deterioration. Second and Third band are associated with the harmonics of alignment problems and mechanical looseness. The Fourth band encloses outer race problems (BPFO) and the Fifth band is used to detect inner race problems (BPFI) [10]. The frequency bands are especially calculated in relation with analyzed ball bearing.


3. Gaussian processes
A Gaussian Process can describe a system response or stochastic process according to a normal distribution or Gaussian distribution, where the mean and covariance function depends of the training data. “Gaussian process is a collection of random variables, any finite number of which have a joint Gaussian distribution” [6]. This means that any function sample from the GP has a Gaussian distribution.
A Gaussian process is completely defined by its mean function m(x) and covariance function 𝑘(𝑥,𝑥′). Furthermore, a Gaussian process is a probability distribution over functions, whereas a Gaussian distribution is a distribution over vectors.

If 𝑓 𝑥 refers to a real process the mean and covariance functions can be defined as


A prior probability function over the GP is defined. This prior probabilities define what kind of functions are expected to be observed, before seen any data and are chosen in advance. After adding training points the mean and covariance chance and the probability distribution is called the posterior over functions and is again Gaussian.
A covariance function is a semi-positive definite function that measures the similarity between pairs of points over the input space D. Such functions are used to compute the so-called Gram matrix or kernel matrix. Some covariance functions are the Squared Exponential (RBF kernel) expressed as

Where l corresponds to the length-scale; and the Mátern Class given by

where 𝑟= 𝑥− 𝑥 ′ , ?? and 𝑙 are positive parameters and 𝐾 𝑣 is a modified Bessel function. Common cases of 𝑣 are 1 2 , 3 2 , 5 2 In the case of 𝑣=1/2 and 𝐷=1 (𝑥 dimension) this kernel function is called Ornstein Uhlenbeck kernel (OU-kernel).
Using 𝑁(0,𝐾) as GP prior over the functions 𝑓(𝑥) and a likelihood function given by 𝑦 𝑥 =𝑓 𝑥 +𝜖 (where 𝜖 ~𝑁(0, 𝜎 𝑛 2 )) and using Bayes theorem, it is possible to obtain a predictive distribution for a set of new inputs 𝑋 ∗ ,

where

and the covariance

Here 𝐾(𝑋, 𝑋) is the covariance function evaluated on the training set 𝑋, 𝐾( 𝑋 ∗ , 𝑋) is the covariance of the training and test sets, 𝐾( 𝑋 ∗ , 𝑋 ∗ ) is the covariance of the new inputs and the parameter σ n 2 represents the variance of the noise.
The estimation of the covariance function parameters is performed by maximizing the marginal likelihood by a gradient-descent algorithm. The log marginal likelihood is given as

Where y are the outputs corresponding to the inputs 𝑋, ∅ represents the parameters and 𝛴= 𝐾 𝑋,𝑋 .
4. Experimental setup
Data sets were provided by FEMTO-ST Institute. Experiments were carried on PRONOSTIA, an experimental set up designed to implement an accelerated degradation of ball bearings, under some constant operation conditions [7].
The datasets consists basically in two groups: one for training, with ball bearing vibration signals from health to failure and a second group with a truncated sequence of ball bearing vibration from health to failure.
Additionally there are three different operation conditions with different motor speed and radial load. Condition 1 consists in 1800 rpm and 4000 N, condition 2, 1650 rpm and 4200 N and condition 3, 1500 rpm and 5000 N.
The ball bearing characteristics are described in Table 4. Additional information about the set-up, e. g. transducers, data acquisition systems are found in [8]. Fig. 1 shows the PRONOSTIA set up.


4. Final comments
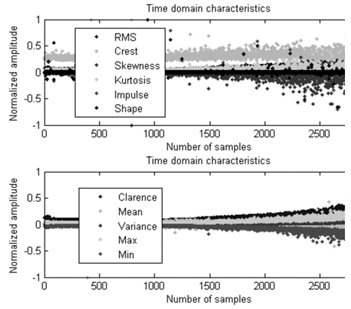
The aim extracting several characteristics from data basis is the search of trending in bearing vibration signals. In this work features in time and frequency domain has been extracted. Fig. 2 and Fig. 3 shows the features for every vibration signal in the training set for Bearing 1_1. It means the first bearing with the load condition number 1 from health to failure. The Bearing 1_1 data set counts with 2803 vibration signal. It can be shown some trending in some features like kurtosis, RMS value, Clarence factor, max value, min value and the fourth and fifth energy frequency bands, which increase its magnitude with operation time. This is the base for the Gaussian Process regression that permits the RUL estimation.

To keep the methodology simple, one of the features extracted is chosen for modelling the bearing degradation. The Gaussian Regression is done for all the features, and the chosen one, is which better fits the GP model with the minimum variance in the regression.
The regression model input is the feature vector, and the output is the normalized vector with the number of the signal in the sequence of degradation bearing i.e. number 0 for the first healthy bearing signal and 1 for the last signal with the bearing in failure. Thus, in the abscissa axis the feature value is shown and the ordinate axis shows the number of the signal from health to failure.
Fig. 4 shows the GP regression for data basis maximum value. The last values show an enormous variance which makes the model poor and gives mno confidence to the RUL estimation.

Fig. 5 shows the kurtosis GP regression, chosen because the model fits the data basis trending.

For RUL estimation the model for training data basis set, is established in every bearing. Subsequently, the test data basis set is evaluated taking care of operation conditions. It means that the ball bearings with operation condition number 1 are evaluated with the GP model of operation condition number 1. For this data basis there are three operation conditions which change the motor speed and radial load. Full data basis description can be shown in [8].

Once the test data is passed through the model, the RUL is calculated considering the output as a percentage of the bearing life. Every value from the input feature vector gives a percentage value, for this work, the RUL is calculated by two ways. First using the mean of the output last values, and second with maximum output value. Later, the total bearing life time is calculated with the number of vibration signals 𝑁𝑣𝑠 and the elapsed time between data acquisitions 𝑇ba over the value extracted from the GP regression vector. The best estimate is chosen from those two values.

The bearing RUL estimation is

The error percentage is calculated using the GP RUL estimation and the actual RUL from the complete data basis.

The squared exponential kernel (SE kernel) or Gaussian kernel is defined by

If ∑ is diagonal, this can be written as

We can interpret the σ j as defining the characteristic length scale of dimension j. If σ j =∞, the corresponding dimension is ignored; hence this is known as the Automatic Relevance Determinator ARD kernel.
5. Conclusions
The study of machinery prognostics is an important issue in this work due to the impact of maintenance in industry costs. This work gives a step towards the on line ball bearing prognosis, developing a simple and fast computing methodology.
In this paper we have provided a methodology for ball bearing prognosis using Gaussian Processes. To keep the methodology simple one of the time frequency features is selected, which better fix the GP regression. A deeper issue using all calculated features is the computing time and the loss of accuracy in the RUL estimation. One possible approach to this problem could be the use of a dimension reduction algorithm such as Principal Component Analysis (PCA) or Linear Discriminant Analysis (LDA) due to many calculated features are mathematical combination of others. Thus, this methodology is applicable to this kind of ball bearing but more research adjusting parameters like the kernel function or feature selection can be done to improve the RUL estimation.

