1. Introduction
Development requires efficient management of water resources and regions such as the semi-arid in northeast Brazil present important water management problems. The region has very specific climatic characteristics, such as being prone to drought, and therefore has a high exposure to agricultural losses that lead to food insecurity [2]. Studies of climatic conditions, especially those related to the water balance, are of great importance [1] and could help overcome these challenges.
The scarcity of climate data - in quantity and quality - has been a problem in water resources modeling, as conventional weather stations with adequate spatial and temporary distribution are not always available; especially in developing countries. Also, when data exist, they may not be reliable due to gaps or random errors, and may not represent the climate of a river basin [3-5]. Therefore, alternative data sources are needed to better simulate hydrological processes [6].
Much of the current climate knowledge was obtained from global reanalysis data. The reanalysis, or retrospective analysis, consists of forecasting models and a data assimilation routine [7]. The reanalysis data set of the Global Forecasting System of the Climate Forecast System Reanalysis (CFRS) of the National Centers for Environmental Prediction (NCEP) can be a valuable option for forecasting, where conventional measurements are not available [7,8]. The use of CFSR data in basin modeling could be reliably applied and offers new opportunities in real-time modeling [4].
CFSR data set contains historical precipitation and temperatures for each hour anywhere in the world; being produced using state-of-the-art techniques (conventional meteorological observations and satellite irradiations) [10,4]. It is based on a fully coupled ocean-atmosphere model, which uses numerical weather forecasting techniques to assimilate and forecast atmospheric conditions with a resolution of 0.3125 (~ 38 km); also, the forecast models are restarted every 6 hours using information from the global weather stations network and satellite products [10,4]. The production involves various spatial, and temporal interpolations on meteorological data, other conventional observations and satellite products [3].
The advantages of CFSR over conventional data are that it provides complete climate data sets and has useful parameters for the use of Penman Montieth and Priestley-Taylor equations [11]. Data can be obtained at http://globalweather.tamu.edu/ from SWAT (Soil and Water Assessment Tool) - Texas A&M (TAMU) in the SWAT input format [5]. In addition to global spatial coverage, the CFSR offers a complete, continuous, and consistent record from 1979 to the present, providing a record of estimates of variables of limited availability such as solar radiation, air humidity, and wind speed [8]. This could allow a comprehensive modeling of watersheds in regions with non or missing data [12].
According to [13], compared to the previous NCEP reanalysis (R1 and R2), there are three major differences with the CFSR, such as 1) higher horizontal and vertical resolution (horizontal spectrum T382, ± 35 km); 2) a forecast generated from a coupled ocean-ice land-atmosphere system, and 3) historical assimilations of satellite radiation. Different studies demonstrated the applicability and satisfactory performance of the hydrological SWAT model with CFSR data in regions with scarce data [18]. As [8] in Ethiopia; [4] in the United States, using precipitation and temperature data, obtaining discharge simulations as good or better than models using traditional meteorological measurements, when CFSR data are calculated over an area comparable to watershed areas; [7] concluded that the CFSR provided the best correlation in three regions of South America compared to other sets of reanalysis; [14] used CFSR data as input variables to the WXGEN data simulator in a basin with limited data, obtaining a satisfactory fit for the simulation of agricultural practice scenarios; [9] determined that the CFSR simulation was able to generate acceptable accuracy in China, making a previous validation with terrestrial MS data to confirm sufficient accuracy.
In Brazil, different investigations used CFSR data with the SWAT model, such as [15], demonstrated the possibility of using observed data and reanalysis jointly, where there was a deficiency of information or stations; [5] evaluated precipitation data, obtaining better performance in flow simulation (best statistical values) compared to other data sets, recommending that the use of CFSR data for variables other than precipitation, can provide reasonable hydrological responses; [6] also used data from local stations jointly with CFSR data, obtaining satisfactory results; [2] they evaluated CFSR data to reproduce temperature and rainfall extremes using climate indices and [13] observed remarkable improvements in large-scale precipitation patterns compared to previous reanalysis.
It is therefore noted that different authors highlight the importance of testing with reanalysis data to verify whether climatic characteristics represent specific local realities, especially in dry and data-poor areas [28]. In that sense, with the present study, the objective is to evaluate the performance of NCEP-CFSR data in the prediction of climate data in two mesoregions in the Pernambuco Semiarid, comparing them with observed data from local meteorological stations.
2. Materials and Methods
2.1. Geographical location
The study was developed with information from local weather stations (EM) belonging to the observation network of the National Institute of Meteorology (INMET). The 4 municipalities under study are located in the State of Pernambuco in Brazil, between the parallels 7º18'17" and 9º28'43" south latitude; and the meridians 34º48'15" and 41º21'22" west longitude, in the northeast of Brazil. The characteristic climate of the region is classified as BSh - hot semi-arid (steppe) climate - according to the Köppen Climate Classification - (average annual temperature > 18 ºC) [13].
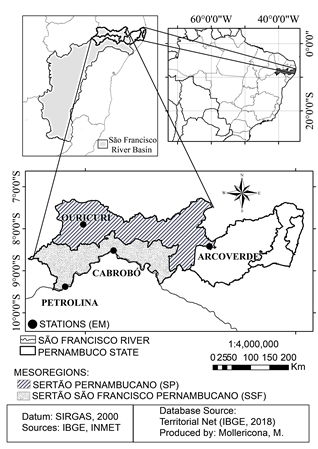
The stations are located in for municipalities, in the São Francisco River Basin and distributed in two mesoregions: Sertão of Pernambuco (SP) and Sertão of São Francisco Pernambucano (SSF), Table 1 and Fig. 1. The data sets were: minimum, average, and maximum temperature (Tn, Tm, Tx, °C), relative air humidity (HR, %), wind speed (Vv, m s-1), global solar radiation ((RS, M J m-2), precipitation (P, mm) and potential evapotranspiration (ETo, mm).
Source: The Authors.
Figure 1 Location of weather stations (EM) in the 2 mesoregions: Sertão of Pernambuco, SP (Ouricuri and Arcoverde) and Sertão of São Francisco Pernambucano, SSF (Petrolina and Cabrobó)
Table 1 Weather stations (EM) under study in the two mesoregions: SP: Sertão Pernambucano, SFF: Sertão do São Francisco Pernambucano

Source: The Authors.
EM data were compared with (global) reanalysis data (NCEP-CFSR), selected over the same areas, obtained for 35 years (1979 to 2014) through the portal: Global Weather
Data for SWAT (https://globalweather.tamu.edu/) available from Texas A&M University. Data is provided in the SWAT file format, with a horizontal resolution of ~38 km (0.3125°) and global coverage [10,15]. Reanalysis data are obtained from state-of-the-art data assimilation techniques (observations from conventional weather stations such as satellite irradiations) as advanced components of atmospheric, oceanic, and surface modeling [9]. They include daily precipitation, temperatures, air humidity, solar radiation, and wind speed, provided on a Gaussian grid defined by the NCEP (designated T382), longitudes are equally spaced, but latitudes are not [10].
2.2. Methods
In the initial evaluation, box plotting techniques (boxplots), 1:1 dispersion, time series were used, which allowed a visual comparison and are essential for proper evaluation of models [16]. The analysis also included a comparison with central tendency and variability statistics. A regression analysis was performed with the correlation (r) and determination coefficients (R 2 ); an analysis with non-dimensional indices such as the Willmott Concordance Index (d) and the Nash-Sutcliffe Efficiency Index (NSE); along with error rates such as Mean Absolute Error (MAE), Root Mean Square Error (RMSE), Percent Bias (PBIAS), Standard Deviation Rate (RSR), eq. (1)-(7). Regression coefficients determine the strength of the relationship between two databases, dimensionless techniques provide an assessment of the goodness of the relative adjustment, and error rates quantify the deviation of units from the data of interest [17].
Where n is the number of observations, Pi refers to the values of the meteorological variable obtained in the NCEP-CFSR database, and Oi is the data observed in the EM.
R 2 and r describe the degree of collinearity between the simulated and measured data [17]. The values of r vary from -1 to 1 and is an indicator of the degree of the linear relationship between two data series; R 2 varies from 0 to 1, with higher values indicating less error variation, and generally values higher than 0.50 is considered acceptable [17]. The r values were classified according to [18]. The NSE [19] widely used in climate forecasting, varies from -∞ to 1, is more rigorous than R 2 [20], and determines the relative magnitude of the residual variance, indicating how well the observed and simulated data graph fits on the 1:1 line 1:1 [17,20,21] propose the classification: NSE=1 as "perfect fit"; NSE ˃ 0.50 "satisfactory". Although the same authors consider that between 0 and 1 are generally seen as "acceptable" and <0 as "unacceptable".
Willmott's concordance index (d) [23] measures the degree of error-free prediction, ranging from 0 to 1 as "perfect concordance". To support the analysis, the performance index (c) [24,25] was calculated, which is the product of the correlation coefficient r and d, classified according to [24].
PBIAS (expressed as a percentage) measures the average trend of simulated data to be higher or lower than its observed counterparts, with the optimal value being 0 and low values indicating accurate simulation; positive values indicate underestimation bias and negative values indicate overestimation [17]. “Good performance” values are for 10% < PBIAS < 15% and "unsatisfactory" when the PBIAS ≥ 25%. The RSR varies from 0 for "perfect simulation" (RMSE=0) and the lower the value, the lower the RMSE, so the performance of the model is considered better [17]. Values of MAE and RMSE equal to 0 indicate "perfect fit". The degree to which RMSE exceeds MAE is an indicator of the extent to which outliers exist in the data [26].
3. Results and Discussions
Initially, results for precipitation are presented and discussed. Later, the other variables are analyzed.
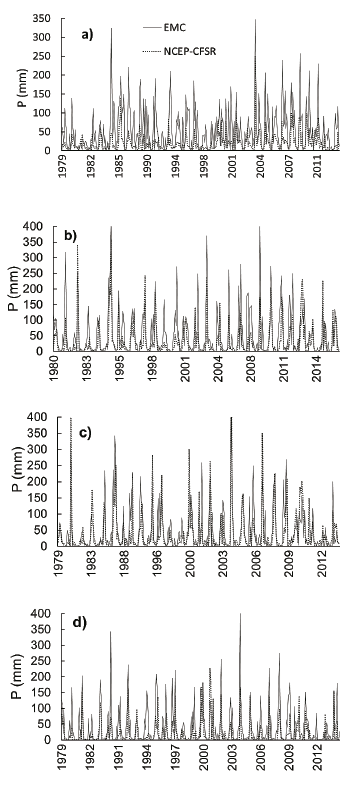
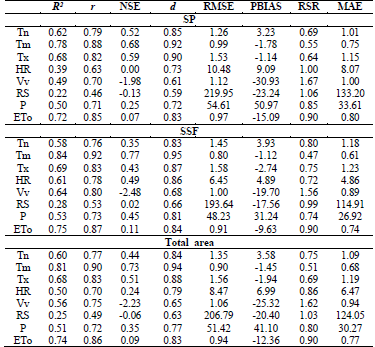
In Fig. 2 it can be seen that NCEP-CFSR reanalysis data tend to underestimate EM precipitation in the SP mesoregion; similarly, to Petrolina (SSF mesoregion). The PBIAS (Table 2) agrees with the graphic observations, being that, for all areas, their values are positive, indicating an underestimation bias [17]. The highest PBIAS values correspond to SP (50.97).
Source: The Authors.
Figure 2 Time trend of monthly precipitation (mm) derived from EM and NCEP-CFSR for a) Arcoverde, b) Ouricuri, c) Cabrobó and d) Petrolina. Period 1979 - 2014
Similar results were obtained by [3] who obtained that the CFSR showed more than 50% underestimation of P, in 37% of the sub-basins of the area under study, demonstrating that the CFSR does not represent P in most areas of a basin.
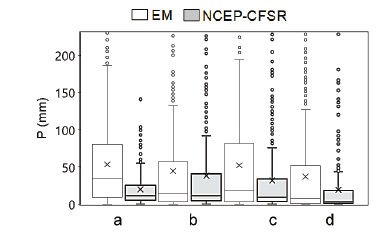
In Fig. 3, using the boxplot diagrams of the P in the EM and the NCEP-CFSR, located in the 4 areas studied, the presence of discrepant values (outliers) for all the data sets can be seen, as well as large differences in the maximum values between the two databases. It is also noted that the interquartile interval is lower for NCEP-CFSR data in all areas, which means a lower degree of data dispersion compared to EM data. In Table 2 the statistical metrics such as correlation r were close, being lower for Arcoverde and Petrolina (0.67 and 0.72), the other areas coincided equally with the value of 0.74; being classified as "high" and "very high". These results are higher compared to results obtained in other regions of South America such as Bolivia, according to the study of [30] that obtained values of r < 0.3.
Source: The Authors.
Figure 3 Precipitation (P) boxplots (mm) in the 4 areas understudy: a) Arcoverde, b) Cabrobó, c) Ouricuri and d) Petrolina with data from EM and NCEP-CFSR
On the other hand, the performance according to the NSE was very low for Arcoverde (0.04) and "satisfactory" for the other 3 areas (0.48; 0.47 and 0.41). However, all these results were higher than those obtained by [28] (NSE= -2.02) in a region inserted in the Mata Atlántica biome.
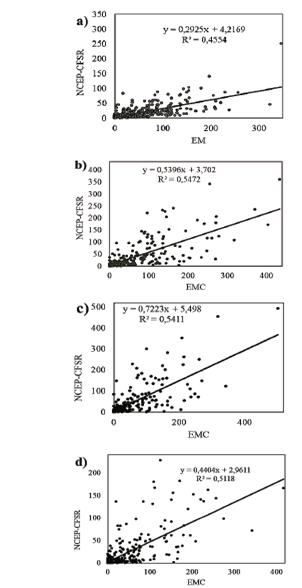
The determination coefficient R 2 (Fig. 4) obtained was qualified as "acceptable" according to [17] for Ouricuri (0.55), Cabrobó (0.54) and Petrolina (0.51). At mesoregional level (Table 2) it is observed that the values of R 2 are also "acceptable" for SP (0.50) and SFF (0.53), therefore, the value obtained for R 2 for the total area (0.51) is also considered "acceptable". [29] also analyzed CFSR precipitation data in a region characterized as semi-arid, in Paraiba State, and obtained R 2 values between 0.51 and 0.99 and NSE between 0.40 and 0.99, observing that the applicability of CFSR data for hydrological studies is demonstrated.
For the MAE and RMSE (Table 2), which indicate the error in the units of the parameter of interest - in this case the P - it is observed that SP presents the highest values (33.61 and 54.61 respectively) than SSF. These results coincide with those proposed by [31] on which stations likely affected by convective rainfall, have a better correlation coefficient and a smaller RMSE, being that the SSF mesoregion is at lower altitudes than SP. According to Willmott's concordance index d, related to the distance of observed with respect to the estimated values, which varies from 0 to 1 for no concordance and perfect concordance, respectively; it was obtained that the best result was for SSF (0.81) in comparison with SP (0.72).
Table 2 Statistical performance indicators of the comparison of variables from weather stations (EM) and NCEP-CFSR reanalysis data, in the mesoregions Sertão Pernambucano (SP) and Sertão do São Francisco (SFF)
Source: The Authors.
Regarding the performance index c, for SP, the category "bad" and for SFF "low" was obtained.
Regarding the distribution effect -CFSR (predicted precipitation by grid) and stations (point ground observation)- [31] observed that the performance of the precipitation estimates from the MPEG and CFSR satellites for both point to point and areal comparisons (interpolated observed rainfall stations) was better than that of the precipitation amounts from the TRMM satellite.The study [5] compared inputs from the SWAT climate generator (G1), local stations (G2), NOAA's CFSR (G3), and NOAA's CFSR + local rain gauges (PL), obtaining similar values in the simulation of the SWAT water balance components for mean annual precipitation and potential evapotranspiration.
Source: The Authors.
Figure 4 Comparison of monthly P (mm) between EM and NCEP-CFSR for a) Arcoverde, b) Ouricuri, c) Cabrobó and d) Petrolina. Period 1979 to 2014
In that study, the performance of potential evapotranspiration (ETo) simulation with Penman-Monteith (PM), Prestley-Taylor, and Hargreaves methods, with CFSR + PM data obtained values of NSE ˃ 0.75, classified as "satisfactory" to "very good". [6] they also found that the use of CFSR + data from local stations improved statistics in sub-basins with few river stations or with substantial missing data. The authors indicate that the differences found could have occurred due to the semi-arid climate of the region, with strong seasonal and interannual variability in rainfall, which could result in poorly calibrated CFSR data at local stations. In that sense, the authors suggest the use of CFSR data for climate parameters other than P (which are generally less reliable in quantity, and spatial distribution), together with P data from local rain gauges to provide reasonable simulations of hydrological response in the semi-arid region. These results can be supported by [4], which indicates that in basins that are relatively arid or dry areas, hydrological modeling is more difficult; possibly because large runoff events are triggered by small, localized P events. Which are not represented by coarse-scale CFSR or EM data. [13] also supports that CFSR data exhibit a dry bias along the South American coast and the east coast of northeast Brazil. On the other hand, [12] suggest carefully checking the CFSR data against conventionally measured data climate stations.
The respective results and discussions for the other variables (Tn, Tm, Tx, HR, Vv, RS and ETo) are presented below.
Table 2 and Fig. 6 shows that the R 2 average for Tn, Tm, Tx, HR, Vv and ETo of the 2 mesoregions reached the R 2 value higher than 0.50 and recommended by [17]. But in the comparison at the mesoregion level, it can be seen that HR and Vv also achieve R 2 ˃ 0.50 in the SFF mesoregion. The R 2 value of the RS was less than 0.50 in the two mesoregions. The correlation coefficient r in the SP reached classification values of "moderate" for RS; "high" for HR and Vv; "very high" for Tn, Tm, Tx and ETo. In SSF, "moderate" for RS; "very high" Tn, Tx, HR, Vv and ETo, and "almost perfect" for Tm. For the total area. the classification was "moderate" for Tn, Tm, Tx, Vv and "very high" for ETo. Both at the mesoregion level and the total area, the RS presented the lowest values of r and R 2 .
The values obtained for the performance index c -which combines r and d indexes -with its respective classification are presented in Table 3, where it is highlighted that RS obtained the lowest performance classification (awful) for both mesoregions and the total area.
Table 3 Values of performance indicator c and classification for both mesoregions: Sertão Pernambucano (SP) and Sertão do São Francisco (SFF) and the total area
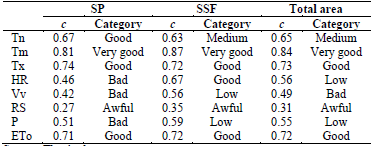
The Tm presented the best performance with the classification of "very good" for both mesoregions, compared to the other variables. The Tx and ETo were classified as "good" for all cases. The results obtained are supported by [20] which indicated that temperature and ETo data from all reanalysis data sets are better than expected from rainfall, since this parameter is more spatially and temporally variable than temperature.
Therefore, the results obtained in this study are consistent with the indices obtained for P. Using the concordance index, Tm (0.94) and Tx (0.88) stood out in both mesoregions as having the highest performance, followed by Tn (0.84) and ETo (0.83). The lowest performances corresponded to Vv (0.65) and RS (0.63).
As a function of the PBIAS (see Table 2), the Tn and HR presented positive values (underestimation bias) in the two mesoregions. together with the P; with the difference that the P exceeded the PBIAS ≥ 25% its performance being considered "unsatisfactory" its performance for this indicator. Negative PBIAS values (overestimation) within the range qualified as "good performance" corresponded to the Tm, Tx y la ETo. Considering that the optimal value of PBIAS is 0.0. and "good performance" is between 10% < PBIAS < 15%. the closest variables were Tm, Tx, Tn, HR and ETo in ascending order. As a result, the worst performances (PBIAS ≥ 25%) were shown by the Vv and P. The standards were similar for both mesoregion and total area.
NSE obtained for variables from reanalysis datasets range from -2.48 to 0.77, with the NSE of Vv and RS being generally less than zero. NSE ˃ 0.50 was obtained for Tn, Tm and Tx in the SP area and for Tm in SSF, being considered as "satisfactory" [17]. In the analysis for the total area, the Tm and Tx showed the best performances for this index. However, it should be noted that the same authors indicate that NSE values between 0 and 1 are generally considered "acceptable". Tn (0.44); HR (0.24); P (0.35) and ETo (0.09) are within this range. On the other hand, values of NSE<0.0, which are considered "unacceptable". were presented for Vv (-2.23) and RS (-0.06). The results from [2] concluded that CFSR data performed well in calculating TNx and TNn indices (maximum daily minimum temperature of each month and minimum monthly value of daily minimum temperatures. respectively) and support the results presented.
Regarding the RSR, the Tm obtained < 0.70 "satisfactory" values in the two mesoregions, along with Tx and Tn for the mesoregion SP. All other variables exceeded the limit recommended by [17]. The worst performance according to RSR was for Vv and RS. Few studies have been conducted on wind variability using reanalysis data. [27] evaluated the performance of the European Centre for Medium-Range Weather Forecasts (ECMWF), obtaining the following results: r=0.48, R 2 =0.23, RMSE=2.81 and for Petrolina r=0.74, R 2 =0.54, RMSE=1.44. By comparing the MAE and RMSE for Tn, Tm and Tx (°C) it was observed that Tm presents lower error values than Tn and Tx in the two mesoregions. By comparing RMSE and MAE between both mesoregions, it is observed that RMSE and MAE are higher in SP for Tm, HR, Vv, RS, P and ETo. RMSE and MAE are higher for SFF only in the case of Tn and Tm.
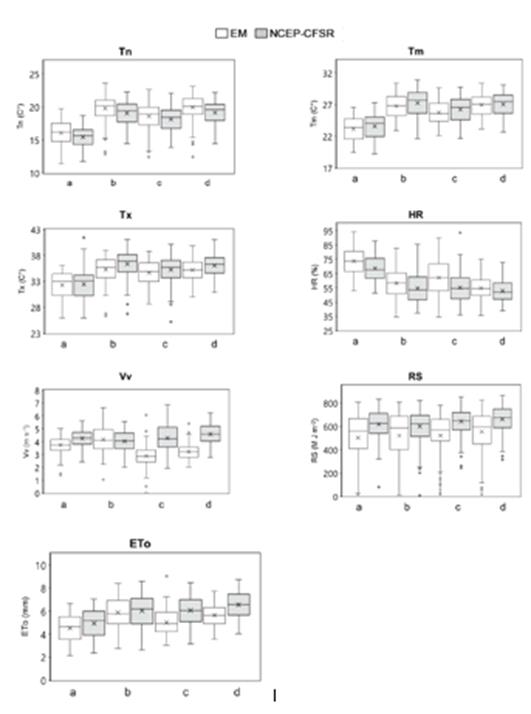
Fig. 5 compares the box plots of the variables Tn, Tm, Tx, HR, RS, Vv and ETo by comparing the EM and CFSR datasets, which generally shows that the medium of Tn, Tm, Tx and ETo agree better with the observed data. In each box plot, hollow dots represent extreme values. The box plots presented allow us to compare the minimum, maximum, first quartile, second quartile or internal line (representing the median) and third quartile values. The dispersion of the data is represented by the interquartile interval, which is the difference between the third quartile and the first quartile. The proximity between both sets is observed, with the presence of outliers in the case of the EM data for Tn in Ouricuri, Cabrobó and Petrolina; Tx in Cabrobó; Vv and RS in all areas and for ETo in Ouricuri. In the case of reanalysis data, outliers were only observed for Tx in Ouricuri and Cabrobó, and HR in Ouricuri, but for RS, all areas presented outliers.
Source: The Authors.
Figure 5 Box plots for the monthly time series (1979 - 2014) of Tn, Tx, Tm, Vv, HR, RS and ETo, of local station (EM) weather variables compared with NCEP-CFSR for a) Arcoverde, b) Cabrobó, c) Ouricuri and d) Petrolina
4. Conclusions
This study covers the period 1979 to 2014 and evaluates reanalysis meteorological data provided by CFSR-NCEP for two mesoregions: Sertão de Pernambuco (SP) and Sertão do Sao Francisco Pernambucano (SFF), of the semi-arid region of the State of Pernambuco, Brazil. Different statistical performance indicators were used in the evaluation and the main conclusions obtained are presented below:
The mean, minimum and maximum temperature (Tm, Tn, Tx) data provided by the CFSR-NCEP were the best performers according to the correlation and regression coefficients (r and R 2 ), the Willmott concordance index (d) and the Nash-Sutcliffe Efficiency index (NSE) in both mesoregions, compared to the other meteorological variables.
The potential evapotranspiration (ETo) also showed good performances for r, R 2 and d with the exception of NSE. Precipitation (P) presented acceptable performances for r, R 2 , d and NSE, although lower than those obtained from temperature data, since precipitation is more spatially and temporally variable than temperature. The same applies to relative humidity (HR), which shows acceptable performance.
No major differences were observed between the variables studied for both mesoregions using the root mean square error (RMSE), percent bias (PBIAS), standard deviation rate (RSR) and mean absolute error (MAE) indicators. CFSR-NCEP data do not represent the characteristics of solar radiation (RS) and wind speed (Vv) in the region, as both variables obtained the lowest performances for all indicators, except for R 2 and r in the SSF mesoregion.
Tn, Tm, Tx and ETo were the meteorological variables best represented by the CFSR-NCEP reanalysis data, followed by the P and HR.
This type of study contributes to the evaluation of the representativeness of reanalysis data in different mesoregions, and to the study and management of water resources in regions with low availability of meteorological data, such as the case of the Semi-Arid of Pernambuco. Future research to be developed includes the use of CFSR-NCEP reanalysis data in hydrological simulation models for basins in the region.


