1. Introduction
More and more people are living in increasingly polluted environments with less vegetation cover due to high urbanization levels [1]. As a consequence, there is an increase in environmental impacts, mainly related to thermal discomfort, worsening air quality, and increased noise pollution [2]. This type of pollution comes from the noise emitted by urban road traffic.
Noise levels can vary significantly over time and space, particularly due to changes in road and air traffic [3].
Excessive noise can cause several harmful effects, including both psychological and physical, to humans and biodiversity. Among the effects are: increased stress [4,5], changes in child development [1]; hearing damage, disturbance of sleep, disruption of communication activities, mental concentration, and discomfort [6]. Therefore, this factor should be treated as a public health issue [1].
Thus, noise has been reported in several types of studies which relate the presence of urban green areas with mitigation of the harmful effects of noise pollution on residents and biodiversity [1-4,7-10]. According to [11], vegetation constitutes the main element of the urban landscape structure, as it directly influences the improvement of well-being and quality of life of the population.
Urban parks provide numerous ecosystem services, ranging from relaxation and immune system enhancement to temperature and noise attenuation by reducing exposure to health risk factors [8-10]. Urban parks can attenuate noise levels by 4 to 5 dB (A) compared to other green area typologies, such as squares [2]. Therefore, planting varied vegetation typologies, including trees and shrubs in high density, can contribute to efficiently reducing noise levels in urban areas [12].
Thus, reducing noise pollution by vegetation present in urban green areas constitutes a regulating ecosystem service, which can be considered as a Nature-based Solution (NbS) for the urban environment [5]. Among the advantages of NbS is the ease with which they can be incorporated into the landscape [13].
However, information about the size, forest structure, and biophysical characteristics of these sites is still needed for planning and management of urban green areas [7]. It is known that sound can be reflected and scattered (diffracted) by plant components such as trunks, branches, and leaves; be absorbed; or destructively interfere with sound waves, mainly by ground cover [14].
In addition to vegetation characteristics, noise attenuation depends on the emitted level and distances to the emission source [2]. Although the presence of only a few trees may not be sufficient for efficient noise attenuation, one way to mitigate the propagation of sound waves is through barriers consisting of vegetation between the sources and receivers of noise [13].
However, knowledge on how ground cover and vegetation characteristics, especially in urban green areas, act as noise attenuating factors is still incipient [7,8,13-15], especially in Brazil.
Thus, in aiming to contribute to the knowledge about the capacity of urban green areas to attenuate noise, this study aimed to evaluate the relationship between the biophysical characteristics of two green areas of Curitiba, Paraná, Brazil, with the attenuation of noise propagation.
2. Material and methods
2.1 Study area
The study was developed in green areas located in the city of Curitiba, Paraná, Brazil. The city's ground zero is located at Praça Tiradentes, at latitude 25° 25' 40" south and longitude 49° 16' 23" west [16]. Curitiba is inserted in the First Plateau of Paraná and has undulated topography with gently rounded hills, giving it a relatively regular physiognomy [17].
Curitiba is inserted in a phytogeographic region of a boundary of Field (Grasslands) with the Araucaria Forest (Mixed Ombrophylous Forest), which compose the Atlantic Forest Biome [17,18].
It is a city that stands out for vegetation cover, which currently comprises 43.6% of the municipality's total area [19]. The city of Curitiba is historically known as an ecological capital due to numerous environmental projects and political advertisements [11].

Source: The authors.
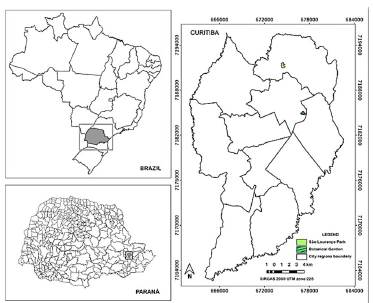
Figure 1 The geographic location of the city of Curitiba and the location of the green areas in Curitiba, Paraná, included in the survey.
First, two green areas were selected for the study (Fig. 1). The Francisca Maria Garfunkel Rischbieter Botanical Garden, located in the eastern region of the city, on the border of the Jardim Botânico neighborhood with BR-116, at 25° 26' 31" S and 49° 14' 19" W [20]. The park has a total area of 178,000 m2, with its landscape comprising representative spaces of Brazilian flora [21].
São Lourenço Park is located in the northern part of the municipality of Curitiba and has an area of 203,918 m2 [22], located at the geographic coordinates of 25° 23' 01.983'' S and 49° 15' 58.235'' W, at an average altitude of 930 m. The park is inserted in the Belém River watershed [23].
2.2 Green area characterization
Rectangular plots of 600 m2, 10 m wide by 60 m long (subdivided into 6 smaller plots of 100 m2 each) were established in each green area to characterize them. A vegetation strip at least 60 m long and 60 m wide was defined starting from a road of intense vehicle traffic, which were established so that there would be no transverse noise interference at the monitoring points. Next, two sample plots from the middle of this vegetation strip were allocated in the Botanical Garden and one in São Lourenço Park.
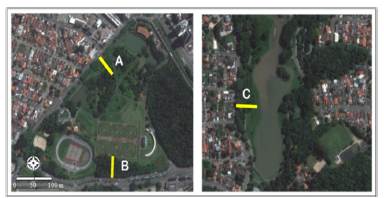
Then, two plots (A and B) were installed in the Botanical Garden, and one plot (C) in São Lourenço Park for monitoring (Fig. 2).
1) Plot A - with latitude 25°26' 26.48" South and longitude 49°14' 23.65" West;
2) Plot B - with latitude 25°26' 38.28" South and longitude 49°14'21.82" West; and
3) Plot C - with latitude 25°23' 5.64" South and longitude 49° 16' 4.39" West;

Note. 1 - Botanical Garden; 2 - São Lourenço. A - Botanical Garden: lowest vegetation density (witness); B - Botanical Garden: medium vegetation density; C - São Lourenço: highest vegetation density. Source: The authors.
Figure 2 Plot locations (A, B and C) in the Botanical Garden and São Lourenço Park, Curitiba, Paraná.
The variables collected in each plot were: number and density of trees; vegetation type (native or introduced - exotic or native); total height, canopy height and trunk height (to the first fork) of all inventoried individuals; diameter at breast height (DBH) of individuals with > 5 cm, and basal area; average tree spacing (average spacing of the closest trees); plot composition pattern (aligned or without a defined pattern); the amount of impervious area (measured with a tape measure); ground cover (the form of ground cover) and terrain slope.
2.3 Noise pollution assessment
The noise measurements were performed on weekdays at peak hours between 4:30 pm and 7:00 pm, and were performed on days with no rain or strong wind in order to standardize and eliminate interference, following the recommendations of NBR 10151:2000 [24].
The method proposed by [25] was used to evaluate the influence of green areas in mitigating noise, where two sound pressure meters (model DEC-470, accuracy of ± 1.5 dB) recorded the environmental noise in the three monitoring sites (A, B and C). Simultaneous measurements were performed in two different conditions, one at the source of the noise, at the edges of the traffic lanes, and the others at different distances from the source, being 5, 10, 15, 20, 25, 30, 35, 40, 45, 50, 55 and 60 m, with three repetitions (5 min collection, and 30 seconds pause), according to [25].
2.4 Data analysis and processing
For the calculation of noise attenuation, the values of the difference between the sound pressure level (dBeq: Decibel equivalent to the period evaluated) at the distance of 0 meters with the other distances tested at each monitoring site were used.
The measured characterization variables of the areas were correlated with the mean dBeq differences. This analysis was performed in the Statgraphics Centurion XVI software program using Pearson's correlation function.
The intensity classification of [26] was adopted for correlation, which defines correlation intensity classes as: null (0.00 - 0.03), weak (0.03 - 0.35), medium (0.35 -0.65), strong (0.65 - 0.95), very strong (0.95 - 0.99), and perfect (1.00).
3. Results
3.1 Characterization of the study areas
The physical characterization variables of the site are presented in Table 1.
A total of 88 trees were verified at the monitoring sites, with plot A (Botanical Garden) presenting the lowest density with 12 trees (density of 200 trees per ha). Next, 52 trees were catalogued in São Lourenço Park (plot C), showing the highest density (867 trees per ha); and 24 trees (400 trees per ha) were verified in plot B in the Botanical Garden, presenting an intermediate number of arboreal individuals.
The vegetation found at these locations is introduced as being part of the park's landscaping, with plots A and B having native Brazilian vegetation and plot C with native and exotic vegetation.
The highest total height of the trees (9.2 m) and the highest trunk height (4.8 m) were found in plot C. This is because São Lourenço Park was established almost 20 years earlier than the Botanical Garden (plots A and B). Although plot A has the same average trunk height (3.2 m) as plot B, it presents the lowest canopy heights (2.6 m) because its area is basically (58%) composed of palm trees. For this same reason, plot A presents the lowest total heights (5.6 m) when compared to plot B (8.6 m), which is composed of native species of the Mixed Ombrophylous Forest.
Plot C had the lowest average DBH (18.5 cm). However, the largest number of individuals resulted in the largest basal area (BA) of 37.59 m2/ha. Plots A and B showed similar mean DBHs with 19.7 and 20.1 cm, respectively, but a lower BA value was observed in plot A (7.50 m2/ha) compared to plot B (17.45 m2/ha).
Although plot A had the same tree spacing average (4.2 m) as plot B, it had cleared areas with an average of two individuals per subplot, while plot C had the lowest tree spacing average (2.5 m).
A composition pattern among the three evaluated plots was only found in the area corresponding to the Mixed Ombrophylous Forest vegetation typology (plot B), where the individuals were allocated in rows with an average spacing of 4.2 m between trees. The other sites showed no pattern and were completely dispersed throughout the plot.
The transects presented different permeabilities due to the presence of paths/walks because the plots were located in public places.
The ground cover form was different in the three evaluated sites, with plot A mostly consisting of grass (66.6%), plot B consisting of exposed soil (75% soil), while plot C showed 53.8% of the area covered by regeneration and 34.6% by exposed soil. Plots B and C presented a slope of 6.66 and 10%, respectively, while plot A presented an uphill slope of 8.33%.
3.2 Noise pollution mitigated
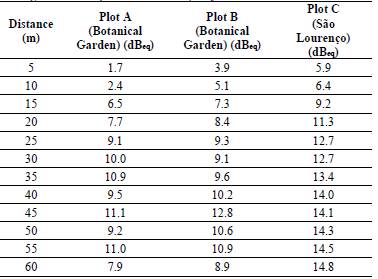
From the noise data collected, it was possible to determine the average equivalent decibels (dBeq) blocked in each plot, and analyze the difference between them (Table 2).
Table 2 Average values of equivalent decibels (dBeq) blocked at each collection site.

Source: The authors.
The attenuated noise values ranged from 1.7 dBeq at a distance of 5 m in plot A, to 14.8 dBeq at a distance of 60 m in plot C. The average values found at each site were 8.1, 8.8, and 11.94 dBeq, in plots A, B, and C, respectively.
The distances of 5 and 10 m in plot A showed the lowest average attenuation, while the distances 30, 35, 50, and 55 m had the highest average values. The distances 40, 45, 50, and 55 m in plot B presented the highest attenuation performance, while the distances closer to the noise source presented the lowest performance. Similar to Plot A, the distances of 5, 10, and 15 m in Plot C presented the lowest values of attenuated decibels, while the distances of 40, 45, 55, and 60 m presented the highest noise attenuation.
3.3 The relationships between green area physical characteristics and noise
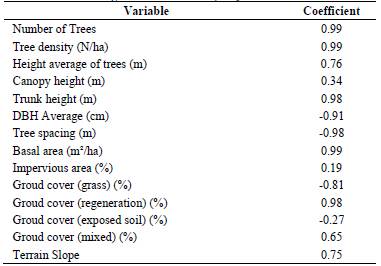
The overall ambient correlation analysis (Table 3) between noise attenuation and ambient conditions showed different results, showing a null correlation coefficient for some characteristics and a very strong correlation for others.
Table 3 Simple Pearson’s correlation analysis applied to each composition element and the average noise attenuation (dBeq).

Note. Negative signals indicate an inverse relationship between the variables.
Source: The authors.
Tree density and number of trees (0.99), trunk height (0.98), basal area (0.99), and tree spacing (-0.98) showed very strong correlation coefficients, with tree spacing being a negative correlation. The DBH average (-0.91) showed a strong correlation. Canopy height showed a weak correlation (0.34). Soil permeability values showed a low correlation (0.19), and terrain cover with exposed soil showed a similarly weak correlation (-0.27).
The correlation coefficient increased when the soil cover was composed of grass or regeneration, becoming strong (0.81) and very strong (0.98) respectively, while mixed soil showed a medium coefficient (0.65). The terrain slope showed a strong correlation (0.75).
4. Discussion
The vegetation proved to be efficient in the noise attenuation process; however, it was possible to observe different behaviors and interactions between the vegetation characteristics with the blockage. This occurs because the different strata of a vegetation belt with a potential effect on sound waves are the ground layer, the trunk, and the canopy (considering the canopy distribution) [27].
A greater number of individuals, density of trees, and smaller spacing between trees leads to there being more obstacles to prevent noise propagation. Similarly, the trunk height, DBH, and basal area serve as a blockade in the first meters above the ground, hindering the free movement of sound to the receiver with an average height of 1.5 m. This occurs because tree trunks reflect, diffract and scatter sound [27].
The author's guidelines [28] state that dispersion through the trunk redirects the sound path (direct) energy between the source and the receiver. As a result, the sound energy gradually decreases during transmission through the trunk layer, leading to effective noise reduction. If the dispersed sound still reaches the receiver, the long-distance traveled causes the noise to arrive with less intensity. It is also worth mentioning that bark absorption can promote to noise reduction due to the many interactions between sound waves and trunks. Regarding woody parts, [15] found sound absorption in the medium frequency range, while leaves obtained absorption mainly in the high-frequency range.
The weak correlation of canopy height may be associated with high canopy height, since trunk height has a greater influence on noise reduction. The canopy dimensions found in this study would have a greater influence on noise reduction if the canopies were lower, resulting in greater interaction with the sound waves.
In the attenuation process, the plant leaf absorbs acoustic energy by transferring the kinetic energy of the vibrating air molecule in a sound field to the vibration pattern of the leaves [29] and can be confirmed by [8], as noise levels are reduced by the presence of leaves in trees. Thus, the vibration energy is removed from the acoustic field and part of this energy is lost by transfer through leaf friction [30, 31, 32]. When the source or receiver is located below the canopy, dispersion through the canopy results in a slightly negative effect, as discussed by [33] and [34].
In contrast, conifers would be more efficient because of their triangular shape, as most of the biomass is located near the bottom of the canopy; this is not only because of their typical canopy shape, but also because they do not lose their leaves during winter [13]. In addition, changes in the microclimate due to denser and lower canopies influence the properties of the sound propagation medium [13], and can be an important indirect effect on attenuation.
The fact that most of the transects are permeable and have few areas with sidewalks results in a low correlation between this element and noise attenuation, occurring in the same way when the ground cover was only composed of exposed soil. The correlation coefficient increased when the ground cover was composed of grass or regeneration, and this correlation showed a medium coefficient when mixed.
The presence of soil can lead to increased direct noise contribution to the receiver, as sound is reflected in the soil [35]. The presence of vegetation on the ground contributes to a soft (porous) soil [12, 36] and the presence of burlap and plant roots results in a shift in the effect of sound to lower frequencies, decreasing its propagation [37]. An alternative to increase the attenuation of sound noise in places where vegetation is established is the addition of ground cover, thus all vegetation layers would act to combat the propagation of noise.
The presence of forest soil alone compared to sound propagation over grassland is considered to be responsible for a reduction in traffic noise level close to 3 dB(A) [14]. This is due to the interaction between direct sound traveling from the noise source to the receiver plus sound from the source to the receiver that is reflected on the ground. The ground can have destructive interference or cancellation and constructive interference or reinforcement. Thus, with an acoustically harder ground the frequencies at which cancellations and reinforcement occur only depend on the difference between the direct and reflected path lengths in the ground. The presence of hard soil for road/tire noise sources and a 1.5 m high receiver more or less leads to doubling the sound pressure compared to a location without exposed soil [13].
The terrain slope showed a strong correlation (0.75). The correlation in plot A was medium, medium inverse correlation in plot B, and strong inverse correlation in plot C. This means that increasing the land slope values (uphill) leads to increasing noise reduction values. The correlation in plots B and C was inverse because it is downhill, and increasing it causes reduced noise blockage.
It is important to highlight that green areas are a complex environment composed of air, soil, stems, trunks, branches, and foliage. Therefore, their effects can vary widely when used as a noise barrier [38], but while noise reductions mitigate the problem, they do not eliminate it on larger roads/streets with higher vehicle flow and thus greater noise pollution [39].
5. Conclusion
Characterizing the study areas was important for detailing the relationship of the environment with noise blocking. The vegetation was efficient in attenuating noise pollution, and the plot with the least amount of vegetation obtained the lowest noise mitigation values. The combination of factors related to the composition and type of tree cover played key roles in this aspect, where the number of individuals and the tree density had very strong correlations with the values of decibels blocked. The average height of the trees influences the noise propagation more than the canopy height.
The evaluation of the relationship of soil with the mitigation of noise propagation showed significant results. The ground cover, especially when composed of regeneration, resulted in a high response in noise reduction. It was also possible to observe that the presence of grass and exposed soil in the study areas showed an inverse relationship, and a terrain with mixed composition can be a good alternative for noise mitigation. The terrain permeability values showed no influence on the propagation of noise pollution.
The combination of factors, including the shape and size of the vegetation patches with terrain conditions such as terrain slope and ground cover influenced noise propagation, and should therefore be taken into consideration in future studies.


