1. Introduction
Exploration of the underground environment has great importance to society, whether for mining, space optimization in large cities or for travel distance reduction. The use of underground space has several advantages because of its multiple applications. However, exploration of underground spaces is complex, given the large number of variables involved in the projects and the uncertainties in their estimates [1]. Unlike other studies on underground excavations, in most cases the environment is the main constructive element, naturally with great uncertainty as to the quality of rock masses. These rock masses can present variations in physical and structural properties, making previous geotechnical characterization extremely important for the development of excavation projects. Thus, consistent rock mass classification has been developed, such as Bieniawski's [2] RMR classifications; Q-system by Barton et al. [3], and GSI (Geological Strength Index) by Hoek [4], and consequently, several studies associating physical properties of rock masses and ground support quantification to their classifications [5].
Several studies have addressed the subject of risk analysis in underground excavations, especially regarding the uncertainty of the behavior of the surrounding excavation and its geotechnical properties; such as the studies by Charbel [6], Momeni et al. [7], Fattahi et al. [8], and Lu et al. [9], who use Monte Carlo Simulation to assess the influence of the variability of input parameters on the output result of a model.
Unpredictable variations in the properties of rock mass can mean great economic losses regarding the execution of excavations, as they cause the need to change the adopted support, delay development and can even collapse the excavation. According to Vargas et al. [10], both for the development of underground mining and civil excavations, the difficulties in forecasting productivity times of the unitary operations (drilling, blasting, hauling, and support) are highly costly. Each operation tends to present a certain distribution of occurrence probability.
This study aims to present the applicability of Monte Carlo Simulation Risk Analysis for the elaboration and analysis of conceptual excavation projects, using empirical models based on geomechanical classifications. The variability of a conceptual project was checked against the occurrence probabilities of input parameters for geomechanical classifications of rock mass. For this purpose, a standard type of excavation in a rock mass was considered, and an attempt was made to assess the impact of variations on input parameters in the estimation of design parameters.
2. Material and methods
2.1 Empirical modeling
Rock masses are discontinuous masses that present spatial anisotropy, being constituted by different rocks of different composition and mechanical properties. They can present different degrees and qualities of fractures, given their environment and geological history. Due to the complexity of working with realistic analytical models, in which all variables are included, historical problems of underground excavations have been solved with empirical models supported by the classification of rock mass, with great representation of the subdivision of classes for the type of reinforcement (use of mesh, rockbolts, shotcrete, etc.), since the diffusion of the New Austrian Tunnelling Method (NATM) [11]. A preliminary classification, usually in possession of data provided by drilling surveys and other methods of sampling and geotechnical characterization, allows the definition of the qualitative class of rock mass and definition of support types needed. As the excavation is carried out, with increased reliability of the information from the underground characterization, the class predicted should be revised and the appropriate support performed (Fig. 1).
Fig. 1 shows the representation of the challenges faced in the field, where in the course of the excavation, the class of the rock mass must be reviewed to indicate the most appropriate support type to be performed.
Barton [12] proposed a diagram that indicates the choice and specification of support types of rock mass according to the classification by the Q-system. It uses the smallest excavation dimension (Excavation Span) or excavation height (the highest value among these) and the Excavation Support Ratio (ESR), a factor referring to the purpose of the excavation [3], which aims to consider the need for reliability, as previously mentioned.
For other rock mass classifications, there are empirical, graphical, and numerical relationships relating the classification of the rock mass with geotechnical properties and design parameters, such as the studies by Bieniawski [2,14], Unal [15], Palmström [16,17], and Mark [18], among others. This practice is common in the field of rock mechanics [19].
2.2 Rock mass classifications
2.2.1 Rock Mass Rating (RMR)
The Rock Mass Rating (RMR) classification was developed by Bieniawski, between the years 1972 and 1973 [2]. However, due to its wide applicability, it is a classification system with several updates and correlations, which incorporate new aspects of assessment and weighting to the system [20-22]. This system has its origins in the excavation of South African tunnels and mines, with its main applications in civil and mining excavations. Zingano [23] points out that the RMR classification has been applied to a wide range of problems in Rock Mechanics, such as excavations, slope stability, rock foundations, and mining in general.
The RMR system uses five main parameters to classify rock mass, which are: a) Uniaxial Compression Strength (UCS) of the rock; b) RQD (Rock Quality Designation) [24]; c) Spacing between discontinuities; d) Quality of discontinuities; e) Presence of water in the rock mass.
2.2.2 Q-System
The Q-system or Q-Classification [3] proposes a quality index of rock masses called "Q", ranging from 0.001 to 1000, based on six parameters, divided into different levels, combined according to the following expression:
Q = (RDQ/Jn) . (Jr/Ja) . (Jw/SRF) (1)
Where Jn is the number of joints set, Jr is the number representing joint roughness, Ja is the number representing the joint alteration, Jw is the reduction factor due to joint water and SRF is the reduction factor due to excavation stress.
2.2.3 Relationships between the RMR and Q-Classifications
Having been the subject of several studies and debates, in relation to the limits of application and applications to specific means, it is understood that in general the correlations between RMR and Q-Classification should be limited to use on a small scale, within the limits of an excavation work or geological environment. However, due to the large volume of articles devoted to this theme, a designer will have a wide range of correlations that are essentially very similar and perfectly applicable for preliminary design purposes. Below are some empirical correlations based on the observations of their authors:
The equation with the highest correlation coefficient is that of Rutledge and Preston (eq. 4) [26], with 0.81. Naturally, studies tend to focus on the search for the correlation between RMR and Q-systems, due to their greater applicability to the branches of rock mechanics for excavations in both the open and underground. It should be noted that the systems have full application in surface projects, such as excavation and stabilization of rock slopes, in this case with emphasis on RMR and GSI, but without excluding the Q-system. However, it is for application to underground excavations that the correlations were developed and, based on this, more data on comparative studies between the Q and RMR systems exists for underground excavations.
2.3 Risk analysis for excavation projects
Risk analysis in underground works is highly recommended; from analysis by qualitative methods, analyzing generic risks to the project, as presented by Sturk et al. [1] and Domínguez et al. [30], as well as the use of methods such as risk matrix analysis. However, the applicability of probabilistic methods such as the Monte Carlo (Fig. 2), made possible by the computational capacity of processing and availability of robust databases of properties of interest, has been steering risk analyses towards the probabilistic field. Increasingly, non-managerial areas, such as engineering, have been using these tools, evolving the analysis of scenarios previously restricted to deterministic methodologies.
In geotechnical engineering and excavations, a trend is identified in the use of probabilistic methods to determine Safety Factors and deformation parameters. The studies by Fattahi et al.[8], Lu et al. [9], Panthi [31], among others, start from the probabilistic distribution models of the parameters of RQD, Jn, Jr, Ja and Jw, for the simulation of the probability of the occurrence of empirical models of physical properties of rock mass, considering the Q-system and empirical relationships associated with it. Other studies have focused on the analysis of uncertainty of RMR parameters, such as that by Sari et al. [32].
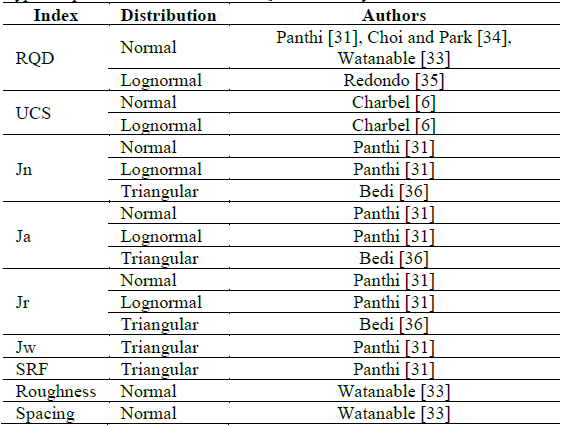
The uncertainty associated with the occurrence of these and other parameters can be remedied by exhaustive field and laboratory tests. Watanabe [33] and Panthi [31] present extensive literature on statistical modeling of the input indexes in the RMR and Q-classifications, respectively. There is a tendency for the Normal, Lognormal, and Triangular distributions of the indices, although it must be considered that they tend to vary according to the geology (type of rock and location) under study and its genesis process (igneous, sedimentary or metamorphic). In his study, Charbel [6] presents, for the UCS (Uniaxial Compressive Strength) parameter, Lognormal and Normal distributions, varying according to the geological layer assessed. Table 1 presents a compilation of the distribution forms found by different authors for the Q-system and RMR parameters. It is noticeable that the largest number of studies on characterization and statistical analysis falls on the RQD, as highlighted by Zhang [5]. RQD is an extremely important parameter in the characterization of rock masses and can be related in isolation with other parameters related to the physical features of rock masses (such as modulus of elasticity and relationship between tensile strength of the rock mass and intact rock).
Considering that one can assume probability distributions for the parameters that compose the geomechanical classifications of RMR and Q, these can be simulated using the Monte Carlo method. Although the number and quality of information regarding the rock mass increase the extent to which an excavation is carried out, causing the dynamic review of a project and leading to the need for changes in its execution, the possibility of measuring the variability that a project may present is interesting for conceptual elaboration stages. In the case of geological environments, even with large ranges of data available, abrupt changes in the quality of the rock mass cannot be completely ruled out.
For conceptual cases or pre-feasibility studies, where data sources are limited, due to the execution of few physical surveys, the quantitative risk analysis helps to measure the potential scenarios that could occur. It is possible to visualize the amount of support elements to be used, execution times and, consequently, the costs of carrying out an excavation, be it a road, tunnel or an underground mine access. Although this is a distribution of expected values, and such distribution presents reliability proportional to the reliability of the input data, having a wide range of expected values allows a more realistic analysis than that of deterministic projects. Another possibility is the assessment of gain by densifying the available information (surveys and tests) in view of a possible decrease in uncertainty regarding the execution of the work in the cycle times, type and quantities of support elements and planned advances, among others. In the case of underground excavations, whether for mining or civilian purposes, we are dealing with works of around millions to easily billions of dollars.
3. Methodology
Considering the available bibliographic data, it has been identified that calculation of RMR and Q-classifications allows the insertion of probability distributions of some of its input parameters. Once a probabilistic response was generated for the classifications of the rock mass (Q and RMR), it is possible to graphically determine the parameters of the project of interest, such as in the class of support and/or self-support time graphs (time before collapse) without reinforcement. Defining the design geometry, excavation height and width, through the support graph, it is possible to check, depending on the variation of the Q-classification of the rock mass, the support type to be adopted. The same method can also be used in defining the time necessary for the execution of the support or if it is intended to excavate prior to the execution of the support.
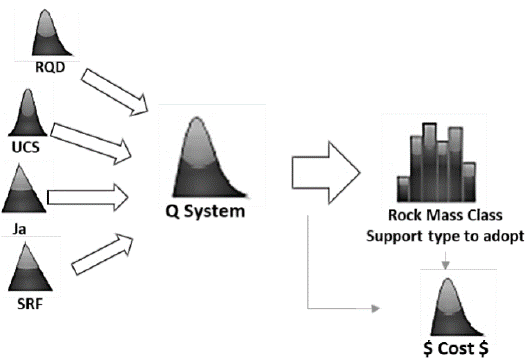
Fig. 3 illustrates the simulation of the classification of the rock mass by the Q-system, which can be converted into a class distribution for the inference of other parameters of interest, such as class of support and financial cost, among others.
To perform the simulation, the statistics of the initial parameters proposed by Lu et al. [9] were considered, as shown in the table above (Table 2). Regarding the excavation geometry, an excavation section geometry 10 (ten) meters high was fixed. The excavation rates of 3, 5 and 10 meters were assessed. Regarding the ESR, it was set at a value of 1.0 for civil road-rail use. The Jw index was translated as a continuous variable in order to generate the distribution values.
Simultaneously with simulation of Q-values, simulations of rock mass classes and support classes were generated. To determine the self-support time, RMR values as a function of Q were inferred using eq. (2).
4. Results and discussion
4.1 Q-system and support classes
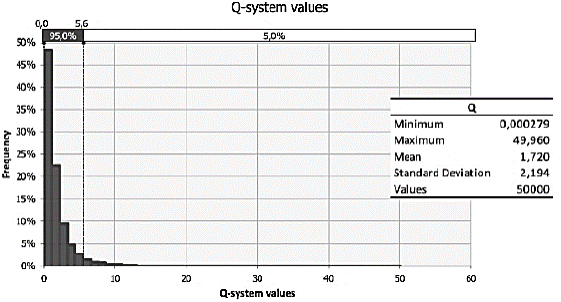
Fig. 4 presents the histogram of simulated Q-values, based on the input parameters and their basic statistics. It is observed that simulated values ranged from 2.79 * 10-4 to 49.96, presenting a distribution behavior of Lognormal type.
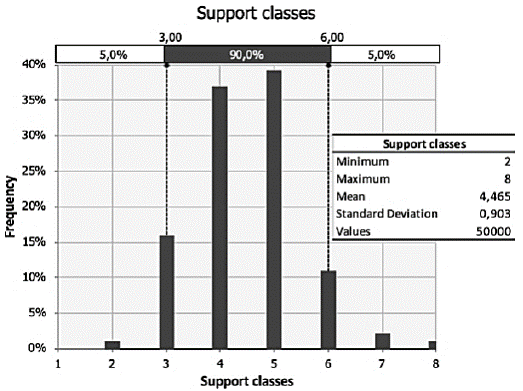
There was a higher frequency of mass framing with Class 5, corresponding to Class D, depending on the Q-value. However, there were also other classifications such as Class C and E. Regarding the simulated support classes, there was a greater distribution among classes 4 to 6, but more frequently for classes 4 and 5 (Fig. 5).
Fig. 6 shows the distribution in support classes, which considers, in addition to the Q interval, the ESR value and the height of the excavation.
4.2 Self-support time
Considering the RMR self-support time graph and RMR values inferred from Q (eq. 2), the excavation self-support times, in hours, were simulated for excavation rates of 10, 5, and 3 meters. The automation of the calculation of the self-support times for these advances was performed by adjusting exponential equations, in this case, those with the highest correlation, to the graph of self-support times.
Figs. 7, 8, and 9 show the simulations of self-support times for excavation rates of 10, 5, and 3 meters, respectively. The simulated values start from time zero (referring to immediate collapse). There is an increase in the occurrence of scenarios with self-support time greater than 5 hours and an increase in averages of the simulations; with the decrease of the excavation span. The simulations indicate that if working with a 3-meter excavation rate, we are less likely to collapse in less than 5 hours, without carrying out support in the excavation. Such simulations are of great value for compatibility with the estimated times of operation cycles, with the time for cleaning the front and development of support. In this way, it is possible to identify situations with risk of collapse, when it is significant (project definition) the probability that the self-support time is less than the cycle time.
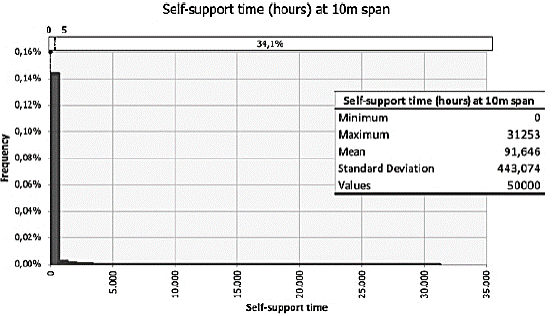
Source: Authors
Figure 7 Simulation for self-support time as a function of the RMR values inferred as a function of Q-values considered for a span of 10 meters.
5. Conclusion
Risk Analysis methodology can be applied and tends to contribute a lot in the elaboration of conceptual projects of feasibility and pre-feasibility of underground excavations. Considering the nature of these design phases, with their data limitations, the use of design methodologies and empirical checks, such as in the example from this article, makes it relatively simple to apply variability to input data, as long as a minimal range of data is known and allows for adjustments of probability distributions. In other words, where surveys and geotechnical characterizations are carried out or where geological-geotechnical context of the study area is known in depth. Considering the range of studies aimed at characterization, statistical and probabilistic treatments of rock masses, the quantitative risk analysis in underground excavations is promising.
Regarding the application example, the methodology was effective for the measurement of mass and support class scenarios. This measurement is practical in the sense of providing an estimate for scenarios to be found in the real case and their respective associated treatments, minimizing unforeseen expenses and production delays. About the measurement of costs from simulation, it was seen that this, if developed in relation to geomechanical class intervals (as shown in Table 2), becomes hardly representative, as in the example of this study, where the distribution would be truncated in two cost values. In this case, we would have costs related to Class A and B, from Table 2. We concluded that the best form of cost simulation would be with the use of equations that have the numerical value of the geomechanical class as input, avoiding a truncated distribution between two or three values.
Monte Carlo Simulations have quality levels correlated to those of the input data. This corroborates for a more restricted application to the preliminary design phases, considering that, in the details and execution of design phases, it is expected that the reliability of drilling data and geological-geotechnical modeling will allow the elaboration of a productive project and above all of a support system compatible with reality to be found in the field (using three-dimensional models and numerical analysis, for example). However, the risk analysis methodology can continue to be used in parallel with Risk Management of the project.


