


 English (pdf)
 Article in xml format
 Article references
 Send this article by e-mail
 Cited by SciELO
  Cited by Google
  Similars in
SciELO
Similars in
SciELO  Similars in Google
 Permalink
INTRODUCTION
One of most economical class of industrial compounds is quaternary ammonium salts which are known of their bioactive and surface active properties [1-5]. These salts consist of positively charged nitrogen atom with long or short chains and organic anions. However, these salts with cations of larger radii do not form strong hydrogen bonds with other solvent molecules in solution [6]. The ammonium ions with long alkyl chains have a strong tendency to enable the surrounding water molecules to form the clathrate like structure even in aqueous solution [7]. Due to the presence of both hydrophilic and hydrophobic groups in these quaternary ammonium salts, they have some peculiar properties such as high viscosities, long dielectric relaxation time, high apparent molar heat capacities and molar volume, low surface charge density, improved thermal and chemical stability etc.[8-14]. So, these quaternary ammonium salts with low melting points are also considered as ionic liquids [15, 16].
These quaternary ammonium ionic liquids are used in specific applications as pesticides, fungicides corrosion inhibitors, disinfectants, emulsifiers, surfactants catalysis, lubricant, coating materials etc. [17-25]. Further, these ionic liquids are used as electrolytes in high energy devices [26]. Quaternary ammonium salts are also used as ingredients in hair conditioners, shampoos and toothpastes [27]. Recently, tetra butyl ammonium bromide has emerged as mild, water-tolerant, inexpensive and environmentally compatible homogenous catalyst in various organic transformations [28-30].
Owing to their various applications in various fields, it would be interesting to study their volumetric properties in solutions. In recent years, the ultrasonic, volumetric and viscometric techniques have gained much importance due to their ability of characterizing physiochemical behavior of liquid systems [31-33]. These parameters enable evaluation of some useful thermodynamic and transport parameters, which can be used to explain the nature and extent of molecular interactions qualitatively; because the properties of pure substances are different from their mixtures [34, 35].
In the present work, acoustical and volumetric properties of an ionic liquid; tetra-n-butyl ammonium bromide (TBAB) have been studied in different solvents (water, methanol, ethanol, 1-propanol and 1-butanol) at different temperatures over a wide range of concentrations. A tetra alkyl ammonium cation is regarded as large spherical ion and a solute with hydrophobic surface [36] which affect the interactions in solutions. Thus, the volumetric behaviour of TBAB in different solvents can provide information regarding solute-solute and solute-solvent interactions.
Materials
The tetra-n-butyl ammonium bromide (TBAB) was purchased from Dutt Chemicals (Bhavnagar, India) and was used as such. The solvents, water, methanol, propanol, butanol were of HPLC grade supplied by Spectrochem Pvt. Ltd (Mumbai, India) and were purified by standard procedure [37]. The ethanol was supplied by Shree Chalthan Vibhag Khand UdyogSahakari Mandii Ltd. (Surat, India). The solutions of tetra-n-butyl ammonium bromidewere prepared in different alcohols over a wide range of concentrations. An electrical balance (Mettler Toledo AB204-S) with an accuracy of ± 0.1mg was used for the preparation of solutions.
Measurements of density, viscosity and ultrasound velocity
The density and sound velocity of pure water, selected alcohols and solutions of TBAB were measured at different temperatures (298.15, 308.15, and 318.15 K) using Anton Paar sound velocity and density meter (DSA 5000M) with accuracies of 0.5 m-s-1 and 0.005 kg-m-3, respectively. The model DSA 5000 M simultaneously determines two physically independent properties within one sample. The two-in-one instrument is equipped with a density cell and a sound velocity cell thus combining the proven Anton Paar oscillating U-tube method with a highly accurate measurement of sound velocity. Both cells are temperature controlled by a built-in Peltier thermostat.
The viscosities of water, selected alcohols and different solutions of studied ionic liquid were measured at different temperatures (298.15, 308.15, and 318.15 K) using an Ubbelohde viscometer with a standard relative uncertainty of ± 0.09. The temperature was controlled by the digital temperature controller of the NOVA viscosity bath with an accuracy of 0.5 °C. The pure solvent/solutions were allowed to attain the desired temperature in the viscosity bath before the measurements. A digital stopwatch with an accuracy of 0.01 s (Hanhart, Gütenbach, Germany) was used to measure the flow time of water, pure solvents and solutions.
RESULTS AND DISCUSSION
The experimentally measured density, sound velocity and sound velocity of pure water and selected alcohols are listed in table 1 along with literature values. It is observed that measured values are in good agreement with those reported in literature.
Table 1 Experimental values of density, sound velocity and viscosity of pure solvents at 298.15K.
| Solvents | Density, kg.nr3 | Sound velocity, m.s-1 | Viscosity, 103 Pa.s |
|---|---|---|---|
| Water | 997.052 (997.0082*) | 1496.49 (1496.3983*) | 0.890 (0.89082*) |
| Methanol | 786.814 (786.63684*) | 1102.63 (1102.5484*) | 0.542 (0.54285*) |
| Ethanol | 787.043 (786.6086*) | 1148.11 (1145.086*) | 1.070 (1.07986*) |
| Propanol | 799.606 (799.62084*) | 1205.46 (1205.8184*) | 1.901 (1.91587*) |
| Butanol | 805.998 (805.9088) | 1239.67 (1239.7284*) | 2.547 (2.52089*) |
(*) The values in parenthesis are from literature.
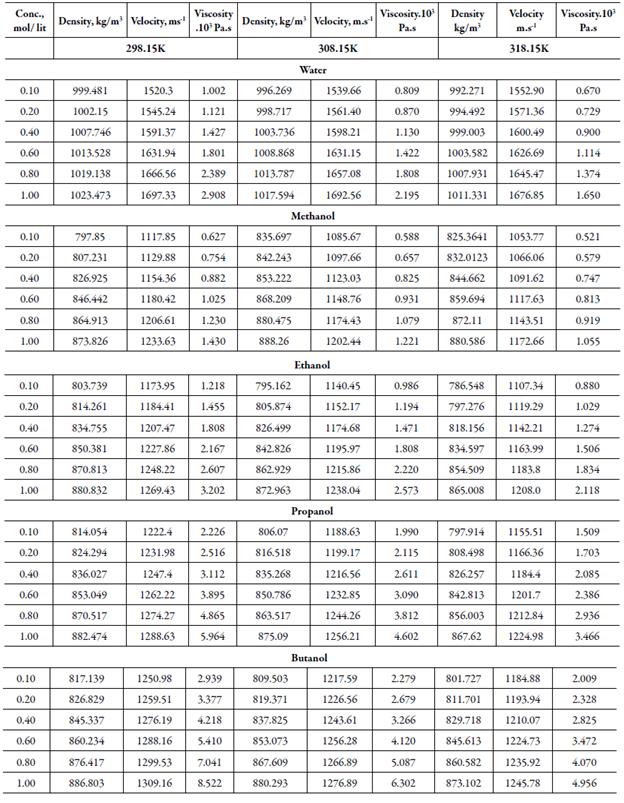
The measured density, sound velocity and viscosity of solutions of tetra butyl ammonium bromide (TBAB) in different solvents are presented in table 2 at different temperatures. It is evident from table 2 that density, velocity, viscosity values of all solvents increase with increase the concentration and decreases with increase the temperature except for water, where at lower concentrations, velocity increases with increase in temperature.
Table 2 Thedensity, sound velocity and viscosityof TBAB in different solvents at different temperatures.
From these experimental data, various acoustical and apparent properties have also been evaluated using equations reported earlier [38-40]:
Acoustical impedance (Z): Z = U p
Where U is the sound velocity and p is the density of solution.
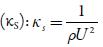
Adiabatic compressibility
Intermolecular free path length
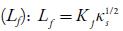
Where Kj is a temperature dependent Jacobson's constant ((93.875 +0.375 T)-10-8).
Relaxation strength
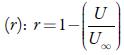
Where U ∞ is Schaff's limiting value taken as 1600 m/s for liquids.
Molar compressibility
Where M is the apparent molecular weight of solution and can be calculated according to the following equation: M = M1 W 1 +M 2 W 2
Where W 1 and W 2 are weight fractions of solvent and solute respectively. M1 and M2 are molecular weights of the solvent and solute respectively.
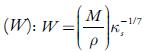
Rao's molar sound function
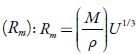
Van der Waals constant
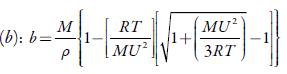
where R (8.3143 (J K-1mol-1)) is the gas constant and Tis absolute temperature.
Solvation number
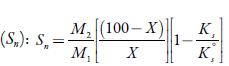
Where X is the number of grams of solute in 100 g of the solution. M1 and M2 are the molar masses and KS°andicS are adiabatic compressibility of pure solvent and solution respectively.
Internal pressure
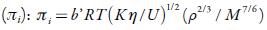
Where b' is the packing factor (=2), Kis a constant (4.28 x10⁹) and R is gas constant (8.3143J K-1mol-1).
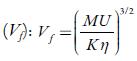
Free volume
Molar cohesive energy (MCE): MCE = V m ϖ i
Where V m is the molar volume.
Some of these evaluated parameters are listed in tables 3 and 4.
Table 3 Some acoustical parameters such as intermolecular free path length (Lf), acoustical impedance(Z) and molar cohesive energy (MCE) of TBAB in different solvents at differenttemperatures.
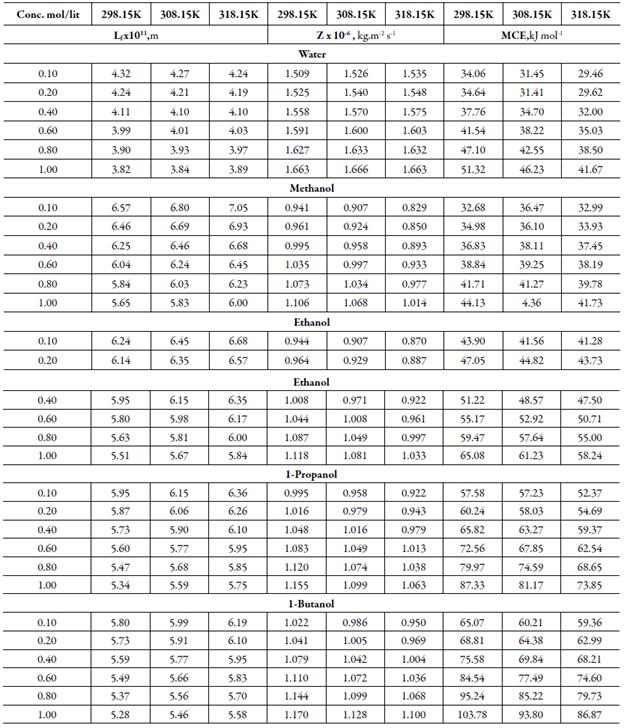
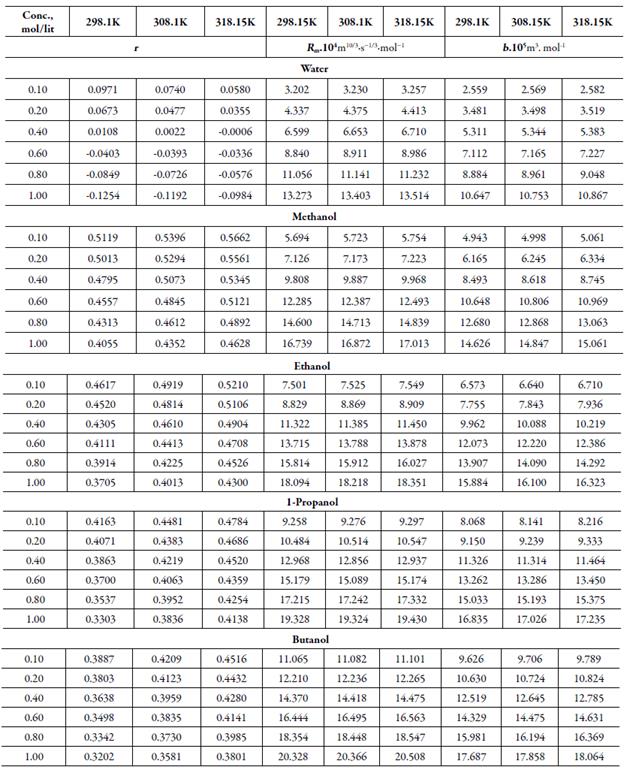
Table 4 Some acoustical parameters such as relaxation strength (r), Rao’smolar sound function (Rm)and Van der Waals constant (b)of TBAB in different solvents at different temperatures.
Figures 1 and 2 show the variation of sound velocity of TBAB with concentration in water and in different solvents at different temperatures. It is clear from figures 1 and 2 that for all the solvents, sound velocity increases with increase in concentration of TBAB in all the studied solvents and temperatures. However, as temperature increases, velocity decreases.
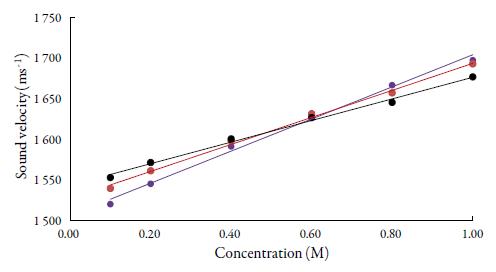
Figure 1 The variation of sound velocity of TBAB in water at different temperatures. •: 298.15K, • : 308.15K, •: 318.15K.
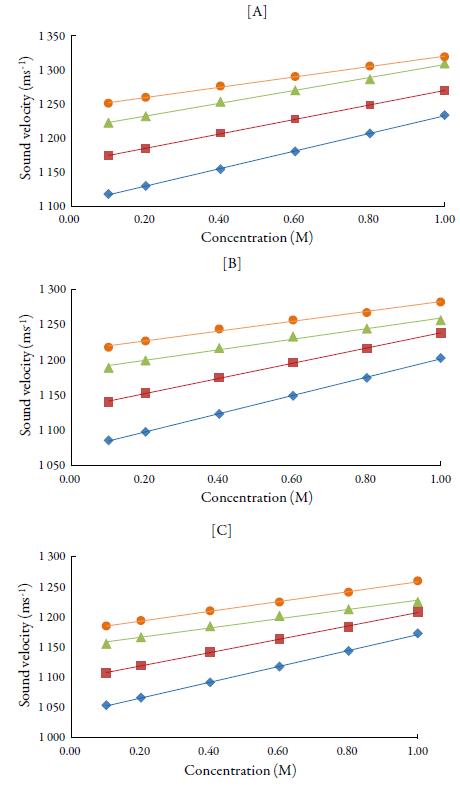
Figure 2 The variation of sound velocity of TBAB in alcohols at [A] 298.15 K, [B] 308.15K and[C] 318.15K. Methanol (♦), ethanol (■), propanol (▲), butanol (•).
The sound velocity is related to intermolecular free path length. It is evident from table 3 that intermolecular free path length (L f ) decreases with increase the concentration. As the name suggests, intermolecular free lengthis the distance between the solute and solvent molecules in a solution. At low concentrations, molecules are not so close sovalue of intermolecular free length is high but as concentration increases, molecules come closer and so intermolecular free length decreases. Thus, decrease in Lf suggests the decrease of distance between solute and solvent molecules due to existence of solute-solvent interactions [41].
So, when solute and solvent molecules come close to each other, velocity increases as evident from figures 1 and 2 in studied solvents. Thus, sound velocity is reverse of inter-molecular free length. Thus, sound wave propagates with higher velocity in the closely packed arrangement of atoms than in the loosely packed arrangement of atoms [42, 43]. The increase of density and viscosity in solutions also indicates more attraction between solute and solvent molecules in solutions. [44]. However, when temperature increases, these interactions become weak [45] due to thermal disturbances which causes intermolecular free length to increase. This in turn, causes decrease of sound velocity with temperature.
The predominance of strong association between solute and solvents is further supported by adiabatic compressibility (ks). Figure 3 shows the variation of adiabatic compressibility with concentration in different solvents. For simplicity, the graphical presentation is only for 298. 15 K. For other temperatures also, variation in adiabatic compressibility with concentration is of same nature.
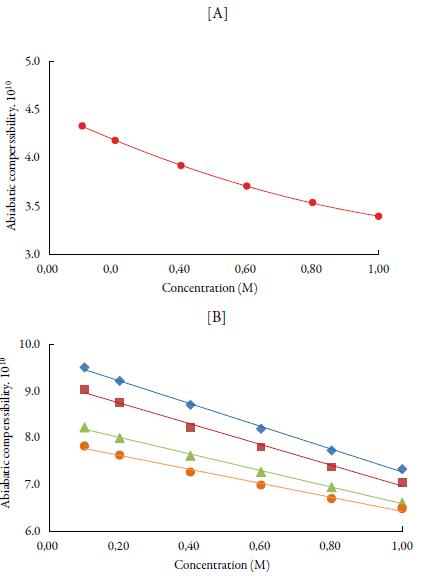
Figure 3 The variation of adiabatic compressibility (ks) with concentration at 298.15K [A] in water and [B] in alcohols. Methanol (♦), ethanol (■), propanol (▲), butanol (•) and water (•).
It is observed that adiabatic compressibility (ks) also decreases with concentration. The decrease in adiabatic compressibility is attributed to the influence of the electrostatic field of ions which results in aggregation of solvent molecules around solute molecule indicating strong solvent-solute interactions [46]. The adiabatic compressibility increases with increase the temperature due to increase in thermal agitation. The existence of solvent-solute interactions in studied solution is further confirmed by decrease of relaxation strength (r) and increase of acoustical impedance (Z) with concentration as shown in tables 3 and 4. Reverse is true with increase in temperature.
Figure 4 shows the variation of molar compressibility with concentration of TBAB in studied solvents. It is observed that there is linear change increase in molar compressibility. The Van der Waals constant (b) represents the volume occupied by the molecules of a liquid. It is a useful parameter to understand the nature of interactions between the solute and solvent. Table 4 shows that Van der Waals constant (b) increases linearly with increase the concentration in all the solvent and at different temperatures and the order is: 1-butanol > 1-propanol > ethanol > methanol > water. The linear variation in Rao's molar sound function (R m ) is also observed in table 4.
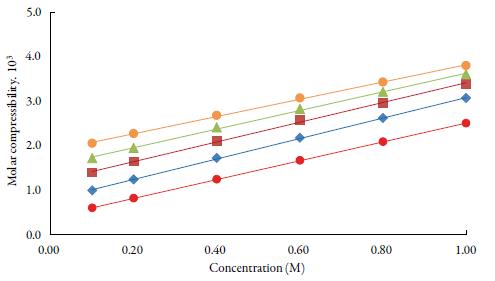
Figure 4 The variation of molar compressibility with concentration of TBAB in studied solvents at 298.15 K. Methanol (♦), ethanol (■), propanol (▲), butanol (•) and water (•).
The extent of linear variation of some of the acoustical parameters is given in table 5 by least square fitting equations and correlation coefficients (y). It is observed that for most of the parameters, correlation coefficients (y) is greater than 0.9918. The linear change in Rao's molar sound function (R m ), Van der Waals constant (b) and molar compressibility ( W) suggest absence of complex formation in these solutions [47].
Table 5 The Least square equations and regression coefficients(γ) of TBAB in differentsolvents at 298.15K.
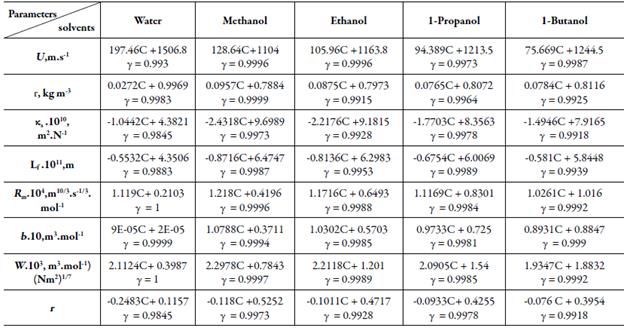
The internal pressure (ϖi) is the resultant of the forces of attraction and repulsion between the molecules in a liquid [48]. Cohesion creates a pressure within a liquid of value between 103 to 104 atmospheres. The important factor is that the internal pressure is sensitive to external pressure also. Figure 5 [A] shows the variation of internal pressure with concentration in all the selected solvents at 298.15 K. It is observed that internal pressure of TBAB in studied solvents is found to increase with increasing the concentration of the solutions and decrease with increase the temperature. This is because as temperature increases, there is a tendency for the ions to move away from each other, reducing the possibility for the interaction [49]. The increase in internal pressure with concentration indicates ordered structural arrangement due to molecular association between solute and solvent molecules [50].
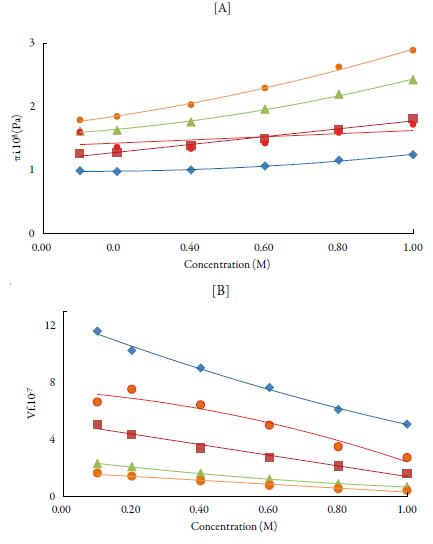
Figure 5 The variation of [A] internal pressure and [B] free volume with concentration of TBAB in studied solvents at 298.15 K. Methanol (♦), ethanol (■), propanol (▲), butanol (•) and water (•).
From internal pressure, free volumes of solutions have also been evaluated. Free volume indicates the void space between the molecules i.e., the volume present due to irregular packing of molecules [48]. Figure 5 [B] shows the variation of free volume with concentration in all the selected solvents at 298.15K. It is observed that in studied solutions, free volume decreases in all the solutions indicating thereby more interaction between solute and solvent molecules, which causes compact packing [51].The order of decrease is:1-butanol < 1-propanol<ethanol<water< methanol. It means that it increases with increase in the chain length of alcohols due to the increase the ability of making hydrogen bonds, which decrease with increase the temperature.
Comparison of figures 5 [A] and [B] shows that free volume is inverse of internal pressure. Similar results have been reported by other workers [52]. Thus, increase in the internal pressure and decrease of free volume indicate increase the cohesive forces in the solution [53]. The increase in temperature has two opposing effects, namely structure formation (intermolecular association) and structure destruction. The structure-forming tendency is primarily due to solvent-solute interactions while destruction of the previously formed structure is due to thermal fluctuations. When the thermal energy is greater than that of interaction energy, it causes destruction of the structure previously formed [54]. As evident from results, solvent-solute interactions predominate in studied solutions.
Molar cohesive energy (MCE) is the parameter, which relates the free energy state of the liquid system to the escaping tendency. The plot of MCE vs. concentration in figure 6. It is evident from the figure that there is linear increase with concentration of TBAB in all solvents. It is observed that MCE increases with increase in concentration and decreases with increase of temperature and the order is: 1-butanol >1-propanol>ethanol> water >methanol. The reason for slighter MCE values for water in comparison to methanol may be because of the fact that viscosity of water is higher than methanol. The overall increase of MCE with concentration confirms the enhancement of the structure-forming tendency of TBAB molecules [55].
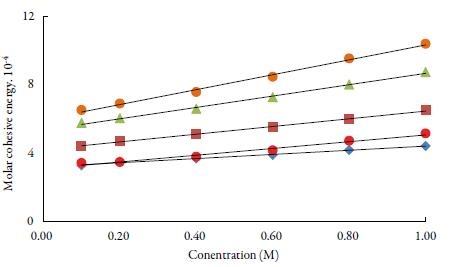
Figure 6 The variation of molar cohesive energy with concentration of TBAB studied solvents at 298.15 K. Methanol (♦), ethanol (■), propanol (▲), butanol (•) and water (•).
Solvation number is another parameter, which gives the information about structure forming tendency or structure breaking tendency of a solute in solutions. The solvation number can be positive or negative. he positive solvation number suggests structure-forming tendency of solute whereas negative solvation number indicates structure-breaking tendency of solute in a solvent [56]. Figure 7 shows that for the studied solutions, solvation number values are positive at all temperatures in all solvents. he order of solvation number in studied solvents is: water > methanol > ethanol>1-propanol>1-butanol. The probability of ions getting closer to the solvent molecules is increased, enhancing the interactions between solute and solvent molecules [57].
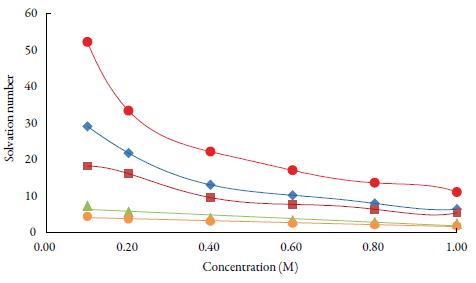
Figure 7 The variation of solvation number with concentration of TBAB in studied solvents at298.15 K. Methanol (♦), ethanol (■), propanol (▲), butanol (•) and water (•).
The behaviour of a solute in a solution can also be predicted by evaluating their apparent properties. So, for studied solutions, apparent molar volume and apparent molar compressibility were evaluatedat different temperatures.
The apparent molar volume (φ v ) of a solute is defined as the difference between the volume of the solution and the volume of the pure solvent per mole of solute and is given by:
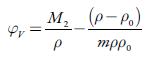
Where m denotes the number of moles of the solute per kilogram of solvent (molality), p andp 0 are densities of solution and solvent, respectively and M 2 is the molar mass of the solute. The evaluated values of apparent molar volume are listed in table 6.
Table 6 Apparent molar volume of TBAB in different solvents.
| Conc. M | Apparent molar volume. 106 mVmole | ||||
|---|---|---|---|---|---|
| 298.15 K | |||||
| Water | Methanol | Ethanol | 1-Propanol | 1-Butanol | |
| 0.10 | 298.186 | 263.799 | 188.965 | 215.329 | 251.842 |
| 0.20 | 296.123 | 269.620 | 223.004 | 236.722 | 258.421 |
| 0.40 | 293.088 | 262.406 | 234.643 | 271.738 | 258.191 |
| 0.60 | 290.536 | 254.558 | 244.974 | 266.521 | 261.826 |
| 0.80 | 288.637 | 248.656 | 237.160 | 259.479 | 258.027 |
| 1.00 | 288.487 | 241.458 | 246.829 | 261.678 | 262.793 |
| 308.15 K | |||||
| 0.10 | 301.154 | 264.615 | 189.773 | 215.937 | 257.667 |
| 0.20 | 299.264 | 270.608 | 223.401 | 236.820 | 261.352 |
| 0.40 | 296.792 | 263.243 | 235.493 | 247.736 | 260.941 |
| 0.60 | 294.683 | 255.414 | 244.498 | 254.095 | 263.509 |
| 0.80 | 293.163 | 248.915 | 237.804 | 259.609 | 263.015 |
| 1.00 | 293.110 | 241.696 | 247.776 | 262.795 | 263.483 |
| 318.15 K | |||||
| 0.10 | 304.179 | 265.335 | 188.852 | 216.640 | 255.102 |
| 0.20 | 302.595 | 271.589 | 224.140 | 237.479 | 260.546 |
| 0.40 | 300.527 | 264.174 | 236.094 | 252.854 | 263.224 |
| 0.60 | 298.739 | 256.136 | 245.370 | 255.732 | 264.164 |
| 0.80 | 297.486 | 249.462 | 239.250 | 260.481 | 263.229 |
| 1.00 | 297.449 | 241.827 | 248.632 | 263.832 | 264.199 |
It is observed that apparent molar volume decreases with concentration for water and methanol whereas for ethanol, 1-propanol and 1-butanol, values increase with concentration. The values are highest for 1-butanol, which is in agreement with that of other workers [58]. The values of apparent molar volume depend on type of salt, size of ions etc. In the present study, values of apparent molar volume are positive and large which is due to large organic ion with large intrinsic volume [58]. Further, large apparent molar volume is attributed to strong attractive interactions due to hydrogen bonding [59].
The reason for decrease of apparent molar volume with concentration in water and methanol is not clear. Hooshyar and Khezri have also reported similar decrease of apparent molar volume with concentration in binary and ternary systems [14] and the reason is not discussed. With temperature, there is slight increase in apparent molar volume in all the studied solvents.
The limiting apparent molar volume is evaluated by extrapolation of experimental apparent molar volume values using the following equation [60]:
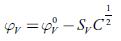
Where C is the molar (mol/L) concentration and S V is coefficient which is a measure of solute-solute interactions [61].
From the plot of φ V vs. C1/2, the values of φ V° and S V were evaluated from the intercept and slope respectively and are listed in table 7.
Table 7 The coefficients of apparent molar properties in solutions of TBAB in different solvents at different temperatures.

*1-(9), *2-[45]
A relation between thermodynamics and acoustics can be obtained from the density and sound velocity measurements, which combined to calculate the apparent molar isentropic compressibility (φ x ), by the equation:
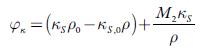
Where M2 is the molar mass of TBAB, k s and k sv refer to the adiabatic compressibility of the solution and solvent, respectively. The evaluated values of apparent molar compressibility are listed in table 8.
The apparent molar isentropic compressibility p x values are negative in all solvents. Further, apparent molar compressibility in studied solvents increases with increase in concentration. The negative apparent molar isentropic compressibility indicates that the solvent surrounding TBAB ion would cause greater resistance to compression than the bulk, and this decreases with increase the chain length of alcohols [62]. The observed results are in agreement with other workers while studying different quaternary ionic liquids [63]. In water and methanol, values increases with temperature whereas in other three alcohols, values decreases with temperature. Similar behavior was observed for some other electrolytes also [64].
It has been reported that large organic cation (tetra butyl ammonium) has high intrinsic compressibility as compared to the small monoatomic bromide anion. The bromide ions remain unsolvated, thus ruling out the possibility to have intrinsic compressibility. So, it is assumed that compressibility of the solution is unaffected by poor solvation of bromide ions. Further, there may be possibility of another effect where solvent molecules can penetrate into the intra-ionic free space. This is an electrostriction effect and causes constriction in the solution volume. The predominance of the penetration effect over the effect of intrinsic compressibility of the tetra-n- alkyl ammonium ions causes negative φ x values [65]. As chain length increases, intrinsic compressibility overrides the penetration effect [66].
Table 8 Apparent molarisentropic compressibility of TBAB in different solvents.
| Concentration (M), mol.l1 | Apparent molar isentropic compressibility 1014 m5.N-1.mol-1 | ||||
|---|---|---|---|---|---|
| 298.15K | |||||
| Water | Methanol | Ethanol | 1-Propanol | Butanol | |
| 0.10 | -1.605 | -6.207 | -8.153 | -5.406 | -3.683 |
| 0.20 | -1.611 | -5.460 | -6.086 | -4.392 | -3.305 |
| 0.40 | -1.519 | -4.966 | -5.014 | -3.275 | -3.017 |
| 0.60 | -1.412 | -4.642 | -4.355 | -3.037 | -2.689 |
| 0.80 | -1.305 | -4.430 | -4.115 | -2.866 | -2.530 |
| 1.00 | -1.304 | -4.241 | -3.740 | -2.672 | -2.305 |
| 308.15K | |||||
| 0.10 | -1.330 | -9.098 | -8.973 | -5.891 | -3.145 |
| 0.20 | -1.354 | -7.081 | -6.805 | -4.871 | -3.200 |
| 0.40 | -1.248 | -5.985 | -5.534 | -4.048 | -3.078 |
| 0.60 | -1.161 | -5.414 | -4.839 | -3.592 | -2.806 |
| 0.80 | -1.064 | -5.075 | -4.533 | -3.195 | -2.606 |
| 1.00 | -1.030 | -4.824 | -4.124 | -2.928 | -2.434 |
| 318.15K | |||||
| 0.10 | -1.099 | -9.451 | -10.015 | -6.621 | -2.705 |
| 0.20 | -1.131 | -7.558 | -7.565 | -5.447 | -3.129 |
| 0.40 | -1.025 | -6.487 | -6.143 | -4.442 | -3.106 |
| 0.60 | -0.953 | -5.903 | -5.366 | -3.993 | -2.951 |
| 0.80 | -0.865 | -5.548 | -4.999 | -3.545 | -2.771 |
| 1.00 | -0.854 | -5.296 | -4.579 | -3.243 | -2.588 |
In case of methanol solutions, the penetration of the solvents molecules into the intra ionic free space of TBAB may be high. This may cause decrease of apparent molar isentropic compressibility with increase the concentration of the TBAB in the solution. This effect decreases with increase the chain length of alcohols.
To evaluate limiting apparent molar isentropic compressibility, the following Gucker's equation [67] was used:
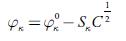
Where φ x ° and S x are the coefficients and can be evaluated from the intercept and slope respectively from linear plots. The evaluated values of these coefficients are given in table 8.
It is evident from table 8 that all the coefficients i.e., φ V°, SV, φ x and S x vary systematically in alcohols from ethanol to 1-butanol. Whereas for methanol, these values are either high or low. Further, for all the studied solvents, pV 0 values are large and positive whereas φ x values are negative. As φ V ° is a measure of solute solvent interaction, the positive value indicates strong solute solvent interactions. This suggests structure-forming tendency of TBAB in studied solvents.
The higher φ V ° value in methanol may due to the ability of the short chain of alcohol to penetrate into the intra-ionic free space and this effect decreases with increase the concentration of TBAB in the solution. As chain length of alcohols increases from ethanol to 1-butanol, there may be possibility of hydrogen bonding, which affects interactions of TBAB with alcohols. The order is: 1-butanol>1-propanol>ethanol. Similar result was observed by Mohammed Taghi et al. [62], where in methanol solutions have higher value of φ V°as compared to ethanolic solution. The observed φ V ° value in water and methanol are in agreement with those observed by other workers. The values reported by these workers are given in table 8 in parenthesis.
In case of water, large organic ions may form clathrate like structure with water molecules. The tendency of making such structure decreases with increase the concentration of the TBAB. The observed values of limiting apparent molar volume for water and methanol in the present study are in agreement with those reported by other workers [68]. So, in water solutions, highest values of apparent molar volume, limiting apparent molar volume and apparent molar compressibility are observed (see table 8). Further, φ V ° values are not much affected by the temperature.
The S V values are negative for water and methanol whereas for rest of the alcohols, values are positive. The negative S V means that solute-solvent interaction is stronger than solute-solute interactions. Reverse is true in other alcohols. Among alcohols, S V values decrease with increase the chain length of the alcoholsexcept in methanol. Since S V is a measure of solute-solute interactions, the negative values indicate the presence of weak solute-solute interactions. Among other three alcohols, SV is minimum in 1-butanol.
This again proves that magnitude of solute-solvent interactions is maximum in 1-buta-nol as compared to ethanol and 1-propanol.
The φ x ° values are negative for all the studied solvents. It is higher in water than alcohols. Among alcohols, it is maximum in 1-butanol. The negative φ x ° again proves existence of solute-solvent interactions in the studied solutions. In water, φ x ° values are less negative. This behavior can be explained by strong solute-solute interactions due to hydrophobic nature of TBAB due to which it is difficult for solvent molecules to penetrate in interionic free space. Further, negative and lower values of S x is in agreement with the negative change in apparent molar volume values [69].
Viscosity is one of the most important factors, which affect mobility of ions/molecules. It has been reported [70, 71] that viscosity measurements are very useful in providing information regarding ion-solvent interaction, particularly as regards the modification induced by the solute on the solvent structure.
In the present study, viscosity of solutions is also found to increase with concentration. The viscosity depends on nature of solvent and intermolecular force. The viscosity of solution in different concentrations and temperatures is also affected by various molecular interactions present in solutions. Te concentration and temperature dependence of viscosity coefficient of solutions also provided useful insights to the extent of ionic solvation [72]
For this, the following Jones-Dole equation [73] is used which describe the relative viscosities as a function of concentration.
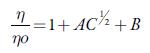
Where η and η 0 are the viscosity coefficients of the solution and solvent respectively. A is known as Falkenhagen coefficient which reflects solute-solute interactions. The viscosity B coefficient is an empirical parameter, which gives information regarding solute-solvent interactions. B parameter is related to the size of solute and molar volume of the solvent [74, 75]. Tus, B values reflect the net structural effects of the solute and solvent molecules.
It is observed that A is negative for all the selected solvents and is very small as compared to coefficient B, which suggests that there is a weak ion-ion interaction. It is reported that for organic electrolytes, A value can be neglected at moderate or high concentrations [75, 76]. So, above equation is simplified as:
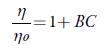
The value of coefficient B can be obtained from the slope of linear plot of (η/η o _ 1) vs. C. Table 9 shows the values of B for all the solutions. The values of the B coefficient for all studied solvents at all studied temperatures are positive, indicating that the solute solvent interactions are strong [77, 78] so TBAB ions behave as structure makers. Further, as temperature increases, B values decrease. Further, as number of carbon atoms increases in alcohols, B-coefficient increase.
Table 9 The coefficient B of Jones-Dole equation for solutions of TBAB in studiedsolvents at different temperatures.
| Solvents | 298.15K | 308.15K | 318.15K |
|---|---|---|---|
| Water | 2.389 | 1.750 | 1.228 |
| Methanol | 1.566 | 1.269 | 1.046 |
| Ethanol | 1.978 | 1.632 | 1.271 |
| 1-Propanol | 2.160 | 1.521 | 1.119 |
| 1-Butanol | 2.439 | 1.711 | 1.248 |
Some thermodynamic parameters such as enthalpy (ΔH*), Gibbs free energy (Δ G*) and entropy (ΔS*) have also been evaluated from acoustic data by the following equations [76, 77]:
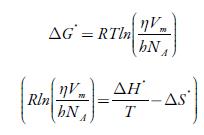
Where R is the gas constant, h is Plank constant, N A is Avogadro number, V m is the molar volume, and η is the viscosity.
The enthalpy and entropy can be evaluated from the slope and intercept of the plot of
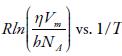
The evaluated enthalpy and entropy values are reported in table 10. It is observed enthalpy values are positive whereas entropy are negative. The positive enthalpy suggests endothermic process in studied solutions. The negative entropy indicates that formation of the transition state is associated with an increase in order relative to the initial state [76, 77]. This is expected when the free volume in the liquid has to be rearranged in order to provide sufficient space to the moving particles for jumping from their initial position to the activated transition state. The positive Gibbs energy of flow suggest that the process is non-spontaneous.
Table 10 The variation of the enthalpyand entropy with concentration in differentsolvents.
| Enthalpy, kJ.mol-1 | |||||
|---|---|---|---|---|---|
| Conc., mol/l | Water | Methanol | Ethanol | 1-Propanol | 1-Butanol |
| 0.10 | 15.194 | 6.0178 | 11.647 | 14.066 | 13.924 |
| 0.20 | 16.276 | 9.1973 | 12.513 | 14.247 | 13.648 |
| 0.40 | 17.411 | 5.508 | 12.704 | 14.957 | 14.767 |
| 0.60 | 18.106 | 8.0999 | 13.296 | 18.418 | 16.065 |
| 0.80 | 20.885 | 10.442 | 12.811 | 18.816 | 20.467 |
| 1.00 | 21.364 | 11.009 | 15.25 | 20.264 | 20.321 |
| Entropy, J.K-1mol-1 | |||||
| 0.10 | -168.73 | -199.35 | -186.13 | -183.43 | -185.94 |
| 0.20 | -167.40 | -190.76 | -185.14 | -183.96 | -188.26 |
| 0.40 | -166.47 | -204.67 | -186.33 | -183.40 | -186.27 |
| 0.60 | -166.32 | -197.17 | -185.85 | -173.50 | -183.80 |
| 0.80 | -159.40 | -190.68 | -188.87 | -173.84 | -171.13 |
| 1.00 | -159.47 | -189.82 | -182.23 | -170.56 | -173.14 |
Figure 8 shows the variation of Gibb's free energy with concentration. It is observed from figure 8 that Gibbs free energy values are positive and increases linearly with increase in temperature and concentration of TBAB in all solvents. The positive Gibbs free energy may be attributed to specific interactions like hydrogen bonding and charge transfer [78, 79]. The increase of Gibbs free energy suggests closer packing of the molecules due to bonding of unlike molecules in the solutions [80]. The increase in Gibbs free energy with temperature suggests that more time is required for the cooperative process or the rearrangement of molecules in the solution.
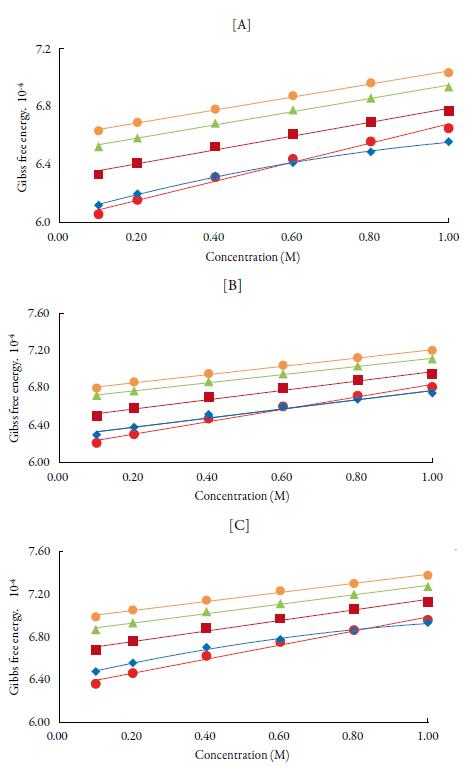
Figure 8 The variation of Gibbs free energy with concentration of TBAB in different solvents at [A] 298.15 K, [B] 308.15 K and [C] 318.15 K. Methanol (♦), ethanol (■), propanol (▲), butanol (•) and water (•).
Comparison of Gibbs free energy values between alcohols shows as chain length increases, Gibbs free energy increases i.e., order is: butanol>propanol>ethanol>met hanol> water. The result ΔH* and ΔG* were positive while the ΔS* are negative at all concentrations indicating thereby presence of specific interaction between the solute and solvents. It has been reported that positive Gibbs free energy mostly causes endo-thermic type of reactions [81-89].
Thus, it is concluded that in all the studied solutions, solute-solvent interactions exist and the magnitude of these interactions vary in different solvents. However, when temperature increases, these interactions become weak due to thermal disturbances. The solute-solvent interactionsincreases with increase in the chain length of alcohols due to the increase the ability of making hydrogen bonds, which decrease with increase the temperature. The specific interaction between the solute and solvents is again confirmed by negative entropy. The positive enthalpy suggests endothermic process in studied solutions. Whereas positive Gibbs energy of flow suggest that the process is non-spontaneous.

