


 English (pdf)
 Article in xml format
 Article references
 Send this article by e-mail
 Cited by SciELO
  Cited by Google
  Similars in
SciELO
Similars in
SciELO  Similars in Google
 Permalink
Introduction
The clinical heterogeneity of COVID-19 makes it necessary to perform complementary tests to establish a diagnosis with good sensitivity and specificity, especially because confirmation by PCR testing can take time.1 In addition, complementary tests can indirectly guide the initial diagnosis of an infection, facilitating decisions regarding patient management or initial therapeutic interventions. In this matter, Hanff et al.2 established that several non-specific inflammatory biomarkers, such as C-reactive protein, erythrocyte sedimentation rate, and ferritin, are significantly increased in patients with COVID-19. Also, according to the findings of Kermali et al3 in their systematic review, although these biomarkers may help improve prognosis and outcomes, significant inter-patient variability may affect study findings.
During the peaks of the COVID-19 pandemic, the need to identify clinical and laboratory predictors that determine the risk of progression to severe and fatal forms of the disease has become evident. The objective of identifying such predictors is to stratify risk and guide interventions to optimize the allocation of human and technical resources, which have been particularly limited during these periods, by detecting patients at greater risk of clinical worsening.4
In a systematic review including 207 studies, Izcovich et al.5 analyzed ferritin as a prognostic biomarker and found evidence of moderate to high certainty for both mortality and severe disease by COVID-19. Similarly, Zhou et al.6 established in their study that ferritin, besides playing a key role in serum iron homeostasis, is recognized as a marker of acute and chronic inflammation. Likewise, Ahmed et al.,7 in a cross-sectional study of 157 patients with COVID-19, found that elevated levels of this protein could be related to the severity of disease presentation, and could be considered a predictor of mortality.
Accordingly, the objective of the present study was to assess the performance of ferritin as a diagnostic biomarker in inpatients with suspected COVID-19 and as a prognostic biomarker in those with a confirmed diagnosis.
Materials and methods
Study type and population
Multicenter, prospective, observational study. The study population comprised all patients over 18 years of age hospitalized between April 15 and November 30, 2020, in the cohort areas for the care of patients with suspected COVID-19 of three quaternary care hospitals in Bogotá D.C., Colombia. For inclusion, patients were required to have a diagnosis of pneumonia, as per the case definition recommendations contained in the Colombian Clinical Care Guidelines,8 and to have undergone real-time polymerase chain reaction (RT-PCR) testing for SARS-CoV-2 (N=924). Patients who were admitted directly to the ICU, those coming from other institutions after 72 hours of hospital stay, those with any condition that seriously affected their short-term survival, and pregnant women were excluded, resulting in a final study sample of 711 patients.
The participating institutions were: the Unidad de Servicios de Salud El Tunal (a public hospital that became a referral center for the care of severe COVID-19 cases in the south of Bogotá), the Hospital de San José, and the Hospital Infantil Universitario de San José (two private hospitals under the auspices of the Sociedad de Cirugía de Bogotá). They are all quaternary care centers focused on the care of low- and middle-income populations, as well as undergraduate and postgraduate medical training institutions.
Procedures
After identifying the patients with suspected COVID-19 based on the daily census of each hospitalization areas, an online data collection form was filled out following the recommendations of the WHO Clinical Care for Severe Acute Respiratory Infection Toolkit.9 This way, data on demographic characteristics, clinical presentation, medical history, laboratory and diagnostic imaging results, complications, length of hospital stay, clinical outcomes, and results of the application of the clinical prediction rules for clinical worsening and in-hospital death were recorded.
Statistical analysis
The descriptive statistical analysis of the data included absolute frequencies and percentages for qualitative variables, and means and standard deviations for quantitative variables, given the normal distribution of the data, which was determined by means of the Shapiro-Wilks test.
A bivariate analysis was performed to establish differences between patients who survived and those who did not using T-Student tests for quantitative variables and Chi-square for qualitative variables, with a significance level of p<0.05. Then, based on the ferritin levels measured on hospital admission, the respective receiver operating characteristic (ROC) curves were generated for each of the three outcomes evaluated.
Subsequently, the area under the ROC curve (AUC) with a 95% confidence interval (95%CI) was calculated for each of the three outcomes. The optimal cutoff value was calculated using the Youden index, and based on this, contingency tables were constructed and the operating characteristics (sensitivity, specificity, accuracy, positive and negative predictive values [PPV and NPV], and positive and negative likelihood ratios [LR+ and LR-]) of ferritin levels for the outcomes described were calculated. Additionally, the operational characteristics of the 799 ng/mL cut-off value for in-hospital death were explored based on the study by Henry et al.4
Three series of bivariate analyses were performed using simple linear regression models, in which each of the variables listed in Table 1 (including ferritin) was taken as an independent variable and each of the successive outcomes for each series of analyses as a dependent variable; odds ratios (OR) with their corresponding 95%CI and p-values were calculated. Three multivariate analysis models were then developed for each of the outcomes by entering the variables that had a significant association (p<0.05) in the bivariate analyses to establish which were associated with each outcome. All statistical analyses were performed in R version 4.0.2 (R Foundation, Vienna, Austria) using the packages "pROC", "ROCit", and "cutpointr".
Table 1 Variables selected to evaluate associations with outcomes in the multivariate model.
| Medical record section | Variables | |
|---|---|---|
| Diagnostic | Demographic data: | Sex, age |
| Clinical presentation: | Duration of symptoms, fever, cough, odynophagia, rhinorrhea, chest pain, myalgia, arthralgia, asthenia, dyspnea, confusion, nausea, vomiting, diarrhea, headache, abdominal pain, smell or taste disorder | |
| Medical history: | Heart disease, hypertension, pulmonary disease, kidney disease, diabetes, smoking, obesity, number of diseases | |
| Vital signs: | Temperature, heart rate, respiratory rate, oxygen saturation, oxygen saturation | |
| Lab tests: | Hemoglobin, erythrocyte distribution width (RDW), leukocytes, neutrophils, lymphocytes, platelets, urea nitrogen, creatinine, C-reactive protein, lactate dehydrogenase, troponin, D-dimer, ferritin, pH, PaO2/FiO2 ratio | |
| Radiological: | Presence of infiltrates | |
| Prognostic | Demographic data: | Sex, age |
| Clinical presentation: | Duration of symptoms, fever, cough, odynophagia, rhinorrhea, chest pain, myalgia, arthralgia, asthenia, dyspnea, confusion, nausea, vomiting, diarrhea, headache, abdominal pain, smell or taste disorder | |
| Medical history: | Heart disease, hypertension, pulmonary disease, renal disease, neurological disease, diabetes, human immunodeficiency virus infection, smoking, rheumatologic disease, obesity, number of diseases, use of angiotensin-converting enzyme inhibitors or angiotensin II receptor antagonists | |
| Vital signs: | Temperature, heart rate, respiration rate, systolic blood pressure, diastolic blood pressure, oxygen saturation | |
| Lab tests: | Hemoglobin, erythrocyte distribution width (RDW), leukocytes, neutrophils, lymphocytes, platelets, urea nitrogen, creatinine, C-reactive protein, lactate dehydrogenase, troponin, D-dimer, ferritin, pH, PaO2/FiO2 ratio, carbon dioxide, sodium bicarbonate, lactate. | |
| Radiological: | Presence of infiltrates | |
Source: Own elaboration.
Ethical considerations
This research was approved by the ethics and research committees of each of the participating institutions according to Minutes 138 of June 26, 2020, issued by Unidad de Servicios de Salud El Tunal, 0498-2020 of June 23, 2020, issued by Hospital San José, and SDM-026-20 of September 22, 2020, issued by Hospital Infantil Universitario de San José.
The study took into account the ethical principles for research involving human subjects established in the Declaration of Helsinki10 and the health research provisions of Resolution 8430 of 1993 of the Colombian Ministry of Health.11 Since no interventions were performed directly on the patients during the study, informed consent was not required.
Results
Of the 711 participants, 141 were treated at the Unidad de Servicios de Salud El Tunal, 307 at the Hospital de San José, and 263 at the Hospital Infantil Universitario de San José. The distribution of patient characteristics by institution showed no major differences (Annex 1). Table 2 presents the differences between the characteristics of the sample based on RT-PCR result, showing that the result was negative in 119 patients and positive in 592.
Table 2 General characteristics of the population as determined by the result of the polymerase chain reaction test (positive and negative).
| Characteristic | Patients with negative PCR (n=119) | Patients with positive PCR (n=592) | p-value | |
|---|---|---|---|---|
| Female sex, n (%) | 54 (45.38%) | 236 (39.86%) | 0.310 | |
| Age (years), mean (SD) | 62.0 (18.4) | 59.6 (15.5) | 0.198 | |
| Obesity, n/number of patients with data (%) | 15/72 (20.83%) | 103/325 (31.69%) | 0.251 | |
| Comorbidities | Mean (SD) | 1.8 (1.4) | 1.3 (1.3) | <0.001 |
| At least one, n (%) | 99 (83.19%) | 406 (68.58%) | 0.002 | |
| Hypertension, n (%) | 57 (47.90%) | 225 (38.01%) | 0.056 | |
| Diabetes, n (%) | 19 (15.97%) | 108 (18.24%) | 0.645 | |
| Chronic heart disease (except hypertension), n (%) | 22 (18.49%) | 50 (8.45%) | 0.002 | |
| Chronic kidney disease, n (%) | 10 (8.40%) | 32 (5.40%) | 0.292 | |
| Smoking, n (%) | 30 (25.21%) | 128 (21.62%) | 0.460 | |
| Chronic lung disease, n (%) | 46 (38.66%) | 79 (13.34%) | <0.001 | |
| Duration of illness before admission to hospital (days), mean (SD) | 7.8 (10.2) | 7.7 (6.3) | 0.877 | |
| Lab tests | White blood cell count (x103 cells/µL), mean (SD) | 9.2 (6.1) | 7.7 (6.5) | 0.006 |
| Lymphocyte count (x103 cells/µL), mean (SD) | 1.2 (0.6) | 1.0 (0.6) | 0.002 | |
| Lymphocytes <1.0 x10³ cells/µL, n (%) | 56 (47.06%) | 341 (57.60%) | 0.029 | |
| Platelet count (x103 cells/µL), mean (SD) | 250 (102) | 236 (91) | 0.170 | |
| Creatinine (mg/dL), mean (SD) | 1.5 (2.3) | 1.4 (1.4) | 0.167 | |
| High-sensitivity C-reactive protein (mg/L), mean (SD) | 26.7 (43.5) | 68.0 (127.8) | <0.001 | |
| Ferritin (ng/mL), mean (SD) | 582 (599) | 1118 (1933) | <0.001 | |
| D-dimer (µg/mL), mean (SD) | 2307 (3754) | 1684 (7588) | 0.110 | |
| PaO2/FiO2 ratio, mean (SD) | 270 (85) | 237 (86) | <0.001 | |
| PaO2/FiO2 ratio <100, n/number of patients with data (%) | 2/111 (1.80%) | 41/570 (7.19%) | 0.053 | |
| Lactate dehydrogenase (U/L), mean (SD) | 377 (274) | 475 (282) | <0.001 | |
| Positive high-sensitivity cardiac troponin I, n/number of patients with data (%) | 22/108 (20.37%) | 122/546 (22.34%) | 0.689 | |
SD: standard deviation; PCR: polymerase chain reaction.
Source: Own elaboration.
Within the group of patients with a RT-PCR-confirmed diagnosis of COVID-19 (n=592), 39.86% (n=236) were women, the mean age was 59.65 years (SD=15.55), and the mean duration of symptoms prior to admission was 7.7 days (SD=6.3). The most frequent co-morbidities in this group were hypertension (38.01%), type 2 diabetes mellitus (18.24%), and chronic lung disease (n=79, 13.34%), while obesity and smoking were found in 31.69% and 21.62% of these participants, respectively. Mean ferritin levels were 1 118 (SD=1933); for lymphocytes, 1 000 cells/pL (SD=600); for lactate dehydrogenase, 475 (SD=282); and for PaO2/FiO2, 210 (SD=93).
No major differences were found in the demographic distribution between RT-PCR positive and negative populations. However, it was demonstrated that there is a higher prevalence of chronic lung disease in the negative cases and that LDH, CRP and ferritin levels were higher in the positive cases, while leukocytes, lymphocytes and PaO2/FiO2ratio were lower.
Table 3 outlines the characteristics of the 592 patients with a positive RT-PCR, differentiating cases between those who required transfer to the ICU (n=160) and those who died (n=107). Of the deceased participants, 72 died in the ICU and the other 35 in the general ward. Among the patients admitted to the ICU, a higher prevalence of obesity and smoking was found. In general, it can be said that patients admitted to the ICU and patients who died had higher levels of leukocytes, lactate, CRP, LDH and ferritin than their counterparts, with lower levels of lymphocytes and PaO2/FiO2 ratio; in addition, their severity scales were higher.
Table 3 Characteristics of patients diagnosed with COVID-19 for the outcomes "admission to intensive care" and "death".
| Characteristic | Patients with COVID-19 who were not admitted to the ICU (n=432) | Patients with COVID-19 admitted to the ICU (n=160) | p-value | Survivors (n=485) | Non-survivors (n=107) | p-value | |
|---|---|---|---|---|---|---|---|
| Female sex, n (%) | 181 (41.89%) | 55 (34.37%) | 0.117 | 194 (40.00%) | 42 (39.25%) | 0.973 | |
| Age (years), mean (SD) | 59.4 (16.3) | 60.2 (13.4) | 0.540 | 57.2 (15.0) | 70.6 (13.1) | <0.001 | |
| Obesity, n/number of patients with data (%) | 64/226 (28.32%) | 39/99 (39.39%) | 0.009 | 85/276 (30.80%) | 18/49 (36.73%) | 0.974 | |
| Comorbidities | Mean (SD) | 1.3 (1.3) | 1.4 (1.3) | 0.291 | 1.2 (1.3) | 1.8 (1.5) | 0.001 |
| At least one, n (%) | 289 (66.90%) | 117 (73.12%) | 0.177 | 324 (66.80%) | 82 (76.64%) | 0.062 | |
| Hypertension, n (%) | 162 (37.50%) | 63 (39.38%) | 0.747 | 175 (36.08%) | 50 (46.73%) | 0.052 | |
| Diabetes, n (%) | 74 (17.13%) | 34 (21.25%) | 0.302 | 82 (16.91%) | 26 (24.30%) | 0.098 | |
| Chronic heart disease (except hypertension), n (%) | 36 (8.33%) | 14 (8.75%) | 1.000 | 36 (7.42%) | 14 (13.08%) | 0.086 | |
| Chronic kidney disease, n (%) | 23 (5.32%) | 9 (5.62%) | 1.000 | 18 (3.71%) | 14 (13.08%) | <0.001 | |
| Smoking, n (%) | 84 (19.44%) | 44 (27.50%) | 0.045 | 100 (20.62%) | 28 (26.17%) | 0.257 | |
| Chronic lung disease, n (%) | 63 (14.58%) | 16 (10.00%) | 0.187 | 61 (12.58%) | 18 (16.82%) | 0.312 | |
| Chronic neurological disease, n (%) | 38 (8.80%) | 6 (3.75%) | 0.057 | 29 (5.98%) | 15 (14.02%) | 0.008 | |
| Chronic liver disease, n (%) | 1 (0.23%) | 2 (1.25%) | 0.369 | 2 (0.41%) | 1 (0.93%) | 1.000 | |
| Duration of illness before hospital admission (days), mean (SD) | 7.6 (5.6) | 7.9 (8.0) | 0.645 | 7.5 (5.2) | 8.3 (10.0) | 0.456 | |
| Lab tests | White blood cell count (x103 cells/µL), mean (SD) | 8.5 (3.9) | 10.3 (4.5) | <0.001 | 7.5 (6.6) | 8.8 (6.1) | 0.004 |
| Lymphocyte count (x103 cells/µL), mean (SD) | 1.1 (0.5) | 0.9 (0.6) | 0.002 | 1.1 (0.5) | 0.9 (0.8) | 0.031 | |
| Lymphocytes <1.0 x10³ cells/µL, n (%) | 235 (54.40%) | 109 (68.12%) | 0.001 | 247 (50.93%) | 74 (69.16%) | 0.005 | |
| Platelet count (x103 cells/µL), mean (SD) | 237 (92) | 232 (86) | 0.520 | 238 (90) | 226 (93) | 0.234 | |
| Lactate (mmol/L), mean (SD) | 1.7 (0.6) | 1.9 (1.0) | 0.007 | 1.7 (0.7) | 2.0 (1.1) | 0.029 | |
| Creatinine (mg/dL), mean (SD) | 1.1 (1.4) | 1.3 (1.5) | 0.150 | 1.0 (1.3) | 1.6 (2.0) | 0.002 | |
| High-sensitivity C-reactive protein (mg/L), mean (SD) | 56.2 (71) | 72.2 (94) | 0.051 | 62.0 (129.1) | 95.5 (117.8) | 0.006 | |
| Ferritin (ng/mL), mean (SD) | 928 (888) | 1631 (3375) | 0.010 | 1081 (2036) | 1284 (1367) | 0.210 | |
| D-dimer (µg/mL), mean (SD) | 1269 (2677) | 1818 (3809) | 0.213 | 1120 (2272) | 2759 (5130) | 0.001 | |
| Lab tests | PaO2/FiO2 ratio, mean (SD) | 246 (79) | 210 (93) | <0.001 | 245 (82) | 201 (93) | <0.001 |
| PaO2/Fi O2 ratio <100, n/number of patients with data (%) | 16/413 (3.87%) | 134/157 (85.35%) | <0.001 | 22 (4.54%) | 19/104 (18.27%) | <0.001 | |
| Lactate dehydrogenase (U/L), average (SD) | 442 (246) | 566 (339) | <0.001 | 458 (283) | 558 (264) | 0.001 | |
| Positive high-sensitivity cardiac troponin I, n/ number of patients with data (%) | 70/395 (17.72%) | 52/151 (34.44%) | <0.001 | 86/446 (19.28%) | 39/100 (39.00%) | <0.001 | |
| Length of hospital stay (days), mean (SD) | 9.1 (7.0) | 19.8 (27.0) | <0.001 | 11.6 (10.2) | 13.7 (10.8) | 0.060 | |
| Risk prediction scales on admission | NEWS-2, average (SD) | 4.6 (2.3) | 5.8 (2.4) | <0.001 | 4.7 (2.4) | 5.7 (2.3) | <0.001 |
| SOFA, average (SD) | 2.3 (1.5) | 3.0 (2.0) | <0.001 | 2.2 (1.5) | 3.5 (2.3) | <0.001 | |
| qSOFA, average (SD) | 0.3 (0.5) | 0.6 (0.6) | <0.001 | 0.4 (0.5) | 0.6 (0.7) | <0.001 | |
| CURB-65, mean (SD) | 0.8 (0.9) | 1.0 (1.0) | 0.006 | 0.7 (0.8) | 1.5 (1.0) | <0.001 | |
SD: standard deviation; NEWS: National Early Warning Score; SOFA: Sequential Organ Failure Assessment; qSOFA: Quick Sequential Organ Failure Assessment.
Source: Own elaboration.
The mean ferritin level in the different populations of interest was: 582 ng/mL (SD=599) in patients who had COVID-19 ruled out vs. 1 118 ng/mL (SD=1 933) in confirmed cases; 1 631 ng/mL (SD=3 375) in confirmed cases who were admitted to the ICU vs. 928 ng/mL (SD=888) in those who were not (p=0.009); and 1 284 ng/mL (SD=1 367) in confirmed cases who died vs. 1 081 ng/mL (SD=2 036) in survivors (p=0.326).
Figure 1A shows the distribution of ferritin levels depending on the presence or absence of the different outcomes. AUC of ferritin levels for COVID-19 diagnosis, ICU admission and in-hospital death were 0.674 (95%CI: 0.620-0.728), 0.580 (95%CI: 0.568-0.669), and 0.565 (95%CI: 0.505-0.626), respectively. Figure 1B shows the respective ROC curves.
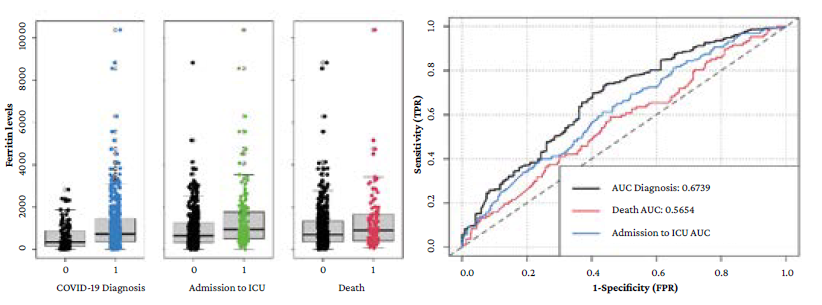
AUC: area under the ROC curve; ICU: intensive care unit.
Source: Own elaboration.
Figure 1 A) box plot with the ferritin levels distribution between the absence (0) or presence (1) of the outcomes evaluated; B) ROC curves for the prediction of the different outcomes based on ferritin levels.
Table 4 indicates that the bivariate analysis showed that ferritin level was significantly associated with a diagnosis of confirmed COVID-19 (p=0.003) and with admission to the ICU (p<0.001), but not with in-hospital death (p=0.326); consequently, a multivariate analysis was not performed for the latter outcome. On the other hand, in the multivariate analysis, ferritin levels were only significantly associated with admission to the ICU (p=0.009). Variables associated in the multivariate analysis with COVID-19 diagnosis were: fever, pulmonary disease, red cell distribution width (RDW), leukocytes, creatinine, CRP, pH, and PaO2/FiO2 ratio (Annex 2). In the case of ICU admission, the variables associated were: obesity, lymphocytes, troponin, pH, Pa PaO2/FiO2 ratio, and ferritin (Annex 3).
Table 4 Results of bivariate and multivariate analyses of ferritin levels with respect to their association with the different outcomes.
| Outcome | Bivariate Analysis | Multivariate Analysis | ||||
|---|---|---|---|---|---|---|
| OR | 95%CI | p-value | OR | 95%CI | p-value | |
| COVID-19 diagnosis | 1.000023 | 1.000008-1.000039 | 0.003 | 1.000011 | 0.999996-1.000026 | 0.144 |
| Admission to intensive care unit | 1.000037 | 1.000018-1.000056 | <0.001 | 1.000025 | 1.000006-1.000044 | 0.009 |
| In-hospital death | 1.000008 | 0.999992-1.000024 | 0.326 | - | - | - |
CI: confidence interval; OR: odds ratio.
Source: Own elaboration.
After evaluating the operating characteristics of the different optimal cut-off values for each outcome (Table 5), it was found that for confirmed COVID-19 diagnosis it was 1 500 ng/mL, with an accuracy, sensitivity and specificity of 35.4%, 24.0% and 92.4%, respectively, and for ICU admission it was 1 500 ng/mL, with an accuracy, sensitivity and specificity of 72.1%, 13.8% and 93.8%, respectively. It should be noted that the optimal cut-off value for ICU admission found in the literature was 408 ng/mL, with accuracy, sensitivity and specificity of 46.5%, 33.3% and 81.9%, respectively. On the other hand, the optimal cut-off value for in-hospital death could not be obtained due to the poor performance of the biomarker in the AUC, although it is important to point out that the optimal cut-off value for mortality found in the literature was 760 ng/mL, with an accuracy, sensitivity and specificity of 54.9%, 58.9% and 54.0%, respectively.
Table 5 Operating characteristics of ferritin for the different outcomes using different cut-off points.
| Characteristics | Diagnosis | ICU admission | Death | |||
|---|---|---|---|---|---|---|
| Cut-off point 1 500 ng/mL | Cut-off point 1 500 ng/mL | Cut-off point 2 400 ng/mL | Cut-off point 799 ng/mL | Cut-off point 1 500 ng/mL | Cut-off point 2 400 ng/mL | |
| True positive | 142 | 55 | 22 | 61 | 32 | 14 |
| True negative | 110 | 345 | 405 | 267 | 375 | 450 |
| False positive | 9 | 87 | 27 | 218 | 110 | 35 |
| False negative | 450 | 105 | 138 | 46 | 75 | 93 |
| Accuracy (%) | 35.4 | 67.6 | 72.1 | 55.4 | 68.8 | 78.4 |
| Sensitivity (%) | 24.0 | 34.4 | 13.8 | 57.0 | 29.9 | 13.1 |
| Specificity (%) | 92.4 | 79.9 | 93.8 | 55.1 | 77.3 | 92.8 |
| Positive predictive value (%) | 94.0 | 38.7 | 44.9 | 21.9 | 22.5 | 28.6 |
| Negative predictive value (%) | 19.6 | 76.7 | 74.6 | 85.3 | 83.3 | 82.9 |
| LR+ | 3.172 | 1.707 | 2.200 | 1.268 | 1.319 | 1.813 |
| LR- | 0.822 | 0.822 | 0.920 | 0.781 | 0.907 | 0.937 |
LR: Likelihood ratio; ICU: Intensive care unit.
Note: the results in bold are the specific optimal cut-off values for the outcome assessed.
Source: Own elaboration.
Discussion
Since the emergence of COVID-19 in December 2019, and because of the global impact it has caused, the need to identify biomarkers that may be associated with its diagnosis and clinical worsening and mortality prognosis has gained relevance.4 To this end, one of the tests proposed is the measurement of ferritin levels.
Ruan et al.,12 based on a report of 150 patients from Wuhan, China, were the first to propose that COVID-19 mortality may be related to a cytokine storm. In this regard, Hanff et al.2 pointed out that a factor favoring the appearance of this immune reaction, as well as the hypercoagulable state observed in patients with COVID-19, is macrophage activation syndrome, which occurs when activated antigen-presenting cells cannot be lysed by CD8 T cells or natural killer cells.2,13
Back in 2014, Colafrancesco et al.14 had already established that soluble CD163 (sCD163) is an important serum marker for macrophage activation, and that it is elevated, alongside ferritin, during acute inflammation, which is why the measurement of ferritin levels for diagnostic purposes in COVID-19 was proposed.15 Moreover, as a complement to this pathophysiological background, Ruscitti et al.16 determined the role of ferritin H-chain in macrophage activation to increase the secretion of inflammatory cytokines in COVID-19 patients.
According to the findings of the present study, the mean ferritin levels were higher in patients diagnosed with COVID-19 (582 ng/mL vs. 1 118 ng/mL), with an overlap in the interquartile ranges of the box plot; however, no significant association between ferritin levels and diagnosis was observed in the multivariate analysis (p=0.144). It was also established that the optimal cut-off value for diagnosis (1 500 ng/mL), although it had a very high specificity and PPV, had poor sensitivity and accuracy, which is consistent with the modest level of the AUC (0.674).
In a meta-analysis that consolidated information from 57 563 patients across 189 studies, Taneri et al.17 found that, based on findings from 54 observational studies with a total of 24 262 COVID-19 patients, pooled mean ferritin levels were 777 ng/mL (95%CI: 701-853) and were significantly associated with age and mortality. This differs from the present study, where the level was much higher (1118 ng/mL), which may be due to the fact that only inpatients were selected.
Taneri et al.17 also reported a significant difference of 606.37 ng/mL (95%CI: 461.86-750.88; p-value for heterogeneity <0.001) in mean ferritin levels between survivors and non-survivors when estimates from 18 observational studies (7 190 individuals in total) were combined. This is also consistent with the meta-analysis of Henry et al,.4 who also found, based on 2 clinical studies with data from 341 patients, that ferritin levels were significantly higher in deceased patients (760 ng/mL) and in those with the severe form of the disease (408 ng/mL). In the present study, the difference between patients who died and those who survived was not as wide or significant (203 ng/mL; p=0.326), although it was significant between those who required ICU admission and those who did not (703 ng/mL; p=0.009).
The SEMI-COVID-19 registry,18 which included 15 111 patients hospitalized until June 2020 in 150 hospitals in Spain, documented elevated ferritin levels (>300 ng/mL) in 73.5% of cases. A similar situation was observed in the present study, where 79.9% of the population had elevated values at the same cut-off point.
On the other hand, in a retrospective study conducted in New York with 942 patients, Feld et al.19 found that death was poorly predicted by peak ferritin levels on admission as they obtained an AUC of 0.638, with an optimal cut-off point of799 ng/mL. This is consistent with the findings of the present study, in which the AUC was also low (0.565), although much poorer, so it was not possible to establish an optimal cut- off point. Feld et al.19 also found that the PPV of 35.6% and NPV of 77.6% obtained in their study indicate that the measurement of ferritin levels is a rather poor predictor of all-cause mortality, a finding quite similar to that reported in the present study, where the PPV and NPV were found to be 21.9% and 85.3%, respectively, for the same cut-off point.
The FerVid study,20 which included 200 patients with COVID-19 admitted to 4 Italian internal medicine units, explored the highly elevated ferritin levels (>3000 ng/mL) present in 8% of the participants and found that they were significantly associated with poor outcomes (OR: 16.67, 95%CI: 16.67, 95%CI: 4.89-57.57; p<0.001). In the present study, although such a high cut-off value was not established, a high specificity for death (92.8%) could be established at 2 400 ng/mL.
In a study evaluating inflammatory markers and their association with clinical worsening in 389 hospitalized patients from Wuhan (China), Hou et al.21 found an AUC of 0.812 for ferritin with an OR of 1.0006 (95%CI: 1.0001-1.0010; p=0.0206) in the multivariate analysis. In another study involving 141 inpatients with COVID-19 in Italy, Gandini et al.22 documented excellent prognostic accuracy of disease severity for this same protein with an AUC of 0.939 (95%CI: 0.894-0.985; p<0.001), with an OR of 1.0048 (95%CI: 1.0029-1.0083; p<0.001). In the present study, a poor predictive performance for ICU admission was obtained with an AUC of 0.580, while the OR was 1.000025 (95%CI: 1.0000058-1.0000445; p=0.0095), a much lower value than previous reports. This result may be interpreted as meaning that for every 100 ng/mL of ferritin, the risk of ICU admission increases by 0.25% (95%CI: 0.06-0.44) in these patients. Possible explanations for the lack of association between ferritin levels and diagnosis reported here are that indications for ICU admission, as opposed to actual transfers, may have varied between centers or over time depending on the status of the pandemic or bed availability, in addition to population heterogeneity.
Regarding the outcome "confirmation of COVID-19 diagnosis", although no significant association was found with ferritin levels, it should be noted that some cases reported as negative could yield false-negative results in the RT-PCR test. Although it was not the aim of the present work, at this point it is worth mentioning that Papamanoli et al.23 suggested that ferritin could be a useful biomarker to predict response to corticosteroids in patients with severe COVID-19 pneumonia.
The present study had several limitations, such as the fact that the populations included were taken from quaternary care hospitals, which may induce a selection bias in the case of patients with a higher baseline severity, and that the variables were evaluated only at the time of admission to the hospital, which could have implications for the performance presented. However, the multicenter nature of the study and the large number of patients included, the outcomes found, and the statistical analyses performed stand out as strengths.
Conclusions
Measurement of serum ferritin levels showed moderate diagnostic accuracy for COVID-19 (AUC of 0.67) and poor prognostic performance for both ICU admission and mortality. Although a significant association between serum ferritin levels and admission to the ICU was found in the multivariate analysis, there was no significant association with COVID-19 diagnosis confirmation or mortality. In conclusion, neither the diagnosis of patients with suspected COVID-19 nor the prognosis of those with a confirmed diagnosis can be determined based on serum ferritin levels alone.

