


 English (pdf)
 Article in xml format
 Article references
 Send this article by e-mail
 Cited by SciELO
  Cited by Google
  Similars in
SciELO
Similars in
SciELO  Similars in Google
 Permalink
INTRODUCTION
Physalis peruviana L., also known as cape golden berry in Colombia, uvilla in Ecuador, aguaymanto in Peru, topotopo in Venezuela, and golden berry in English-speaking countries (Puente et al., 2011). It is an exotic tropical fruit of the family Solanaceae (Knapp, 2001). According to Vargas et al. (2010) , the genus Physalis comprises more than 90 native species of America, with Mexico as the center of diversity. Within this genus, P. peruviana stands out for its high nutraceutical value and antiinflammatory, antioxidant, and anticancer properties (Ramadán, 2011; Jin et al., 2012; Kindscher et al., 2014; Takimoto et al., 2014; Castro et al., 2015; Hassan et al., 2017). Also, its nutritional value is attributed to high levels of vitamins A, B, and C, polyunsaturated fatty acids, proteins, and minerals (Puente et al., 2011; Ramadán, 2011). Several studies show that supercritical carbon dioxide extracts of the leaves induce cell cycle arrest and apoptosis in human lung cancer H661 cells (Wu et al., 2009). Moreover, 4β-hydroxywithanolide E (4βHWE), isolated from the stems and leaves, is a potential chemotherapeutic agent against lung cancer (Yen et al., 2010).
Cape golden berry is an important crop in the Tropics since it is an exportable fruit with high competitive advantages due to its production and permanent supply to international markets. According to the report by the Asociación Nacional de Comercio Exterior (National Association for External Commerce), in 2018, Colombia exported 7.271tons to markets in the Netherlands, Germany, United States, United Kingdom, Canada, and Belgium. In particular, the Netherlands was the main import country, accounting for 57.75%. In 2018, the department of Nariño showed yields of 8t.ha-1, occupying a fourth place at the national level (ANALDEX, 2018). Accordingly, considering the importance and potential of this species for fruticulture development in the Colombian Andean region, it is necessary to understand and use the existing genetic resources in the country. For this, Chacón et al. (2016) suggest conducting studies focused on the collection, conservation, and characterization of golden berry to propose genetic improvement strategies for the species.
Colombia has domesticated and wild type germplasm conserved in research centers and universities. This material has been assessed in terms of its biological, morphological, agronomical, and molecular characteristics and its reaction to phytosanitary problems (Garzón-Martínez et al., 2012; Garzón et al., 2015; Martínez et al., 2015; Chacón et al., 2016; Osorio et al., 2016; Simbaqueba et al., 2017). For genetic characterization studies, the most useful molecular markers to assess genetic diversity in plants are microsatellites or simple sequence repeats (SSRs), which are tandem repeats of DNA motifs spanning one to six nucleotides (Kalia et al., 2011). SSR are the markers of choice for population genetics studies in many organisms since they are highly polymorphic and of codominant inheritance (Juyó et al., 2015). Microsatellite markers have been applied in studies on Solanum, Rubus and Passiflora, among other genera (Ortiz et al., 2012; Bushakra et al., 2015; Juyó et al., 2015).
There is little information on the genetic variability of P. peruviana at the molecular level, due to the lack of available DNA markers (Garzón et al., 2015). However, studies by Bonilla et al. (2008) and Morillo et al. (2011), among others, have used dominant markers such as RAMs (random amplified microsatellites) to assess the genetic diversity of collections at Universidad Nacional de Colombia Palmira campus and Universidad de Nariño, respectively. Simbaqueba et al. 2011 identified polymorphic loci from SSRs based on transcriptome sequences from leaves of the Colombia ecotype. In 2018, Morrillo et al. characterized the genetic diversity of the cape gooseberry in the department of Boyaca through RAM markers.
Garzón-Martínez et al. (2012) sequenced and assembled the leaf transcriptome of P. peruviana through ESTs (Expressed Sequence Tags) from cDNA (complementary DNA). Based on this transcriptome, primers for 162 SSR loci located in non-coding regions were designed to anneal to coding and non-coding regions. These primers were assessed on seven accessions of P. peruviana and Physalis floridana Rydb., which showed 30 polymorphic loci. Also, Chacón et al. (2016) assessed the genetic structure of 85 golden berry accessions from the Central, Western, and Eastern mountain ranges using 15 SSR markers. The authors reported low diversity for the accessions.
This study characterized 40 cape gooseberry Physalis peruviana L. genotypes from AGROSAVIA Tibaitata and the collection of Universidad de Nariño using SSR (microsatellite) markers to determine genetic variability, its magnitude, and population structure.
MATERIALS AND METHODS
Genetic material. The genetic material comprised 40 genotypes of golden berry P. peruviana (Table 1), among which 21 belonged to the collection of Universidad de Nariño (UDENAR) and 19 were introduced from AGROSAVIA Tibaitata in 2015. The latter genotypes corresponded to nine double haploid (DH) lines obtained from anther culture (Suescún et al., 2011) and ten genotypes tolerant to Fusarium oxysporum (FT) (González and Barrero, 2011).
Table 1. Cape gooseberry Physalis peruviana L. genotypes used to analyze genetic diversity using SSR markers.
| Agrosavia | Universidad de Nariño | ||||||
|---|---|---|---|---|---|---|---|
| No. | Introduction | No. | Introduction | No. | Introduction | No. | Introduction |
| 1 | 12U347- DH | 12 | 09U099-TF | 20 | UN01 | 31 | UN43 |
| 2 | 12U350-DH | 13 | 09U116-TF | 21 | UN03 | 32 | UN45 |
| 3 | 12U352- DH | 14 | 09U128-TF | 22 | UN13 | 33 | UN49 |
| 4 | 12U357-DH | 15 | 09U136-TF | 23 | UN14 | 34 | UN52 |
| 5 | 12U360-DH | 16 | 09U138-TF | 24 | UN19 | 35 | Silvania |
| 6 | 12U368-DH | 17 | 09U140-TF | 25 | UN26 | 36 | Perú |
| 7 | 12U374-DH | 18 | 13U407-TF | 26 | UN30 | 37 | Colombia |
| 8 | 12U377-DH | 19 | 13U408-TF | 27 | UN34 | 38 | Puracé |
| 9 | 12U399-DH | 28 | UN35 | 39 | Kenia | ||
| 10 | 09U086-TF | 29 | UN36 | 40 | Testigo | ||
| 11 | 09U089-TF | 30 | Neira | ||||
DH = double haploid line, TF = Fusarium oxysporum-tolerant group
DNA extraction. Young leaves from seedlings grown in a greenhouse were used. Three to four healthy leaves were collected from each genotype. The leaves were preserved in foil paper deposited in hermetic bags and stored at -20°C until they were processed at the Laboratory of Molecular Biology of the research group in Andean Fruit Production (Producción de Frutales Andinos) (GPFA) of Universidad de Nariño. Next, 100mg was taken of plant material and homogenized it in liquid nitrogen to obtain pulverized tissue. The homogenized tissue was transferred to 1.5 mL microcentrifuge tubes and stored at -20°C. DNA extraction was performed using the GenJET Plant Genomic DNA Purification kit (Thermo Scientific). The DNA was visualized through horizontal 0.8% agarose gel electrophoresis stained with ethidium bromide.
DNA quantification. The amount of DNA was determined through UV spectrophotometry on a Nanodrop One instrument using 1μL of elution buffer from the extraction kit as blank and 1μL of DNA from each sample. The DNA amount was expressed as ng/μL (Fierro, 2014). After, the samples were diluted in HPLC-grade water to a concentration of 10 ng/μL and stored them at -20°C.
SSR amplification. The DNA samples from the 40 genotypes were amplified through PCR using six microsatellite markers specific for P. peruviana L. (Table 2), which were designed from the leaf transcriptome of cape gooseberry (Simbaqueba et al., 2011).
Table 2. Characteristics of the six microsatellite markers used in this study.
| IDM | PP (5´-3´) | PR (5´-3´) | AT (°C) | ES (bp) | ER (bp) | Mcte |
| SSR11 | CAGCTGAAATAAGAGAGTGATTGG | CCCTCTTTTTCTCCTCCGAGT | 58 | 180 | 180-210 | AG |
| SSR15 | GCTTGTTGATCAGCTTTCTTTG | TGGATCATAACCTTGCTAATGC | 58 | 172 | 160-180 | AT |
| SSR112 | CTACGCCTACCACTTGCACA | CAGTGGAAGCCTCAAGATCC | 58 | 203 | 200-220 | TCT |
| SSR123 | TCAGTGGAGCGCGTATATCT | GCGATCTCACCAAACCTCTC | 58 | 216 | 190-210 | ATC |
| SSR138 | TCCGATCACTACTTCAGCACG | CAATTCGGGTTGTGAATCGGGT | 58 | 138 | 130-160 | AAT |
| SSR146 | AGGCTAATGAGGACGAAGCA | GGTTGCATTACAAAGCACTGA | 58 | 187 | 160-210 | AAAAG |
AT= annealing temperature, ES= expected size in bp, ER= expected range in bp, and Mcte= microsatellite. Adapted from: Simbaqueba et al. (2011).
The reactions were prepared according to the protocol described for the Scientific PCR Master Mix (2X) for a final reaction volume of 25µl and amplifications were performed on a MultiGene OptiMAX thermocycler (Labnet) following the temperature conditions reported by Simbaqueba et al. (2011).
The PCR products were visualized on 6.5% polyacrylamide gels through vertical electrophoresis on a Mini-protean Tetra Cell chamber (Biorad) for 70 minutes at 150V and 400mA. The amplicon sizes were estimated by comparison to a 50 bp molecular ladder (Thermo Scientific GeneRuler 50 bp). The gels were stained with ethidium bromide solution, agitated for 40 minutes, and visualized under UV light in an ENDURO GDS (Labnet) photodocumenter.
Data analysis. The band patterns were consolidated on an Excel spreadsheet in which the rows correspond to individuals and columns to the markers and their alleles. The data matrix contained the fragment length in base pairs (bp), assigning two values per locus for each individual. Accordingly, similar values per locus were considered homozygote and different values were considered heterozygote (Gil, 2015).
The genetic diversity of the 40 genotypes was estimated base on the number of alleles (Na), number of effective alleles (Ae), Shannon information index (I), expected heterozygosity (HE), observed heterozygosity (Ho), and fixation index (F). Likewise, the genetic structure was determined through F-statistics, including the average of the inbreeding coefficient (FIS), global genetic fixation index (FIT), genetic differentiation (FST), and rate of gene flow (Nm) using GenAlex v 6.5 (Peakall and Smouse, 2012) and Arlequín 3.5.2 (Excoffier et al., 2005) software. These programs allow evaluating genetic diversity through multivariate analyses based on population parameters. The polymorphic information content (PIC) for each locus was also calculated.
We built a matrix of Nei (1972) genetic distance, values was used to assess the genetic relationships between the DH, FT, and UDENAR populations. This distance assumes a mutational model of infinite allele. Based on this matrix, we defined the genetic population structure through an Analysis of Molecular Variance (AMOVA) with the three populations using GenAlEx v. 6.5 with 9999 permutations (Excoffier et al., 1992; Peakall and Smouse, 2012).
RESULTS AND DISCUSSION
Were obtained DNA concentrations between 16.4 and 119.4 ng/μL with acceptable purity based on A260/280 ratios of 1.67-1.89 and 260/230 ratios between 2.16 and 3.24 (Alejos et al., 2014). Nonetheless, DNA quantity was not a limiting factor for analyses since microsatellite markers require small amounts of DNA for amplification. This is one of the main advantages of these PCR-based markers (Yadav et al. 2007).
Table 3 shows the diversity indices of the SSR markers used to assess the genetic diversity of 40 genotypes of Physalis peruviana. These indices included the number of alleles (Na), effective alleles (Ae), Shannon information index (I), expected heterozygosity (HE), observed heterozygosity (Ho), polymorphic information content (PIC), and fixation index (F).
Table 3. Genetic diversity indexes for 40 cape gooseberry genotypes using SSR markers.
| Locus | Na | Ae | I | Ho | He | PIC | F |
| SSR11 | 1.00 | 1.00 | 0.00 | 0.00 | 0.00 | 0.00 | - |
| SSR15 | 1.33 | 1.07 | 0.10 | 0.06 | 0.06 | 0.09 | -0.11 |
| SSR112 | 1.00 | 1.00 | 0.00 | 0.00 | 0.00 | 0.00 | - |
| SSR123 | 1.00 | 1.00 | 0.00 | 0.00 | 0.00 | 0.00 | - |
| SSR138 | 2.00 | 1.99 | 0.69 | 0.97 | 0.50 | 0.51 | -0.94 |
| SSR146 | 1.00 | 1.00 | 0.00 | 0.00 | 0.00 | 0.00 | - |
| Average | 1.22 | 1.22 | 0.13 | 0.17 | 0.09 | 0.12 | -0.73 |
One to two alleles per locus were found for a total of 7.33 alleles and an average of 1.22. The observed allele size was close to the expected allele size reported by Simbaqueba et al. (2011). However, the number of alleles per locus found in this study was low compared to other studies. For instance, Chacón et al. (2016) reported average values of Na of 3.05 and Wei et al. (2012) reported values between 3.3 and 4.4 in 22 introductions of Physalis philadelphica and 14 accessions of other species of Physalis, including three of P. peruviana. These values are higher than those obtained for the three populations analyzed in the study here, which showed a Na value of 1.22 and Ae between 1.17 and 1.20 (Table 4).
Tabla 4. Genetic diversity values for three golden berry populations based on SSR markers.
| Population | N | Na | Ae | I | Ho | HE | F |
|---|---|---|---|---|---|---|---|
| DH | 9.00 | 1.17 | 1.17 | 0.12 | 0.17 | 0.08 | -1.00 |
| TF | 10.00 | 1.17 | 1.17 | 0.12 | 0.17 | 0,08 | -1,00 |
| UDENAR | 21.00 | 1.33 | 1.20 | 0.17 | 0.18 | 0.11 | -0.47 |
| Average | 13.3 | 1.22 | 1.18 | 0.13 | 0.17 | 0.09 | -0.73 |
N= number of individuals, Na= number of alleles, Ae= number of effective alleles, I= information index, Ho= observed heterozygosity, HE= expected heterozygosity, F= fixation index.
In this regard, Garzon et al. (2015) reported two alleles per locus using SNP markers to assess the genetic diversity of P. peruviana. This value is comparable to the one found here, suggesting that, despite the variable ploidy of Physalis spp (Liberato et al., 2014), the species can behave as allotetraploids. In Solanum lycopersicum, Choudhary et al. (2018) reported 65 alleles based on 25 SSR markers, with a range of 2 to 5 alleles per locus and a mean value of 2.72 alleles per locus. These values are higher than those found in this study. On the other hand, the number of effective alleles (Ae) ranged from 1.0 to 1.99, with a mean of 1.22. In Solanum tuberosum, Juyó (2012) reported Ae values between 0.91 and 2.48 using SRR markers. These values are also higher than those found here.
The observed heterozygosity (Ho) was 0.17, the expected heterozygosity (HE) 0.09, and the polymorphic information content (PIC) was 0.12, with a fixation index (F) of -0.73. Of the six SSR markers amplified from the 40 golden berry genotypes, 77.8% were monomorphic and 22.2% were polymorphic (Table 3). SSR15 and SSR138 were the only markers that showed polymorphism in the study genotypes, visualized by bands between 160 and 180 bp and 130 and 160 bp, respectively. Figure 1 shows an example of the band patterns generated by the six SSR markers.
The most polymorphic SSR locus was SSR138 with a PIC of 0.51, followed by SSR15 with a PIC of 0.09. The average PIC value was 0.12 for the entire collection. Based on this PIC and according to Ge et al. (2013), the SSR loci studied have low polymorphism and low discriminative values. Moreover, the PIC of SSR15 is much lower than the one reported by Chacón et al., (2016). Specifically, the authors reported a PIC of 0.56 for SSR15, which was the most polymorphic marker in that study. Also, they found an average PIC of 0.215 for 15 microsatellite markers used to assess the genetic diversity in different regions of Colombia. Similarly, Garzón et al. (2015) obtained an average PIC value of 0.37 within a range of 0.09 to 0.66 by analyzing 47 accessions of P. peruviana and 13 related taxa based on 24 InDel markers.
Only two of the six markers analyzed proved polymorphic. These microsatellite markers were designed from exon regions based on the leaf transcriptome of the golden berry (Simbaqueba et al., 2011). Therefore, these regions are more conserved among individuals compared to intron regions, as discussed by Espósito and Martin (2011).
The variability reported in the species by Simbaqueba et al. (2011) was based on polymorphisms identified for Physalis floridana with markers SSR112, SSR123, and SSR138. Accordingly, these markers were included in this study, yet they were invariable except for SSR138, as observed from the diversity indices (Table 3).
Of the total loci analyzed, a 22.2% of polymorphic loci was found. This value is low compared to 86% polymorphic loci reported by Morillo et al. (2011) using RAM markers on 18 cape gooseberry introductions of the collection of Universidad de Nariño. More recently, Morillo et al. (2018)reported 79.26% polymorphic loci using RAM markers to characterize the genetic diversity 15 wild type cape gooseberry specimens.
Shannon information index (I) ranged from zero to 0.69. SSR11, SSR112, SSR123, and SSR146 markers showed values of zero, while SSR15 and SSR138 showed values of 0.10 and 0.69, respectively (Table 3). These findings indicate that the allelic richness of the genotypes is moderate to low. According to Costa (2014), an information index value close to one indicates a high level of diversity; consequently, SSR138 is the most informative marker. Juyó (2012) found values for I between 0.489 and 1.130 in Solanum tuberosum, which are comparatively higher than those reported here.
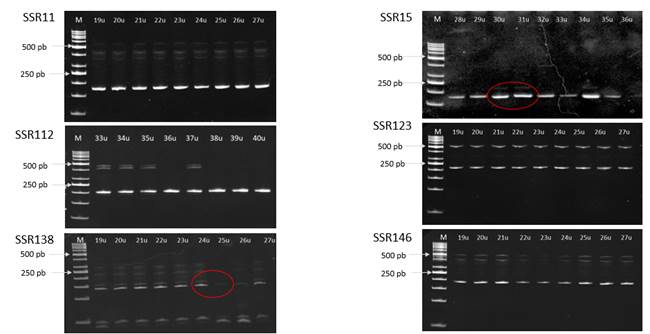
Figure 1. Band patterns obtained for markers SSR11, SSR15, SSR112, SSR123, SSR138, and SSR146 compared to a molecular ladder of 50pb.
Furthermore, we found that the DH and TF populations showed less allelic richness (I=0.12) compared to the UDENAR population (I=0.17) (Table 4). Although UDENAR is more diverse (Costa, 2014), the PIC values found here are too low to reveal any significant diversity differences among populations.
The He values were 0.06 and 0.50 for SSR15 and SSR138, respectively. The average He value for the six SSR markers was 0.09 (Table 3), which is much lower than the one reported by Morillo et al. (2018) (He=0.25). However, the authors studied a different population using dominant RAM markers that can underestimate allelic diversity compared to codominant markers, such as those used here (Garzón et al., 2015). Chacón et al. (2016) reported a He value of 0.22, which is also higher than the one found in this study. Nevertheless, the authors considered this value to be low due to the sample size, the origin of the accessions, and the type of marker used. Garzón et al. (2015) worked with P. peruviana germplasm and InDel and SNP markers reported a He value of 0.30, indicating high genetic variability. This is attributed to the allogamous nature of the species and a 54% cross-pollination rate. He values for study populations were 0.11 for UDENAR, 0.08 for TF, and 0.08 for DH (Table 4).
The average Ho was 0.17, with values of zero for SSR11, SSR112, SSR123, and SSR146 markers, 0.97 for SSR138, and 0.06 for SSR15. The Ho was higher than the He for the three populations (Tables 3 and 4). Similarly, Garzón et al. (2015) reported a higher Ho than HE based on InDel (Ho=0.448, HE=0.30) and SNP markers (Ho=0.59, HE=0.41).
The fixation or inbreeding index (F) for the two polymorphic loci (Table 3) was negative, showing an average value of -0.73. This indicates the presence of heterozygote individuals, as expected for an autocompatible species with cross-pollination (Lagos et al., 2008). In this regard, Chacón et al. (2016) also found negative values of F (between -0.049 and -1.00) for a golden berry collection characterized using microsatellite markers. The average fixation index for the three populations studied here was -0.73 (Table 4).
The genetic distance (Nei, 1972) among accessions showed an average value of 0.001, ranging from 0.00 to 0.002 (Table 5). The smallest genetic distance was found between the DH line and FT group (0.00), indicating high genetic similarity between these populations and that the genotypes are closely related. The greatest genetic distance (0.002) was found between UDENAR and the other two populations (DH and FT), indicating that this population is less genetically related. These genetic distances are much lower compared to the distances reported by Chacón et al. (2016) with values of 0.13. Furthermore, Wei et al. (2012) reported a distance of 0.22 for Physalis philadelphica.
Table 5. Nei’s genetic distance (pairwise) between populations of Physalis peruviana.
| DH | GF | UDENAR | |
| DH | 0.000 | ||
| GF | 0.000 | 0.000 | |
| UDENAR | 0.002 | 0.002 | 0.00 |
Table 6 shows Wright’s F-statistics including the inbreeding coefficient (FIS), the global genetic fixation index (FIT), genetic differentiation index (FST), and estimated gene flow rate (Nm). FIS and FIT showed negative average values for the polymorphic loci (-0.524 and -0.486, respectively), which further support the presence of heterozygote individuals (Wright, 1978).
However, F-statistics were estimated only for the two polymorphic markers, suggesting inbreeding among the individuals. Consequently, this species could be considered autogamous, or with mixed pollination as suggested by Lagos et al. (2008).
Table 6. Wright’s F-statistics for 40 genotypes of Physalis peruviana L. based on six SSR markers.
| Locus | FIS | FIT | FST | Nm |
| SSR11 | - | - | - | - |
| SSR15 | -0.105 | -0.033 | 0.066 | 3.532 |
| SSR112 | - | - | - | - |
| SSR123 | - | - | - | - |
| SSR138 | -0.942 | -0.938 | 0.002 | 123.65 |
| SSR146 | - | - | - | - |
| Average | -0.524 | -0.486 | 0.034 | 21.203 |
FIS= average of the inbreeding coefficient; FIT= global genetic fixation index; FST= genetic differentiation index; Nm= estimated gene flow rate.
The average FST was 0.034 (Table 6) Contrary to these results, Morillo et al. (2018) found a high FST (0.44) for P. peruviana based on the CGA RAM marker. FST values between 0 and 0.05 indicate low genetic differentiation between populations, which is associated with spatial-temporal dynamics and the structure level of the golden berry specimens in their natural environment (Hartl and Clark, 1997). The low genetic differentiation between populations could be attributed to the exchange of germplasm among golden berry producer regions and a genetically-narrow founder effect.
The gene flow (Nm) value shows that approximately 21 individuals migrate per generation among the three populations. The lack of differentiation between the three populations can also be due to constant gene flow among them, as indicated by a value of 21.2. According to Ruiz et al. (2015), a Nm above 4.0 indicates high gene flow among populations.
The results of the AMOVA show a genetic variance of zero among populations, as well as among genotypes (Table 7). The variance within genotypes contributed 100% to the total variance. These results demonstrate the absence of population structure due to the low genetic distances found.
Table 7. AMOVA based on SSR markers for 40 accessions of P. peruviana from three populations.
| SV | Df | SS | VC | Est. Var. | % var |
|---|---|---|---|---|---|
| Among populations | 2 | 113.10 | 56.55 | 0.70 | 0% |
| Among genotypes | 37 | 1461.90 | 39.51 | 0.00 | 0% |
| Within genotypes | 40 | 17900.00 | 447.50 | 447.50 | 100% |
| Total | 79 | 19475.00 | 448.20 | 100% |
Garzón et al. (2015) found percentages of variation among populations equal to 5% and 23% for SNP and InDel markers, respectively. Conversely, the same authors found higher percentages of variation within populations (95% for SNPs and 73% for InDels). These results are similar to those obtained here since a greater variation was found compared to among populations. These findings are relevant to conservation and breeding strategies aiming to obtain more variation. Due to the low diversity and genetic differentiation, the high flow of individuals has led to similar genetic variability in each population and, accordingly, low variation among these.
This study revealed a low genetic diversity of 40 golden berry genotypes using microsatellite (SSR) markers. The markers showed an average PIC value of 0.12 for the entire collection, which classifies them as loci with low levels of polymorphism, according to Ge et al. (2013). Furthermore, the low availability of molecular markers for species of recent commercial importance, such as P. peruviana, is a bottleneck for assessing genetic variability to support improvement strategies. However, codominant markers, such as SSRs, conserved in related species like tomato, have been used in genetic studies on Physalis (Bonilla et al., 2008; Morillo et al., 2011; Wei et al., 2012). Although there are SSR markers reported for P. peruviana (Simbaqueba et al., 2011), one of the main limitations is the presence of null alleles due to mutations in primer annealing sites that can lead to genotyping errors (Kumar et al., 2009). This could be occurring with the markers used here, which were designed from non-translated regions and are less polymorphic than genomic SSR (Ellis y Burke, 2007); thereby explaining the low level of polymorphism found in this study.
CONCLUSIONS
The 40 genotypes of golden berry Physalis peruviana L. showed low genetic diversity with high gene flow and no population structure. The genetic variation indices such as observed heterozygosity, expected heterozygosity, polymorphic information content, and Shannon index also showed low values.
Markers SSR15 and SSR138 proved polymorphic and, consequently, provided discriminant information. These markers displayed high allelic richness and polymorphic information content. However, they were not informative enough to reveal genetic variability in the genotypes studied. To address this, sequencing techniques can allow detecting single nucleotide changes and identifying variation at the molecular level. Finally, this will enable a more accurate estimate of the magnitude of genetic variability, contributing to decision-making in breeding programs.

