


 English (pdf)
 Article in xml format
 Article references
 Send this article by e-mail
 Cited by SciELO
  Cited by Google
  Similars in
SciELO
Similars in
SciELO  Similars in Google
 Permalink
INTRODUCTION
Dairy farming in Nariño is one of the important economic activities, on which approximately 40,000 families depend, and which, according to DANE (2017), represents 14.1% of the regional agricultural GDP. Currently, according to the Society of Farmers and Ranchers of Nariño (SAGAN, 2022), in the department there are 133,526 cows, of which 80% are Holstein breed, and since 2012 to date, reproductive problems have been evidenced related to the wide calving intervals, which vary between 444.5 ± 96.2 days, and open days of 166.3 ± 94.5 (Solarte & Zambrano, 2012). The diet is based on monoculture meadows of kikuyu (Cenchrus clandestinus Hoschst ex Chiov), ryegrass (Lolium spp), white clover (Trifolium repens), false pomace (Holcus lanatus) and New Zealand-type improved pastures such as: Lolium hibridum (sterling-ohau) and Lolium perenne (nui-samson) or in mixtures of these, plus food supplementation consisting of commercial concentrates or silages (Apráez et al., 2016).
The high nutritional requirements of the breed, associated with the productive challenges with lactations of more than 5400 liters, and the non-compensation of nutritional requirements during the beginning of lactation due to the decrease in dry matter intake, induce the mobilization of body reserves, to satisfy the energy demands derived from the mammary gland, with a high risk of not being able to compensate energy homeostasis, which leads the animal to a negative energy balance (NEB), and as a consequence, the pulsatile secretion of luteinizing hormone is affected (LH), reducing ovarian responsiveness to LH, resulting in low pregnancy rates (Mann et al., 2015; Wang et al., 2017; Yeshambel, 2023).
On the other hand, protein mobilization is much more limited than fat, and once its reserves are depleted, milk production and immunoglobulin synthesis are compromised. Another important indicator of the nutritional situation is the evaluation of the body condition, which, during the early postpartum period and the lactation peak, allows indirectly assess the reproductive efficiency, since if an-animal loses more than one unit between the parturition and the 100 days in milk, it is likely to present lower reproductive performance, especially in grazing animals (Drackley & Cardoso, 2014; Akbar et al., 2015). For this reason, the objective of this study was to analyze milk production, taking into account energy and protein metabolites such as Non-Esterified Fatty Acids (NEFA), Beta-hydroxybutyrate (BHB), triglycerides, cholesterol, glucose, total protein (PT ), Blood Ureic Nitrogen (BUN); and their relationship between dry matter intake (CMS/Kg/d), Body Condition (BC), and their incidence on the reproductive variables of calving interval (CI) and services per conception (SC) in three periods of lactation, in grazing Holstein cows, under conditions of the Alto de Nariño tropics
MATERIAL AND METHODS
Location. This investigation was carried out in four dairy herds, which were identified as F1, F2, F3, and F4, located in the municipalities of Guachucal, Túquerres and Pasto, considered the ones with the largest bovine inventory in the region, where 80% of the department's total milk volume is concentrated, in accordance with the provisions of the Nariño Farmers and Ranchers Society (SAGAN, 2022). These farms were selected, according to the livestock inventory, to cover the experimental requirement of animals in a similar gestation phase. From the records, adult cows with three or more calvings were chosen; these were grouped according to the days remaining until calving (between 4-8 days); additionally, it was considered that they had productive, reproductive and health information. The geographic coordinates and main climatic conditions of the farms are described below (Table 1).
Table 1 Geographic coordinates and climatic conditions of the four selected herds under conditions of the high tropics of Nariño.
| Municipality | Farms | Geographical coordinates | Temperature °C | Hight Masl | Precipitation mm/year |
|---|---|---|---|---|---|
| Pasto (F1,F2) | 2 | 1°12´41´´N 77°16´52´´O | 11.5 | 3013 | 771.6 |
| Guachucal (F3) | 1 | 0° 57’ 50"N 77° 43’ 50"O | 10.8 | 3158 | 959 |
| Túquerres (F4) | 1 | 1°250`77``N 77°45`04``O | 11.0 | 3150 | 1117 |
Selection of animals and type of feeding. Six Holstein cows were selected from each farm, and the measurements were made during lactation (4-10 days) called the beginning and identified as P1, at the peak of lactation or P2 (between 45-55 days) and third lactation or P3 (185-200 days). Table 2 indicates the basis of forage feeding in each herd (F1, F2, F3 and F4) by lactation period.
Table 2 Type of forage supply supplied in the four dairy herds, by lactation period in conditions of the high tropics of Nariño.
| Dairy herds | Type of mixed pastures by lactation periods | ||
|---|---|---|---|
| P1 | P2 | P3 | |
| F1 | Lolium hibridum y Lolium perenne | Lolium spp Trifolium repens Holcus lanatus | Lolium hibridum Cenchrus clandestinus Hoschst ex Chiov |
| F2 | Cenchrus clandestinus Hoschst ex Chiov Holcus lanatus Trifolium repens | Cenchrusclandestinus Hoschst ex Chiov Trifolium repens Lolium spp Holcus lanatus | Trifolium repens Cenchrus clandestinus Hoschst ex Chiov |
| F3 | Trifolium repens Holcus lanatus Lolium spp | Lolium spp Holcus lanatus Trifolium repens | Holcus lanatus Lolium spp |
| F4 | Lolium spp | Lolium spp Holcus lanatus | Holcus lanatus Lolium spp Cenchrus clandestinus Hoschst ex Chiov |
Management conditions were similar in all systems, with mechanical milking, supplemented rotational grazing, and ‘ad libitum’ access to water. The addition of the amount of commercial concentrate was carried out according to the productive level. Additionally, and during the morning milking, 5% mineralized salt was supplied in an approximate amount of 150g/animal per day.
Regarding the supply of commercial concentrate, on all the farms evaluated, the cows in production were given one kilogram of concentrate for every five kilograms of milk during the morning and afternoon milking, that is, a 5:1 ratio, without exceeding the supply of 8 kg of supplement per animal per day. Table 3 shows the chemical-nutritional composition of the commercial supplement by production system. In all the lactation periods evaluated, the same concentration was provided. The bromatological analyzes, both of the pastures and the commercial type supplements, were carried out according to the procedures described in the food chemical analysis manual of the Specialized Laboratory of the University of Nariño, following the methodology of the Association of Official Agricultural Chemists (AOAC, 1995).
Table 3 Chemical - nutritional composition of the commercial supplement supplied in each dairy herd, under conditions of the high tropics of Nariño.
| 1 Component (%) | Nutritional component | |||
|---|---|---|---|---|
| F1 | F2 | F3 | F4 | |
| CP | 20.4 | 19.3 | 16.8 | 12.2 |
| EE | 4.6 | 6.2 | 5.8 | 3.3 |
| NDF | 23.3 | 33.7 | 40.3 | 31.3 |
| AFD | 7.8 | 11.8 | 17.4 | 10.2 |
¹CP = Crude Protein; EE = Ethereal Extract; NDF = Neutral Detergent Fiber; AFD = Acid Detergent Fiber.
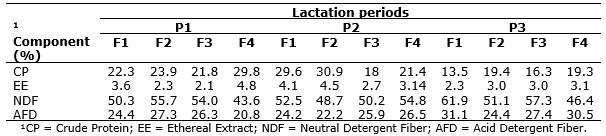
Table 4 shows the main nutritional components of the forage mixture, for each dairy herd and lactation period.
Table 4 Nutritional composition of the forage mixture, by dairy herd and lactation period under conditions of the high tropics of Nariño.
The quantification of the total milk production was carried out taking into account the volume of milk obtained in the morning (am) and afternoon (pm) milkings. The protein content was determined using a Julie C2® milk analyzer (Scope Electric Ltd; Razgrad, Bulgaria), and the estimation of the Dry Matter Intake (CMS/Kg/d) under grazing conditions, was carried out by supplying 15g of Chromium Oxide (Cr2O3) as an external marker, taking into account the methodology described by Correa et al. (2009). In addition, on each farm, by lactation period, the body weight (Kg) of the animals was recorded using a bovine metric tape for dairy breeds, and an adjustment of 2% was made to estimate the final value.
For the determination of metabolic indicators, after milking in the morning and in each lactation period (P1, P2, and P3), blood samples were taken from each cow by coccygeal venipuncture, using vacutainer tubes without anticoagulant. The samples were centrifuged at 2500rpm for 15 minutes. This procedure was done with the purpose of obtaining blood serum, which was stored at -20°C, in the Laboratory of the University of Nariño. Afterward, they were transferred under refrigeration to the Reproduction Laboratory of the National University of Colombia - Palmira Campus, to carry out the metabolic analyses.
Five indicators of energy metabolism (NEFA, BHB, cholesterol, glucose, and triglycerides) and two of protein metabolism (PT, BUN) were determined in the serum samples. Specific commercial reagents from Randox® (Crumlin, United Kingdom) were used for each test, using the RAYTO® brand optical reading semi-automatic chemistry analyzer (Shenzhen, China) and using bovine control 2 as intra-assay control of the same type. Comercial House. The body weight (Kg) and Body Condition (BC) scores of the animals (Ural, 2016) and the average milk production were evaluated on the day of each sampling. The characterization of the reproductive parameters, such as Calving Interval (CI) and Services per Conception (SC), were obtained from the records of each farm.
Statistical analysis of the information. The metabolic indicator data was analyzed by multiple regression using random coefficients for each lactation period (P1, P2, P3) and by farm, from the option of General and Mixed Linear Models. The quantitative regressor traits were dry matter intake (CMS/Kg/d), body weight (Kg), calving interval (CI/days), NEFA, glucose, cholesterol, triglycerides, BHB, total protein, and BUN, and as categorical traits body condition (BC) and services per conception (SC). Subsequently, using the same model, the backward variable elimination method was applied, establishing a variable retention p-value of 5% (Carrasco, 2016).
The transformation of categorical to quantitative variables was done through the dummy process. For body condition, there were 2.5 and 3.0 points. In this case, the BC 2.5 points was taken as the base reference, and when the value was 2.5, a zero (0) was placed; when it was 3.0, the value would be one (1), and thus the variable “CC3” was created. For the SC variable, the value of a service was used as a base. This is because this variable contained four possible values. Therefore, it was necessary to create four dummy variables, named SC1, SC2, SC3, and SC4. The replicates considered in the model were the animals selected by the farm, as described at the beginning of the methodology.
RESULTS AND DISCUSION
Table 5 shows the results obtained from the estimation of Dry Matter Consumption (CMS), and total milk volume, by farm and lactation period. The CMS values (Kg/d) show that the highest consumption occurred on second farm (F2), and the lowest consumption was on first farm (F1), these differences can be explained by the type of management carried out on each farm, related to the type of pastures offered to the animals, where in F1 there was a greater presence of improved pastures, such as: Lolium hibridum, Lolium perenne, Lolium spp, Lolium hybridum; farm F2 the majority of dominance in the pastures was made up of Cenchrus clandestinus Hoschst ex Chiov, Holcus lanatus, Trifolium repens.
Table 5 Consumption of dry matter and quantification of the total volume of milk, percentage of protein and milk fat by dairy farm and lactation period in conditions of the high tropics of Nariño.
| Productive System | Variables | |||
|---|---|---|---|---|
| Milk (kg/d) | Milk protein (%) | DMI1(kg/d) | ||
| F1 | 18.8 | 3.23 | 11.80 | |
| F2 | 24.8 | 3.12 | 17.20 | |
| F3 | 26.1 | 3.19 | 16.60 | |
| F4 | 25.2 | 3.19 | 14.50 | |
| Lactation Period | ||||
| P1 | 26.34 | 3.19 | 16.10 | |
| P2 | 26.86 | 3.17 | 15.50 | |
| P3 | 19.18 | 3.18 | 14.90 | |
1DMI Dry Matter Intake.
When the values are analyzed by lactation period, no differences are observed, which indicates that the animals behave in a similar way, during the lactation periods evaluated, effect that is related to the type of Holstein animal which has a similarity in the level of production (Kg/d/milk) per lactation period, and therefore the consumption of dry matter, associated with the requirements of energy and metabolizable protein are the same.
Table 6 shows the mean and standard deviation of the reproductive indicators CI, DA and SC for each production system. The reproductive efficiency of the herds evaluated does not bear similarity in similar contexts of cattle farms in the high altitude tropics of Colombia, being, in the case analyzed, manifestly lower. The mean of the CI and DA does not coincide with the results reported by Zambrano et al. (2019) and Zambrano et al. (2014) for conditions in Antioquia. The open days obtained in all the herds were above the range considered optimal for Holstein cows, which causes a significant increase in economic losses and an increase in the discard rate since this is an important indicator of the reproductive efficiency of the herd.
Table 6 Mean and standard deviation of the reproductive indicators per dairy herd in conditions of the high tropics of Nariño.
| Productive system | Traits | ||
|---|---|---|---|
| CI | DA | SC | |
| F1 | 428±59 | 143±59 | 1.75±0.45 |
| F2 | 461±70 | 175±70 | 1.17±0.38 |
| F3 | 492±97 | 207±97 | 2.83±1.38 |
| F4 | 425±49 | 139±49 | 1.60±0.50 |
These results coincide with those indicated by Solarte & Zambrano (2012) for the Holstein breed in Nariño. On the other hand, Zambrano et al. (2014) found DA values below those obtained in this research for Holstein cows in Antioquia. In relation to services per conception, the results of farms F1, F2 and F4 are similar to those reported by Zambrano et al. (2014). However, for F3, it coincides with the values found by Solarte & Zambrano (2012). These results may be mainly related to the nutritional quality of the forage supply in the evaluated herds, especially the energy and protein contributions during the beginning and peak of lactation. To know the relationship between metabolism and productive and reproductive behavior, multivariate analysis was used through General and Mixed Linear Models, whose results are presented in Table 7. The equations obtained after the multiple regression analysis with random coefficients for milk production, which includes the selected variables, according to the fixed effects, for each lactation period (P1, P2, and P3) were
Equation 1, corresponding to period 1, beginning of lactation (4-10 days).

Equation 2, corresponding to period 2, lactation peak (45-55 days).

Table 7 Variables associated with metabolic indicators, body condition, dry matter intake and reproductive efficiency indicators that affect milk production, by lactation period, under conditions of the high tropics of Nariño.
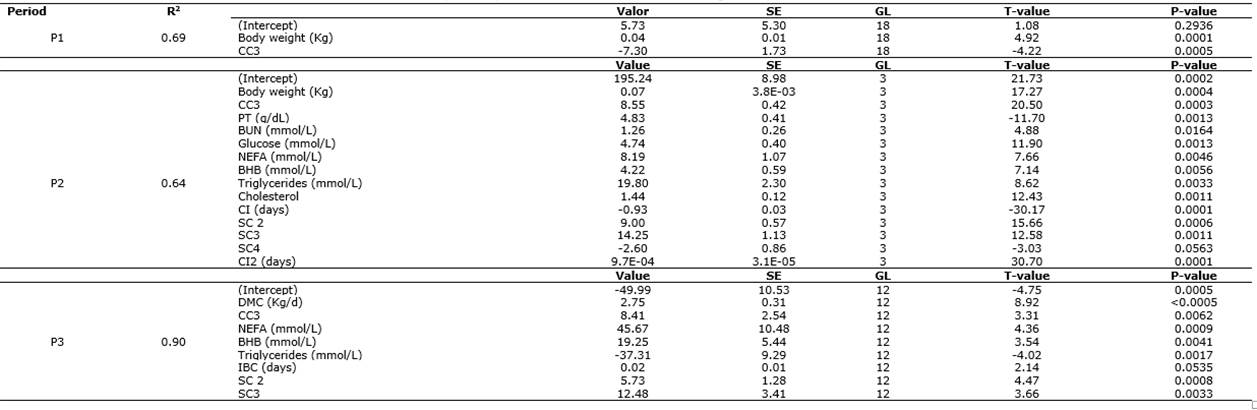
Equation 3, corresponding to period 3, lactation peak (185-200 days).

For the variables of equation 1 (P1), it is observed that the regression coefficient for body weight (Kg) indicates that the milk volume increased by 0.04 liters of milk per unit of change in this variable. In the case of body condition, the negative value -7.30 shows that, for each unit of condition lost, milk production will decrease during the onset of lactation. These results are the normal physiological response of the animal during the postpartum period, mainly due to the decrease in dry matter intake (DMS) and the high milk production during this period, where the DMC influences the productive response of the lactating cow (Giraldo et al., 2013; De Mol et al., 2016).
Regarding the variables that make up prediction equation 2 (P2), it can be concluded that the metabolic indicators PT, BUN, glucose, NEFA, BHB, triglycerides, and cholesterol positively affect milk production, with values of 4.83, 1.26, 4.74, 8.19, 4.22, 19.80, and 1.44, respectively. In this case, the NEFA metabolite and triglycerides play an important role in milk production since as long as the values are within the normal ranges (<0.60 mmol/L) and 0.77mmol/L, they favor the productive response of animals in high tropical conditions (Seifi et al., 2007; Kaneko et al., 2008). In addition, NEFA are considered as markers of energy metabolism, allowing the evaluation of the negative energy balance (NEB) during the transition period (McCarthy et al., 2015). On the other hand, non-energy compensation would lead the animal to NEB, and, as a consequence, the animal presents drastic hormonal changes, which reduce reproductive response capacity, would cause a greater number of services per conception, increase the interval between births, and therefore low efficiency in the dairy herd (Mann et al., 2015; Wang et al., 2017; Campos et al., 2018).
The NEB determined, from the NEFA metabolite, made it possible to show that the animals, during P2, corresponding to the peak of lactation, present a medium NEB as a mechanism for mobilizing body reserves so that it compensates the NEB caused during the postpartum period and the beginning of lactation (Figure 1).
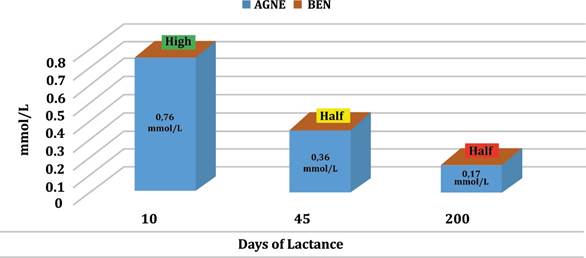
Figure 1 Negative energy balance of Holstein cows grazing, under conditions of the high tropics of Nariño.
In no case did the animals show clinical signs associated with ketosis, such as loss of appetite, evident loss of body weight, low milk production, and in some cases, nervous signs such as continuous licking (Garzón & Oliver, 2018), as a sequel to the elevated levels of NEFA during the beginning of lactation, called P1 (10 days of lactation). Subsequently, the values decreased in the lactation peak, determined as period two (P2) of this investigation. Between 185 and 200 days of lactation (P3), the concentrations of this metabolite (NEFA) are lower, as a normal mechanism during the end of the second third of milk production, which allows for reducing the impact on fat mobilization, since as lactation progresses, milk production decreases, and DMS increases.
Among the risk factors associated with a greater mobilization of NEFA are the number of lactation, where animals between two and three births present a higher risk; the presence or absence of ketone bodies, especially BHB; the body condition at calving; and the dry season of calving, since the availability of food is drastically reduced during dry seasons, which has a direct effect on the dry matter intake, as well as the greater number of lactations related to dairy production (Vanholder et al., 2015; Garzón & Oliver, 2018).
In the case of estimating milk production for period three (P3), the variables involved, especially DMS, show that as lactation progresses for more than 180 days, the animals substantially improve body condition, as well as same energy metabolic indicators (NEFA, BHB), which gives as a response better reproductive efficiency observed in the intervals between births and services per conception. This efficacy in the NEB is consistent with the reports presented by García et al. (2011), López et al. (2017), and David et al. (2018). In addition, it is important to highlight that the dietary scheme of dairy cows described in Table 1 favored that they do not present major changes in metabolic indicators during the periods evaluated.
CONCLUSIONS
The metabolic variables selected in equation two; and those described in equation three, are the main reflection of the negative energy balance (NEB), which directly influences milk production, and that could also negatively affect the reproductive efficiency of grazing Holstein cows under conditions of the high tropics of Nariño. Dry matter intake under grazing conditions became the main variable that influences milk production during lactation of Holstein cows under high-altitude tropical conditions, and that this parameter is a key tool to assess the productivity of cows dairy farms in the Nariño region.

