


 English (pdf)
 Article in xml format
 Article references
 Send this article by e-mail
 Cited by SciELO
  Cited by Google
  Similars in
SciELO
Similars in
SciELO  Similars in Google
 Permalink
INTRODUCTION
Global production of fresh fruits, especially deciduous ones, is led by China and Europe, while in South America, Chile and Peru are at the forefront of production. Even so, even though low volumes are produced in Colombia, in recent years, an increase in domestic demand for fruits from deciduous trees, especially peaches, has been observed. Likewise, in 2022, Colombian fruit exports have increased both in price and volume by 4.7 and 5.4%, respectively, compared to 2021 (Analdex- Asociación Nacional de Comercio Exterior, 2023).
Similarly, in 2016 and 2017, peach production in Colombia was concentrated in the departments of Boyacá, Norte de Santander, Huila, and Santander (Agronet, 2020), with a yield of 16.43 t ha-1 and a planted area of 838ha in Boyacá, which contributed 51.04% of domestic production (MADR - Ministerio de Agricultura y Desarrollo Rural, 2019). Cultivars such as 'dorado', 'diamante', 'rey negro' and 'rubidoux' stand out, which have shown great adaptation to high tropical conditions (13 to 19°C, altitudes between 1800 and 2800m above sea level, and solar brightness of 1400 hours/year), with great production potential because of the low cold hours requirement (Pinzón et al., 2014).
In addition, Boyacá has a bimodal rainfall regime, which oscillates between 700 and 1400 mm per year and guarantees a dry period that is used for harvesting and a rainy period for orchard development (Pinzón et al., 2014). However, there are major drawbacks in the development of the productive system, resulting in competitiveness problems. Likewise, the low firmness of the fruits means postharvest handling is greatly limited, with the short duration of the 'Dorado' variety during storage, which results in a low-quality product.
Fertilization plays a key role in the postharvest quality of fruits (Bai et al., 2021). One of the aspects of nutrition that has been studied in recent years is the role of Silicon (Si) as a beneficial element in the physiology of plants and in preserving product quality for a longer time during fruit storage (Karagiannis et al., 2021). Once Si is applied to the soil, it is absorbed by plants through specific Si transporters and is mobilized to the aerial parts through the xylem flow, where it is deposited mainly in the leaves as silicon dioxide (Deshmukh et al., 2020).
It should be noted that Si plays an important role in plant water retention and has a positive effect on plant tolerance to saline stress, root hydraulic conductivity, and water uptake in tomato plants (Shi et al., 2016). On the other hand, it has been shown that the application of Si increased firmness, color parameters, the content of phenols, anthocyanins, and other metabolites in apple fruits, and the concentration of other nutrients such as P, Mg, and Mn in the shoots and leaves (Karagiannis et al., 2021). Marodin et al. (2016) reported that silicon intervenes in plant architecture by providing more upright leaves that favor the interception of solar radiation and improve photosynthetic efficiency, increasing plant productivity that is attributed to the availability of silicon in the soil.
Despite the fact that Silicon is not an essential element, applications of Si affect crops such as rice, sugar cane, tomato, and apple, among others (Shi et al., 2016). The objective of the present study was to evaluate the application of different doses of Silicon on the postharvest quality of 'Dorado' peach fruits in the municipality of Corrales Boyacá.
MATERIAL AND METHODS
Location. This research was carried out in the Plant Physiology Laboratory of the Universidad Pedagógica y Tecnológica de Colombia, Tunja campus. The 'Dorado' variety peach fruits were harvested from the La Miel farm in the municipality of Corrales Boyacá in Modeca village, coordinates 5°48'28” and 72°51'17”, at an altitude of 2390m above sea level, with an average annual rainfall of 726mm and an average temperature of 14°C. The fruits were harvested at maturity stage 3, free of phytosanitary problems, without any type of injury, and of average size.
Experiment design. A completely randomized block design with five treatments and two blocks was used. The blocking criterion was the lower (E1) and upper (E2) stratum, and the treatments were the application of edaphic silicon doses (0, 300, 600, 900, or 1200 kg ha-1). Each treatment had three repetitions, for a total of 15 experiment units (EU) per block and 30 EU in total. The EU was composed of two trees. Twenty-one fruits were taken from each EU for the measurements, which gave a total of 630 fruits.
Crop management, in terms of irrigation application, phytosanitary management, and fertilization plan, was carried out according to the criteria and experience of the producer. Upon reaching more than 70% crop flowering, the soil application of silicon was applied according to the treatments using magnesium silicate as a source. Fertilization was carried out with a crown on the plating area of each tree.
Once the fruits reached harvest maturity, they were collected at six in the morning and transported to the plant physiology laboratory of the Pedagogical and Technological University of Colombia (Boyacá, Colombia) to carry out the respective analysis. The fruits were packed in expanded polystyrene trays for protection from impact injuries and temperature changes and stored at room temperature (14°C).
Response variables. Every two days and until the fruits lost eating quality, the following variables were evaluated in three fruits per EU: total soluble solids (TSS) using a Hanna HI 96803 refractometer with a scale of 0% to 85% (Hanna Instruments, Spain); total titratable acidity (TTA) expressed in malic acid and determined following the methodology used by Álvarez-Herrera et al. (2021); maturity index (MI) calculated using the TSS/TTA ratio; and pH calculated from the extraction of 5 ml of peach fruit juice, brought to 50 ml with distilled water, and measured with a Hanna HI 8424 digital potentiometer (Hanna Instruments, Spain).
Fruit firmness was measured in the equatorial region of each fruit with an Ametek LS1 texturometer (Ametek, Inc., UK) with a precision of 0.01 N. The accumulated mass loss (ML) was measured during the postharvest phase by taking the initial weight (IW) and final weight (FW) of the fruits in each moment of measure and calculating the percentage of mass decrease using a 0.001 g VîBR( AJ220E (Shinko Denshi Co., Ltd, Japan) precision electronic balance with the equation 1.
The color of the epidermis was measured with a Minolta CR 300 colorimeter (Minolta Co., Osaka, Japan) in the equatorial zone of the fruits, for which three readings were taken at the same point throughout postharvest storage. The L* values, which refer to luminosity, where zero is white, and 100 is black, a*, which indicates the chromaticity from green to red, and b*, which indicates the chromaticity from blue to yellow, were determined. Subsequently, the color index (CI) was calculated with equation 2.
The total carotenoid content (TCC) was measured from 0.5mg of peach pulp, to which 2.5 ml of acetone were added. This mixture was vortexed for one minute and placed in a Unico universal centrifuge (C858 Model PowerSpin LX (Unico Scientific, Hong Kong)) for ten minutes at 4000 rpm. Subsequently, the supernatant was extracted, acetone was added, and the previous procedure was repeated three times. Finally, the supernatant was brought to 25 ml with acetone to determine the concentration of total carotenoids at an absorbance of 450 nm in this solution using a HumanCorp UV/Visible X-ma 1200V spectrophotometer (Human Corporation, Seoul, Korea) and equation 3.
Where A 450 : corresponds to the absorbance of the solution at 450nm, V: is absorbance speed, b and m: are intercept and slope of the linear regression of the concentration in µg g-1, and P: is the weight of the sample.
The respiratory rate (RR) was determined with the Labquest2 interface (Vernier Software & Technology, OR, USA), which was connected with an infrared sensor VER CO2-BTA (Vernier Software & Technology, OR, USA) to a 2L SEE BC-2000 hermetic chamber (Vernier Software & Technology, OR, USA) in which the fruits were deposited for 5 minutes for each measurement. The RR was expressed as mg kg-1 h-1 of CO2 and was calculated using equation 4, where Cv: is chamber volume (2L), M: is fruit mass (kg), and m: is the slope of the linear regression in Labquest2.
The silicon foliar content was determined by collecting 20 leaves from each experimental unit (EU). The samples were dehydrated to a constant weight, and then, following the methodology outlined by Seyfferth et al. (2016), the amount of silicon was quantified as a percentage using atomic absorption spectroscopy.
Statistical analysis. The data were subjected to normality tests to eliminate outliers. Subsequently, an analysis of variance (ANOVA) and a Tukey test (P<0.05) were performed to establish significant differences and classify the treatments, respectively. The analyses were done with SAS v. 9.1e (SAS Institute Inc., Cary, NC).
RESULTS AND DISCUSSION
Firmness. The fruits harvested from the plants that received applications of 900 and 1200 kg ha-1 of Si showed significant differences from the treatment with 300 kg ha-1 and the control, which suggests the positive effect of Si on fruit firmness (Figure 1A) since the fruits presented values higher than 35 N and a lower level of postharvest damage. These values were higher than the 12.8 N reported by Africano et al. (2016) for 'Dorado' peach fruits at physiological maturity.
The above agrees with Abd-Alkarim et al. (2017), who stated that Si can significantly increase fruit firmness via edaphic and foliar treatments, which results from the accumulation of Si in the cell walls and intercellular spaces, which causes greater rigidity of the wall and a consequent increase in fruit firmness.
When analyzing the effect of storage time on peach fruits, a decrease in firmness was observed, from 43.9 N to 24.7 N on average for all treatments. Notably, the treatments with more than 900 kg ha-1 of Si had greater firmness, and the fruits from E2 presented less firmness than those harvested from E1. This can be occurring due to the greater exposure to solar radiation of the E2 fruits, which can increase the maturity process and the softening of the epidermis. Karagiannis et al. (2021) stated that the increases in firmness would be related to the increases in dry matter in fruits caused by the application of Si. Likewise, the loss of firmness is generated by the degradation of cell walls caused by enzymes such as polygalacturonase (PG), Pectin methylesterase (PME), α arabinosidase, and β galactosidase (Sañudo-Barajas et al., 2019). This loss of firmness can be perceived through touch, is related to consumer preferences, and is an indicator of maturity that affects the shelf-life of the fruits.
Mass loss (ML). The ML of the peach fruits did not present significant differences between the different doses of Si nor between the strata of the plants and was adjusted to a polynomial behavior of order two (Figure 1B), as reported by Karagiannis et al. (2021), who stated that Si does not significantly affect ML in fruits. ML is a consequence of the respiration and transpiration processes that the fruits normally undergo, where, because of the vapor pressure deficit between the fruit and the environment, water escapes from the fruit (Díaz-Pérez, 2019). Likewise, it can be inferred that peach fruits should be consumed in the first five days after harvest (DAH) because, at this point, there is an increase in accumulated ML, which begins the senescence process (Africano et al., 2016) and consequent loss of quality.
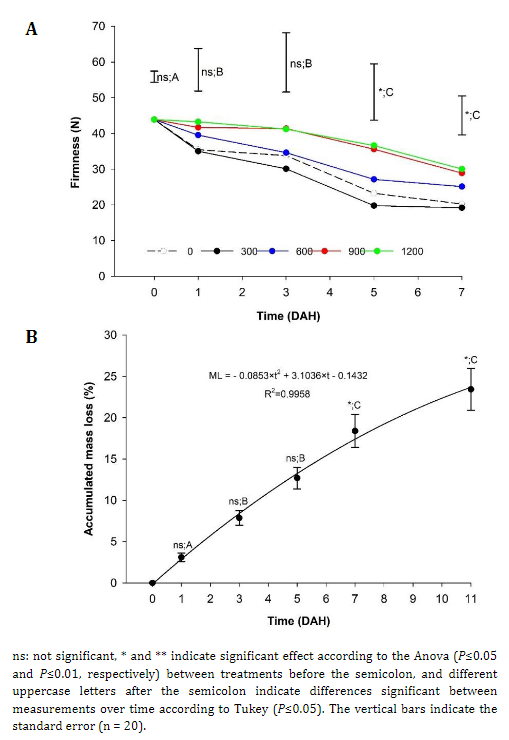
Figure 1 Effect of different doses of edaphic silicon (kg ha-1) applied on 'Dorado' peach plants on A) Firmness and B) Accumulated loss mass in fruits.
Total soluble solids (TSS). The TSS in the peach fruits showed significant differences between the treatments, where the doses of 600 and 1200 kg ha-1 of Si showed higher TSS values. The treatment with the highest contribution of Si obtained 68% more TSS than the treatment with 300 kg ha-1 (Table 1). This behavior coincides with the report by Abidi et al. (2023), who, after evaluating the behavior of Si in peach and nectarine fruits, found an increase in TSS concerning the control. In addition, an increase in TSS was reported in tomatoes with an application of 600 kg ha-1 of Si, which was attributed to the fact that Si increases photosynthesis and production of sugars in the leaves of plants that are later transferred to the fruits, according to Marodin et al. (2016). The average TSS in the peach fruits reached a value of 10.75 °Brix at the eleventh DAH, which was lower than the value of 15.4 reported at the seventh DAH by Africano et al. (2016) for peach cv. 'Dorado'.
E2 presented a higher concentration of TSS than the fruits collected in E1. This difference in the TSS may have been due to the greater exposure to solar rays in the E1 fruits than in the E2 fruits (Rodríguez-Félix et al., 2011), which, together with the advance in the ripening process, can increase the amount of TSS. This is similar to the reports for strawberry (Alvarado-Chávez et al., 2020) and pepper (Díaz-Pérez, 2014), which indicated that when the solar incidence on the fruits decreases, they have less TSS. It should be noted that fruits with high TSS values are more desired by the processing industry when producing juices (Sattar et al., 2019).
Total Titratable Acidity (TTA). The TTA did not show significant differences between treatments, except for the measurement carried out at the ninth DAH, where the application of 300 kg ha-1 of Si generated lower TTA values (0.78%), while the application of 900 kg ha-1 of Si had 1.19%. Significant differences were found between the fruits from the different strata at the ninth DAH; however, when evaluating the behavior of the Si treatments in each of the strata, no significant differences were obtained (Table 1), which agrees with Weerahewa & Wicramasekara (2020), who found no differences in the TTA values of pineapple fruits subjected to different edaphic applications of Si.
When analyzing the behavior over time, the TTA decreased up to the sixth DAH because fruits, upon reaching ripeness, experience a decrease in TTA through the degradation of organic acids into sugars, which is a product of the decarboxylation of oxaloacetate and malate, generating phosphoenol pyruvate, which is linked to the activation of the gluconeogenesis pathway, producing glucose (Vallarino & Osorio, 2019).
pH. The pH of the peach fruits did not register significant differences between treatments or between strata (Table 1), as reported for passion fruit by Peña & Galecio (2019), who evaluated edaphic Si doses that ranged from zero to 100 kg ha-1, without finding significant differences in the pH of the fruits. However, the pH values had a slight tendency to increase with the highest doses of edaphic silicon, which is similar to that recorded in tomato by Korkmaz et al. (2017). On the other hand, when analyzing the behavior during postharvest, the pH had a slight increase of 3.97% on average during storage, which is associated with faster maturation and a shorter postharvest life (Vargas-Torres et al., 2017).
Table 1 Physicochemical parameters evaluated in 'Dorado' peach fruits under the application of different doses of edaphic Silicon.
| Parameter | DAH | Edaphic Silicon (kg ha-1) | ||||
|---|---|---|---|---|---|---|
| 0 | 300 | 600 | 900 | 1200 | ||
| TSS (°Brix) | 1 | 9.31 ± 2.89a;A | 10.03 ± 0.55a;AB | 10.88 ± 1.19a;A | 8.81 ± 1.72a;A | 10.46 ± 1.71a;AB |
| 3 | 8.26 ± 1.53a;A | 8.23 ± 0.73a;BC | 8.28 ± 1.10a;A | 8.96 ± 1.69a;A | 8.06 ± 2.22a;B | |
| 5 | 8.85 ± 1.36a;A | 8.75 ± 1.64a;BC | 10.05 ± 2.26a;A | 9.50 ± 1.80a;A | 8.98 ± 1.46a;AB | |
| 7 | 10.38 ± 1.53ab;A | 7.51 ± 1.37c;C | 11.23 ± 2.02a;A | 8.36 ± 0.73bc;A | 11.45 ± 2.09a;A | |
| 9 | 11.01 ± 1.45a;A | 8.70 ± 2.30a;BC | 11.06 ± 1.98a;A | 8.33 ± 0.60a;A | 8.55 ± 1.25a;AB | |
| 11 | 10.33 ± 1.74a;A | 11.35 ± 1.27a;A | 10.41 ± 2.25a;A | 10.38 ± 2.07a;A | 11.26 ± 1.54a;A | |
| TTA (%) | 1 | 1.00 ± 0.09a;A | 0.84 ± 0.19a;AB | 0.94 ± 0.16a;AB | 0.94 ± 0.08a;A | 0.92 ± 0.12a;A |
| 3 | 0.69 ± 0.15a;B | 0.77 ± 0.10a;AB | 0.89 ± 0.16a;AB | 0.85 ± 0.10a;A | 0.89 ± 0.19a;A | |
| 5 | 0.77 ± 0.14a;AB | 0.69 ± 0.13a;B | 0.80 ± 0.22a;B | 0.89 ± 0.09a;A | 0.88 ± 0.22a;A | |
| 7 | 0.87 ± 0.17a;AB | 0.64 ± 0.13a;B | 0.87 ± 0.07a;AB | 0.78 ± 0.28a;A | 0.92 ± 0.16a;A | |
| 9 | 0.83 ± 0.15ab;AB | 0.79 ± 0.09b;AB | 1.09 ± 0.18a;A | 0.87 ± 0.19ab;A | 0.95 ± 0.22ab;A | |
| 11 | 1.02 ± 0.28a;A | 0.96 ± 0.12a;A | 1.12 ± 0.17a;A | 0.86 ± 0.19a;A | 0.97 ± 0.13a;A | |
| pH | 1 | 3.13 ± 0.03a;B | 3.23 ± 0.08a;A | 3.15 ± 0.02a;A | 3.17 ± 0.03a;AB | 3.23 ± 0.13a;A |
| 3 | 3.33 ± 0.10a;A | 3.25 ± 0.07ab;A | 3.20± 0.10ab;A | 3.19 ± 0.05Aab;AB | 3.16 ± 0.10b;A | |
| 5 | 3.22 ± 0.09a;AB | 3.30 ± 0.15a;A | 3.23 ± 0.18a;A | 3.16 ± 0.08a;B | 3.21 ± 0.17a;A | |
| 7 | 3.23 ± 0.10a;AB | 3.26 ± 0.06a;A | 3.25 ± 0.11a;A | 3.33 ± 0.19a;AB | 3.22 ± 0.06a;A | |
| 9 | 3.19± 0.09a;AB | 3.33± 0.12a;A | 3.21 ± 0.08a;A | 3.28± 0.11a;AB | 3.26 ± 0.04a;A | |
| 11 | 3.27± 0.11a;AB | 3.29 ± 0.11a;A | 3.32 ± 0.09a;A | 3.35 ± 0.09a;A | 3.34 ± 0.06a;A | |
| MI | 1 | 9.30 ± 3.01a;B | 12.58 ± 3.43a;A | 11.91 ± 3.08a;A | 9.72 ± 2.05a;A | 11.63± 3.16a;A |
| 3 | 10.99 ± 1.51a;AB | 10.81 ±1.30a;A | 9.60 ± 2.15a;A | 10.61 ± 1.68a;A | 9.42 ± 3.04a;A | |
| 5 | 11.63 ± 1.67a;AB | 12.80 ± 2.18a;A | 13.18 ± 3.65a;A | 10.65 ± 1.91a;A | 10.83 ± 3.93a;A | |
| 7 | 12.11 ± 1.91a;AB | 11.90 ± 2.70a;A | 12.98 ± 2.77a;A | 11.51 ± 3.04a;A | 12.49 ± 1.03a;A | |
| 9 | 13.36 ± 2.09a;A | 11.13 ± 3.14a;A | 10.28 ± 1.74a;A | 10.01 ± 2.41a;A | 9.32 ± 2.38a;A | |
| 11 | 10.39 ± 1.71a;AB | 11.93 ± 1.64a;A | 9.26 ± 1.45a;A | 12.17 ± 1.85a;A | 11.74 ± 2.16a;A | |
DAH: days after harvest; TSS: total soluble solids; TTA: total titratable acidity; pH: potential of hydrogen; MI: maturity index. Lowercase letters in the same row before the semicolon indicate statistically significant differences between treatments. Uppercase letters in the same column after the semicolon indicate statistically significant differences in measurements over time, according to Tukey (P<0.05). Means of six replicates ± standard error.
Maturity Index (MI). The MI of the peach fruits did not show significant differences between the different doses of Si; however, when evaluating the MI between strata, significant differences were found. The fruits from E1 (11.6) showed higher MI values than the fruits from E2 (10.7) because the shading of the leaves causes less accumulation of sugars in fruits, as well as a lower mass that directly affects the behavior of MI (Wang et al., 2022). Likewise, the values were within the ranges of 7.5 to 16 reported by Mariño-González et al. (2019) for the peach cv. ‘Dorado’ and of 9.8 to 12.4 for cv ‘Honora’ (Nuzzi et al., 2015). The MI is an important parameter, and as fruits reached maturity, the MI values increased from 9.9 to 10.9 for fruits from E2. On the other hand, the application of Si did not affect the MI.
Epidermis color. The color index (CI) of the epidermis of the peach fruits, as well as the a* and b* values, did not present significant differences between treatments, strata or areas of the tree from which they were collected (Table 2). This finding agrees with the report for strawberries, where there was no effect of soil applications of Si on the fruit color (Peris-Felipo et al., 2020), and Si was not translocated to strawberry fruits. (Ouellette et al., 2017). Therefore, it is not easy to verify the effect of this nutrient on the color of some fruits.
Table 2 Color parameters evaluated in 'Dorado' peach fruits under the application of different doses of edaphic Silicon.
| Parameter | DAH | Edaphic Silicon (kg ha-1) | ||||
|---|---|---|---|---|---|---|
| 0 | 300 | 600 | 900 | 1200 | ||
| L* | 1 | 70.28 ± 2.87a;A | 72.49 ± 1.55a;A | 68.14 ± 4.10a;A | 72.52 ± 2.5a;A | 69.04 ± 3.31a;A |
| 3 | 65.87 ± 2.85ab;AB | 68.36 ± 1.98a;B | 62.90 ± 4.30b;AB | 68.33 ± 2.19a;AB | 63.43 ± 2.87b;B | |
| 5 | 63.85 ± 4.17a;B | 66.62 ± 1.82a;BC | 62.26 ± 4.18a;AB | 64.52 ± 5.63a;BC | 61.83 ± 2.71a;B | |
| 7 | 63.60 ± 1.88ab;B | 65.97 ± 1.80a;BC | 62.20 ± 2.32ab;AB | 63.99 ± 5.28ab;BC | 60.57 ± 2.83b;B | |
| 9 | 63.05 ± 2.05a;B | 63.71 ± 2.79a;C | 60.50 ± 2.82a;B | 63.59 ± 1.23a;BC | 60.89 ± 2.03a;B | |
| 11 | 61.73 ± 1.66ab;B | 63.59 ± 1.01a;C | 59.61 ± 2.36b;B | 61.76 ± 2.61ab;C | 60.02 ± 2.38b;B | |
| a* | 1 | -8.66 ± 1.45a;C | -7.98 ± 1.43a;D | -8.42 ± 1.30a;D | -10.00 ± 2.46a;D | -9.52 ± 2.32a;C |
| 3 | 3.09 ± 2.95a;B | 2.82 ± 2.03a;C | 2.89 ± 1.38a;C | 1.43 ± 3.43a;C | 1.05 ± 3.01a;B | |
| 5 | 5.33 ± 3.54a;B | 5.60 ± 2.44a;C | 5.32 ± 2.26a;BC | 5.01 ± 3.61a;BC | 2.90 ± 3.45a;AB | |
| 7 | 8.45 ± 3.65a;AB | 7.64 ± 2.82a;BC | 6.87 ± 2.86a;ABC | 7.56 ± 4.59a;ABC | 4.96 ± 3.43a;AB | |
| 9 | 11.42 ± 3.02a;A | 11.70 ± 3.59a;AB | 9.54 ± 3.53a;AB | 9.20 ± 3.83a;AB | 8.36 ± 5.53a;A | |
| 11 | 12.91 ± 3.59a;A | 13.04 ± 3.85a;A | 10.04 ± 2.52a;A | 11.86 ± 3.4a;A | 9.88 ± 5.19a;A | |
| b* | 1 | 40.76 ± 2.73a;A | 40.50 ± 2.41a;A | 42.00 ± 3.66a;A | 40.93 ± 0.84a;A | 42.10 ± 2.46a;A |
| 3 | 36.02 ± 2.20a;B | 37.27 ± 1.85a;A | 37.56 ± 3.48a;A | 37.62 ± 1.26a;A | 37.79 ± 1.69a;BC | |
| 5 | 36.95 ± 2.09a;AB | 38.59 ± 1.98a;A | 38.74 ± 4.08a;A | 38.24 ± 1.79a;A | 38.31 ± 1.47a;BC | |
| 7 | 37.05 ± 1.21a;AB | 38.20 ± 2.31a;A | 36.82 ± 4.08a;A | 37.99 ± 3.13a;A | 37.55 ± 2.30a;C | |
| 9 | 40.50 ± 2.53a;A | 37.51 ± 6.10a;A | 37.75 ± 4.59a;A | 38.74 ± 3.56a;A | 40.57 ± 1.98a;ABC | |
| 11 | 40.25 ± 2.50a;A | 40.57 ± 2.31a;A | 39.65 ± 1.82a;A | 40.15 ± 1.63a;A | 41.13 ± 1.81a;AB | |
| CI | 1 | -3.06 ± 0.67a;D | -2.72 ± 0.52a;C | -2.93 ± 0.26a;D | -3.39 ± 0.91a;D | -3.32 ± 0.82a;C |
| 3 | 1.27 ± 1.16a;C | 1.09 ± 0.79a;B | 1.24 ± 0.63a;C | 0.51 ± 1.30a;C | 0.43 ± 1.27a;B | |
| 5 | 2.24 ± 1.38a;BC | 2.14 ± 0.87a;B | 2.18 ± 0.76a;BC | 1.96 ± 1.28a;BC | 1.23 ± 1.47a;AB | |
| 7 | 3.59 ± 1.55a;AB | 2.98 ± 0.99a;B | 3.01 ± 0.92a;AB | 2.99 ± 1.61a;AB | 2.15 ± 1.52a;AB | |
| 9 | 4.49 ± 1.27a;AB | 4.98 ± 1.66a;A | 4.09 ± 1.13a;A | 3.73 ± 1.25a;AB | 3.37 ± 2.27a;AB | |
| 11 | 5.20 ± 1.51a;A | 5.01 ± 1.36a;A | 4.23 ± 0.95a;A | 4.76 ± 1.24a;A | 4.05 ± 2.24a;A | |
DAH: days after harvest; L*: Luminosity; a*: chromaticity from green to red; b*: chromaticity from blue to yellow; CI: color index. Lowercase letters in the same row before the semicolon indicate statistically significant differences between treatments. Uppercase letters in the same column after the semicolon indicate statistically significant differences in measurements over time, according to Tukey (P<0.05). Means of six replicates ± standard error.
When analyzing the behavior of CI during the postharvest of the fruits, significant differences were found in the time since this attribute increased during storage, going from -3.08 to 4.65 at the end of the useful life (Table 2), which would indicate a gain in red hue of the epidermis, attributed to the degradation of chlorophylls as reported by Pinto et al. (2015) and an increase in the levels of carotenoid pigments (Africano et al., 2016). This behavior is similar to that reported by Mariño-González et al. (2019), who obtained color indices for peach fruits of the cv. ‘Dorado’ subjected to ethylene and 1-MPC treatments that went from -1.8 to 2.9 during the postharvest.
The luminosity decreased throughout the postharvest life (Table 2), which is similar to what was found by Orazem et al. (2013), who found significant differences between the strata of the trees during the first five days of storage and from seven days onward observed that the L* values became uniform, probably due to the onset of senescence and the loss of quality due to the oxidation caused by the increase in the activity of the enzyme polyphenol oxidase, which causes the darkening of tissues with the consequent loss of luminosity (Madani et al., 2019).
The a* increased during storage, going from -9.53 to 10.62 on average, which indicated that the fruits lost green color and gained red color. These data are lower than those reported by Africano et al. (2015), who stated that the optimal values of a* for the harvest of peach fruits are between -5.8 and -1.3. On the other hand, b* remained constant, around 39.4, throughout the postharvest period, higher than the range of 30 to 34 reported by García (2006).
Total Carotenoid Content (TCC). The TCC content of the peach fruits did not present significant statistical differences between treatments throughout storage or between the tree strata (Figure 2A). However, E2 reached a maximum of 22.1 µg g-1 of fresh mass (MF) on the fifth day, while E1 reached 19.3 µg g-1 of MF. This difference can be attributed to the fact that the E2 fruits were subjected to greater solar radiation, which can accelerate metabolism and increase the production of antioxidant compounds such as carotenes, which, according to Deaquiz-Oyola (2014), result in a higher light intensity that increases the antioxidant capacity in fruits. Similarly, Lado et al. (2019) stated that fruits located in shade have a lower expression of genes involved in the biosynthesis of carotenoids, which leads to a lower degradation of chlorophyll and a marked reduction in TCC when compared to fruits exposed to ambient light radiation. On the other hand, the values were similar to those found by Cao et al. (2017), who obtained values for peach cultivars 'Jinli' and 'Hujing' at harvest that oscillated around 16 µg g-1 of fresh weight (FW).
The TCC in the peach fruits during the postharvest period increased from harvest until they reached the maximum average values in all treatments and the two strata at fifth DAH (22.1 µg g-1 of FW), which were 21% and 88% higher than the data presented at harvest and senescence, respectively (Figure 2). From 5 DAH, the TCC decreased until the end of the postharvest of the fruits (11 DAH), probably because of oxidation reactions related to the loss of moisture from the tissues (Song et al., 2017), which are triggered by the activation of CCD4 genes that are responsible for degrading carotenoids (Liu et al., 2022).
Ma et al. (2014) stated that the concentrations of carotenoids increase proportionally as the gain of yellow-reddish color is manifested in peach fruits, which then decreases rapidly until the fruit is overripe. However, Cao et al. (2017) found that the TCC increased postharvest up to 20 DAH and thereafter presented a slight decrease. However, fruits stored at 10 °C, which differs from the present study where the fruits were stored at room temperature (14°C), reached maturation faster (5 DAH), and senescence (11 DAH) occurred faster. This highlights the importance of refrigeration since it increases the postharvest life and the conservation of the TCC for a longer time in peach fruits, as corroborated by Capriolli et al. (2009), who found higher TC values than those of this study, which ranged between 56 and 135 µg g-1 of FW.
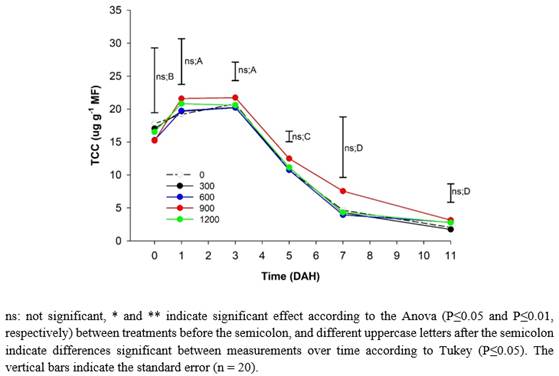
Figure 2 Effect of different doses of edaphic silicon (kg ha-1) applied on 'Dorado' peach plants on Total Carotenoids cotent (TCC) in fruits.
The fruits from plants that received 900 kg ha-1 of Si had the highest concentration of β-carotenes from 3 DAH and throughout storage, as reported by Marodin et al. (2016), who stated that increases in Si in the nutrient solution significantly increased the contents of β-carotene and lycopene in tomato fruits.
Respiratory rate (RR). The RR did not present significant differences between treatments throughout storage and showed a polynomial behavior (Figure 3A), except for at the third DAH, where the fruits from plants that received 600 and 1200 kg ha-1 of Si showed a lower RR than the control, as observed in the fruits from the two strata (Figure 3B). The climacteric peak values for fruits from both E1 and E2 were 40.96 and 38.04 mg kg-1 h-1 of CO2, respectively.
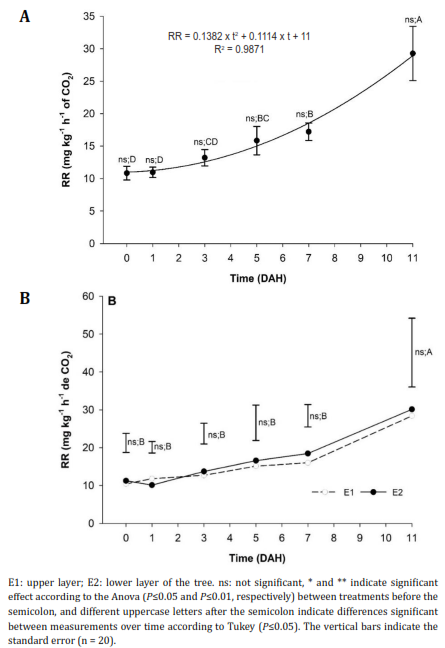
Figure 3 Respiration rate (RR) behavior of peach fruits 'Dorado' subjected to A) the application of different doses of edaphic Silicon (kg ha-1) and B) obtained from different strata of the tree.
During storage, the fruits reached maximum RR at 11 DAH, as stated by Africano et al. (2016), who reported respiratory peaks up to 73.3 mg kg-1 h-1 of CO2 after nine DAH for the 'Dorado' cultivar. These increases in respiration have also been observed by Pérez-López et al. (2014) and Akdemir & Bal (2022) for the cultivars 'Diamante' and 'Glohaven', respectively. In addition, Pérez-López et al. (2014) reported that the maximum RR value was 87 ml kg-1 h-1 of CO2 after 10h of storage at room temperature for fruits with the highest stage of maturity, while Akdemir & Bal (2022) found values of 58 ml kg-1 h-1 of CO2 after four weeks of refrigeration at 1°C. These demonstrate once again that peach fruits increase RR during storage and that the occurrence of the climacteric peak depends mainly on temperature, which is the factor that most affects RR because of the denaturation of enzymes (Pérez-López et al., 2020).
When analyzing the effect of Si doses on RR, the treatments with 300, 600 and 900 kg ha-1 showed lower RR values (22.5, 30.4, and 28.05 mg kg-1 h-1 of CO2). However, the application of 1200 kg ha-1 had higher RR values (39 mg kg-1 h-1 of CO2). Pavanello et al. (2016) reported that Si applications reduce respiration and ethylene production in fruits, and Pinzón-Sandoval et al. (2017) confirmed that the functions of Si include the stimulation of photosynthesis, which increases the strength of tissues and reduces RR.
Leaf silicon. The concentration of foliar Si in the plants that received different doses of edaphic Si did not present significant differences and registered an average of 5.17±0.58%. However, the peach plants that received 600 kg ha-1 of edaphic Si showed the highest Si values at the foliar level (6.06%) (Figure 4). Zanäo et al. (2019) stated that the levels of Si in leaves increase with the addition of different sources of silicon because the absorbed Si passes from the roots of the plant to the aerial part through the xylem, remaining in insoluble forms until reaching the leaf decomposition (Pinzón-Sandoval et al., 2017). Turbaña & Heckman (2015) confirmed that Si first accumulates in lower leaves and fruits and then in the upper leaves, where it is immobilized and not distributed to growing tissues because of the low mobility of the phloem.
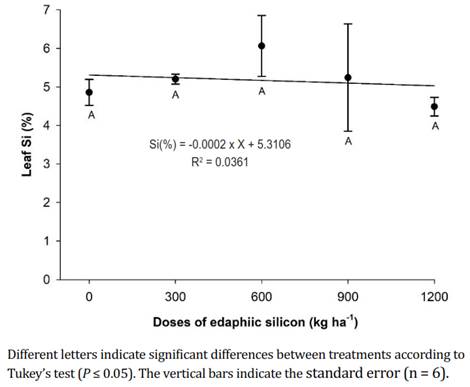
Figure 4 Leaf silicon content in 'Dorado' peach plants subjected to different doses of edaphic silicon.
According to the present study, the applications of Si to the soil increased the concentration of foliar Si in peaches (Nascimento-Silva et al., 2022) and tomatoes (Korkmaz et al., 2017), where the concentration of foliar Si was significantly higher, going from 0.11 to 4.61%. In addition, production increases have been reported with the increase in the dose of Si applied to the soil in tomatoes (Korkmaz et al., 2017) and passion fruit (Peña & Galecio, 2019), as well as increases in the dry mass of tomato leaves and stems (Korkmaz et al., 2017) and in the dry mass of blueberry shoots (Gallegos-Cedillo et al., 2018). Furthermore, Shi et al. (2016) confirmed that applications of Si increase the tolerance of plants to stress because applications of this element increase the hydraulic conductivity of roots and favor the absorption of water, along with protection from oxidative damage in the membrane because it improves antioxidant defenses.
CONCLUSIONS
The fruits from plants that received the highest doses of Si (1200 kg ha-1) presented more firmness and TSS; however, the application of Si did not affect the TCC, TTA, pH, MI, CI, or the values of a* and b*. The Si dose of 600 kg ha-1 presented higher Si foliar values. The fruits from E1 had greater firmness and TSS than those from E2; however, the TCC content did not show differences based on the position of the fruit within the tree. At five DAH, the 'Dorado' variety peach fruits had the highest TCC; however, afterward, the ML increased, suggesting the onset of senescence. The TTA and luminosity of the fruits decreased during postharvest, while the TSS and a* only presented a slight increase. The RR had higher values at 11 DAH.

