


 English (pdf)
 Article in xml format
 Article references
 Send this article by e-mail
 Cited by SciELO
  Cited by Google
  Similars in
SciELO
Similars in
SciELO  Similars in Google
 Permalink
Introduction
The Holstein breed is well known for its high volume of milk production, which is a result of strong selection pressure for this trait. In the past, milk yield (MY) was typically the trait with the highest economic impact. However, in recent years selection indices around the world have included other relevant traits such as milk solids, as the industry has begun to encourage increased levels of fat and protein in milk, as well as decreased somatic cell score (SCS) (Jamrozik and Schaeffer, 2012).
Studies have shown that milk quality is closely linked to SCS, because the presence of a large number of microorganisms results in reduced shelf life of dairy products, and could directly affect milk, cheese, and yogurt production (Murphy et al., 2016). Therefore, selection of animals genetically resistant to high levels of SCS could be an effective strategy to improve milk quality.
Furthermore, one of the main causes of quantitative and qualitative losses in dairy farming is mastitis, which results in lower yields of dairy products, as well as economic losses due to clinical treatment (Gernande et al., 2012). Direct genetic evaluation of mastitis is particularly difficult because of its low heritability and the categorical nature of the trait. In addition, subclinical mastitis is most prevalent in herds with no visible apparent symptoms; therefore, its selection is usually based on related traits, such as SCS, which have a high genetic correlation with the disease (0.60 to 0.90). This makes SCS a good genetic predictor (Govignon-Gion et al., 2016).
To this date, Brazil has not conducted a consistent genetic breeding program for quality and health traits in dairy cattle. To our knowledge, no genetic correlations have been reported in the literature between somatic cell score and milk solids of Holstein cattle in Brazil. Furthermore, just one study has reported the genetic correlation between SCS and MY, with a small number of records for this breed in Brazil (Andrade et al., 2007). So, there is an information gap, especially on the genetic components involved, for example, somatic cells and its relation with fat and protein contents in milk. Therefore, the aim of this study was to estimate the variance components and genetic parameters for SCS, milk yield (MY), fat yield (FY), protein yield (PY), fat percentage (%F), and protein percentage (%P), using a substantially large number of records of Holstein cattle in Southern Brazil.
Materials and methods
For production traits and somatic cell count (SCC), data collected by the official milk recording service of primiparous cows from the database of Paraná Holstein Breeders Association from 2005 through 2016 was analyzed. Milk samples were collected fortnightly, by association-accredited controllers, with collection intervals of 15 to 45 days.
The database comprised data of 56,718 cows from 375 herds. A pedigree file containing animal identification, sire, and dam was used, totaling 79,380 animals in the relationship matrix. The lactations were adjusted for 305 days, according to correction factors recommended by Everett and Carter (1968), and contemporary groups with at least three animals were used. Due to non-conformity to normal distribution, the SCC data were transformed to a logarithmic scale (SCS), as recommended by Sechrist (1985):

The effects included in the model were the fixed effects of contemporary group and the cow age at calving as covariates (linear and quadratic), apart from the random additive genetic effect. The contemporary groups were created taking into account the interactions of herd-year-season, with four calving seasons being considered, i.e., December to February, March to May, June to August, and September to November.
For the estimation of variance components, a multivariate animal model was used, wherein all the traits were jointly evaluated. In matrix format, the model is represented by:
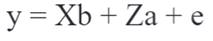
Where y = vector of the characteristic analyzed, b = vector of solutions for the fixed effects containing the contemporary group and the covariate age at calving and lactation length, a = vector of the solutions for the random additive genetic effect, X and Z = incidence matrices for fixed and additive genetic effects, respectively, and e = vector of the random residual.
The components of models for analyses can be represented as:
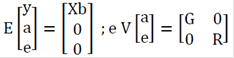
The multi-trait model can be represented as:

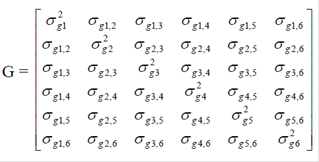
Where the subscripts 1, 2, 3, 4, 5, and 6 represent SCS, MY, FY, PY, %F, and %P, respectively. The (co)variance matrix for genetic effects is G = G A, where A is the genetic relationship matrix and G0 is the matrix (of order 6), as follows:
 Where G = A G is an additive genetic variance matrix between the characteristics, R = I
 R0 is the residual (co)variance matrix (of order 6) between the six traits. The variance components and genetic parameters were estimated by the restricted maximum likelihood (REML) method, using VCE6.0 software (Groeneveld, 2008), considering the animal model.
Results
Table 1 shows the descriptive analysis of the studied variables. The estimated average for MY, FY, and PY was 8,715.52 ± 2,071.29, 303.71 ± 60.05, and 282.41±47.18 kg, respectively. In addition, the averages for %F, %P, and SCS were 3.32, 3.06%, and 2.64, respectively. The results are in accordance with the means obtained in developing milk-producing countries, which demonstrates increase rates of productivity.
Table 1 Descriptive analysis of the variables used in the estimates of genetic parameters.

MY: milk yield; FY: fat yield; PY: protein yield; %F: fat percentage; %P: protein percentage; SCS: somatic cell score (log scale); SD: standard deviation.
Results for the variance components and heritabilities are shown in Table 2. Milk and fat yield showed moderate estimate heritabilities (0.22 and 0.26, respectively). Protein yield and somatic cell score exhibited low heritability values (0.18 and 0.19, respectively). However, as expected, the heritability estimates for fat and protein percentages were high (0.61 and 0.65, respectively). Yield traits and SCS exhibited moderate to low heritabilities, as the environmental variance was substantially relevant for these traits. The heritabilities for the percentage traits showed the opposite trend, since the additive effects were an important component of the total amount verified in the phenotypic variance.
Table 2 Estimates for the additive genetic (σ2a), phenotypic (σ2p), and residual (σ2r) variance, heritability (h2), and standard error (SE) e characteristics analyzed.

MY: milk yield; FY: fat yield; PY: protein yield; %F: fat percentage; %P: protein percentage; SCS: somatic cell score.
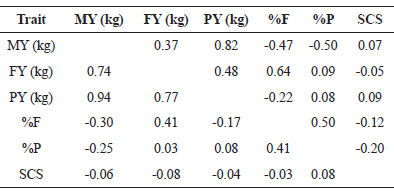
Genetic and phenotypic correlations are presented in Table 3. Strong positive genetic relationship was observed for MY and PY (0.82), FY and PY (0.48), FY and %F (0.64), %F and %P (0.50). A high but negative correlation was found between MY and %F, and also between MY and %P. In addition, no antagonism was observed among genetic and phenotypic correlations, demonstrating that the genetic selection should present expressive results as long as the environmental effects are well controlled. The results confirmed that MY has a positive genetic relation with other yield traits, but a negative correlation with fat and protein percentages. SCS showed a weak correlation between the traits, and hence, it should not interfere in the selection of milk productive traits.
Discussion
As mentioned by Moreira et al.(2019), the Paraná Basin in southern Brazil is known for having the highest dairy productivity per animal in the country. This region has a subtropical climate, with rain well distributed all year round. This area includes most of the Paraná State and is recognized to be technically developed, which is demonstrated by the production averages presented in Table 1.
The evaluated cattle had higher milk yield, with a daily average of 28.57 kg per animal (Table1), compared to the national mean of 5 kg, according to IBGE (2014). The high productivity of the cows evaluated in this study is related to environmental factors, high technological level of the farms, and the genetic potential of the animals. Nonetheless, Li et al. (2016) highlighted the necessity to increase the genetic gain in dairy cattle in the country, and an important alternative would be to select animals genetically adapted to the management systems adopted in the farms. An example of the importance of genetic improvement in dairy farming is evident when comparing the average production in countries like the United States, where average daily production is 35.60 kg of milk per animal (Sun et al., 2014). This yield is directly related to the long history of selection of breeders, which resulted in increasing improvement of various traits. Beyond that, it should similarly contribute to increase the amount of milk solids, as the economic value of milk is also related to fat and proteins.
Moderate heritability for MY has been reported for Holstein cattle by Zink et al.(2012) in the Czech Republic, Sahin et al.(2012) in Turkey, and Campos et al.(2015) in Brazil. The above-mentioned countries are semen importers, which use genetic material selected under environmental conditions different from those where the progeny is reared, leading to phenotypic variation. As a result, this could lead to a decrease in heritability estimates. On the other hand, Holstein herds have higher heritability estimates, i.e., 0.35 and 0.38, for this trait in Canada and the Netherlands, according to Loker et al.(2012) and Manzanilla-Pech et al.(2016), respectively. Perhaps the fact that these countries use genetic material selected under their own environmental conditions contributes to increasing the impact of additive genetic effects on selection, which is related to the total phenotypic variance, resulting in better estimation of heritability over the years.
The moderate heritability for FY suggests that a considerable amount of genetic gain can be achieved in a relatively short time, especially when this trait is selected using accurate genetic values, corroborating the studies on several breeds (Zink et al., 2012; Pritchard et al., 2012; Campos et al., 2015). It is necessary to improve the milk quality of Brazilian herds. Selecting for milk quality directly affects profitability, as the FY is essential for improving milk quality and its added value, consequently increasing the yield of various dairy products (Paula et al., 2008) and the competitiveness of the Brazilian market. The low heritability for PY suggests that improving the environmental factors affecting this trait may lead to higher short-term phenotypic gains. However, this trait is linked to a higher bonus paid by the industry, and thus, the inclusion of PY as a selection criterion is recommended, despite the low heritability reported in the present and other studies (Bugeac et al., 2013).
Heritability results for %F and %P are consistent with the literature reports for the Holstein breed, suggesting greater genetic control over this trait, resulting in faster genetic progress (Paula et al., 2008; Zhao et al., 2015). Therefore, the inclusion of these traits as a criterion for breed selection can be considered a viable alternative because industries are increasing their incentives for higher quality milk (e.g. granting bonuses to the producers with high %F and %P), providing the most efficient financial gain in the short-term. However, selection for %F and %P in Holstein cattle of Brazil should be done cautiously, given that these traits have a highly negative genetic correlation with MY, as shown in the present study (Table 3) and by Wasana et al.(2015).
Low heritability values for SCS were also reported by Miglior et al. (2007), Pritchard et al. (2012), Canadian Dairy Network (2016) and by Chegini et al. (2018) (0.19, 0.14, 0,18 and 0,10, respectively), emphasizing the strong influence of environmental effects on this trait. This suggests that, for better and more efficient control of SCS, we should pay attention to carefully controlling the environment (milking conditions, nutrition, facilities, and environment), coupled with genetic selection for this trait. It is noteworthy that even though the genetic gain is somewhat slower it is not irrelevant, considering the increase proportion of animals with low levels of mastitis and the presence of animals with phenotypically immune glands as a consequence. According to Rainard et al.(2018), the selection of animals with low SCS could change the mammary gland morphology and the efficiency of the teat canal, causing a reduction of bacteria penetration into the mammary gland. This could improve the efficiency of the immune response or minimize the severity of a possible disease, resulting in a decreased incidence of clinical mastitis. It is remarkable that the cost involved in the selection for SCS is quite small compared with the high cost of mammary infection treatment and replacements due to involuntary culling of cows. These are the main reasons why SCS has a long tradition of selection, especially in international dairy breeding programs (Gernande et al., 2012), as in Canada, with annual genetic trends of -0.02 for SCS (CDN, 2018). Intense selection of animals with low SCS must be conducted, despite the low heritability estimates, because improvements through genetic selection are constant, although over a longer period of time.
For genetic correlations, a moderate magnitude was obtained between MY and FY (0.37). This means that FY tends to increase moderately when there is selection for MY, and vice versa. Similar values were reported by Schennink et al.(2008) and Wasana et al.(2015), (0.38 and 0.39, respectively), indicating that the behavior of these traits tends to be the same in different herds of the breed. The same was observed between MY and PY, but at a greater intensity, in which the estimated genetic correlation was high and positive (0.82), indicating a high genetic association between these characteristics. These results are in agreement with those reported by Cecchinato et al.(2011), Wasana et al.(2015) and Chegini et al. (2018) (0.83, 0.80, and 0,90, respectively). Thus, this positive and high value indicates that selection to increase MY would indirectly increase PY. This fact is important because, even indirectly, dairy cattle farmers tend to select for milk quality, as MY has been historically considered the most selected trait.
Estimates of genetic correlation between MY and milk solids were high and negative, which agrees with the results of Loker et al.(2012) and Petrini et al.(2016), who found antagonistic relationship between MY and percentages. For this reason, particular attention should be paid by Brazilian breeders because payment is more related to milk volume than milk quality; on the other hand, the industry requires better quality, which directly depends on the selection to increase fat and protein. As suggested by Petrini et al.(2016), it is evident that the total merit index should correctly guide breeders towards the best selection.
It is worth mentioning that genetic improvement of dairy cattle has not led to an increase in MY in the same proportion as the increase in FY and PY. MY has almost exclusively selected some traits, causing a dilution in the %F and %P, which is related to total amount of milk. This may partly explain the negative correlations between MY and the percentage traits.
SCS showed a positive but low genetic relationship with MY (0.07), which is consistent with the findings of Montaldo et al.(2010), Yazgan et al.(2010) and Chegini et al. (2018) (0.18, 0.07 and 0,07, respectively). Therefore, selection of MY has little genetic effect on increasing the SCS, and the inclusion of SCS as a selection criteria, besides contributing to the increase of cow health and milk quality, would not result in a loss of milk production.
Fat yield showed a high and positive genetic correlation with PY (0.48), indicating that these traits are closely related. Therefore, it is possible to adopt a set of selection strategies for concomitant gains in both traits, achieving satisfactory milk solids to improve quality. Stoop et al.(2007) and Paula et al.(2008) also reported high values (0.75 and 0.67, respectively), confirming that the genetic relationship between PY and FY is strong and confers correlated gains to one or both of the selected traits. Fat yield and %F were high and positively correlated (0.64), indicating that indirect selection may be beneficial, as FY had a high genetic correlation with PY and %F, which, eventually, are controlled by the same group of genes (Schennink et al., 2008). However, a correlated response between FY and %P is not expected due to its very low genetic correlation (0.09), corroborating with the values of 0.11 and -0.06 as reported by Chauhan and Hayes (1991) and Dadpasand et al.(2013), respectively.
Selection objectives are often different due to differences in milk markets, production systems, cost, data availability, and industrial goals. Therefore, if selection only considers MY it would lead to a quantitative increase in milk components and %F and %P reduction. Thus, one of the possibilities for the selection criteria is to consider FY as one of the main traits to be selected because it has moderate heritability and interesting correlations with MY, PY, and %F.
Due to the genetic relationships between %F and %P (0.50), simultaneous genetic gains can be expected by selecting for only one or both of these traits. Thus, the breeder would benefit from a genetic increase in the percentage of total solids and improved quality of the product. Loker et al.(2012), Dadpasand et al.(2013) Chegini et al. (2018) observed the same relationships between %F and %P in several Holstein herds. They mentioned the importance of both traits for milk quality, as they represent the proportion of solids in milk contents.
In general, genetic correlations between SCS and the other traits were low, mostly below 0.10, showing that this trait does not interfere with or suffer from interference by selection with respect to other traits. Furthermore, SCC and PY deserve special attention from breeders when choosing selection criteria as both are of great importance to milk quality and exhibit low heritability, which should result in a slower genetic response. Genetic correlations of SCS with PY (-0.05), %F (-0.12), and %P (-0.20) were also low, suggesting that selection for FY, %F and %P would have little influence on SCS reduction and that these traits are not controlled by the same group of genes. Montaldo et al.(2010) and Pritchard et al.(2012) reported correlations of -0.10 and -0.07 for SCS and FY, respectively. Dadpasand et al.(2013) and Zhao et al.(2015) also found low and negative correlations between SCS and %F (-0.05 and -0.04, respectively). The literature also reports low and negative estimates between SCS and %P, i.e., -0.03 and -0.01 (Loker et al., 2012; Zhao et al., 2015, respectively).
Therefore, the demand for increasing milk quality in Brazilian herds should take into account the production of fat and protein, their percentages, and the SCS. Only healthy cows can maintain high quality production for a long period, which is important to ensure economic success.
In summary, moderate genetic gains can be achieved through selection for FY, wherein simultaneous genetic gains are expected for MY, PY, and %F. As expected, the use of fat and protein percentages in dairy cattle selection programs should provide genetic gains. However, their use should be done cautiously because the responses correlated with MY are negative, thus demanding constant monitoring. Lastly, low genetic correlations of SCS with MY, FY and PY suggest that intense selection on SCS would not negatively impact production traits (kg). We recommend to include SCS in the selection index of Holstein cattle in Southern Brazil, with can improve SCS in the medium and long term, promoting product quality and indirectly reducing the incidence of mastitis.

