Introduction
Reduction in genetic variation is expected in commercial cattle as a consequence of artificial selection and domestication, which may raise levels of inbreeding and lead to fixation of deleterious alleles (Taberlet et al., 2008). Furthermore, artificial insemination has increased the risk of extinction of certain cattle breeds by increasing the selective pressure and the rate of genetic change, with a concomitant reduction in effective population sizes (Taberlet et al., 2008). This highlights the importance of recognizing population genetic units and formulating strategies to preserve the genetic diversity of domestic breeds as means for their conservation, facilitate their potential to respond to biotic and abiotic challenges and ultimately guarantee their long-term productivity.
Aberdeen Angus is a cattle breed of the utmost importance in the beef market. This breed is original from Scotland and it is known for its small size, short head-tail distance, fat deposit and hardiness (Villegas Castagnasso et al., 2015). Unlike the traditional Scottish phenotype called Old Type, a more recent variety called New Type was shaped in the 1960’s and 1970’s in Canada and USA, which are of a large size, more muscular, and exhibits more cylindric body and leaner carcasses than the Old Type (Asociación Argentina de Angus, 2014).
The earliest records of Aberdeen Angus in Colombia date back to the late 19th century, when around 100 individuals of Old Type were introduced from Scotland into Huila and Caquetá provinces. These historical population correspond to the founders of herds in Tierraleja and Tamalá (Cundinamarca and Huila, respectively). More recently, new collections of Aberdeen Angus New Type were also introduced from North America (Piñeros, 1980).
Anecdotical records from livestock breeders and retailers indicate that Aberdeen Angus have been historically crossed with Colombian breeds and other European breeds such as Normande to improve its performance and productivity (Bedoya et al., 2001). Outbreeding in Aberdeen Angus is no longer a common practice and it is thought to have ceased completely in more recent years (Piñeros, 1980). Current efforts in regions with a tradition of Aberdeen Angus breeding such as the Colombian provinces of Antioquia, Cundinamarca and Huila are aimed at rescuing this breed through crosses with New Type specimens, to the point that Aberdeen Angus herds in Colombia are perceived as relatively pure (Piñeros, 1980). A previous analysis of Aberdeen Angus in Antioquia with ten microsatellite loci evidenced high genetic diversity as compared to other local breeds (Montoya et al., 2010). However, implementation of population genetic studies in other Colombian regions with a breeding tradition of Aberdeen Angus is an important step to assess the extent of admixture and relatedness with other breeds, and design management plans for this breed. Given the limited knowledge regarding the origin and introgression of Aberdeen Angus in Colombia, this study aimed to measure the levels of both nuclear and mitochondrial genetic diversity, the differentiation of Old Type and New Type herds of Aberdeen Angus in Huila and Cundinamarca and assess mitochondrial introgression with other breeds.
Materials and Methods
Population sample
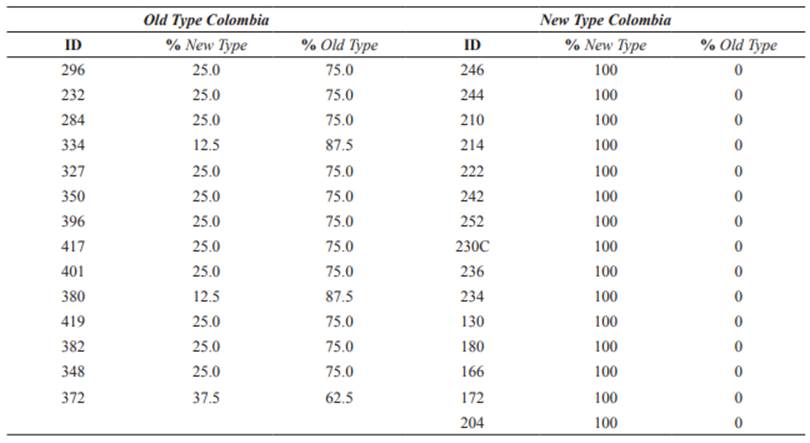
A total of 29 plucked hair samples were provided by the animal owners of “Tamalá” (Algeciras, Huila) and “Tierraleja” (La Calera, Cundinamarca) herds. Ten-generation genealogical records were used to select the least related individuals within each herd and these individuals were split into two groups according to their Old Type and New Type ancestry (Osorio and Toro 2018). The groups consisted of 14 individuals with the highest levels of Old Type (>50%) named Old Type Colombia (OTC), and 15 100% New Type named New Type Colombia (NTC).
Table 1 List of 29 individuals of Old Type Colombia (OTC) and New Type Colombia (NTC) included in this study and their corresponding ancestries (Osorio and Toro 2018).
Amplification of microsatellite loci
Genomic DNA was extracted from hair using the UltraClean® Tissue & Cells DNA Isolation Kit following the protocol from the supplier (MoBio Laboratories, Hilden, Germany). A set of ten microsatellite loci recommended by the Food and Agriculture Organization of the United Nations (FAO) for studies of genetic diversity in cattle were selected (Table 2) (Commission on Genetic Resources for Food and Agriculture 2011; Ilie et al., 2015). Several primer modifications and amplification protocols of these loci in four multiplexes were implemented by Londoño Díaz et al. (2016) and followed in this study. Each PCR reaction contained buffer 1X, dNTP’s 0.2 µM, MgCl2 2.0 - 2.5 mM, 0.2 µM of each primer, Taq polymerase 0.5 U (Qiagen, Venlo, Netherlands) and 1 µL DNA in a final volume of 15 µl. The amplification protocol consisted on an initial denaturation step at 94 °C for 5 min, followed by 35 cycles of 94 °C for 30 s, 59 - 65 °C for 45 s and 72 °C for 1 min, and a final extension step of 72 °C for 10 min. PCR products were processed in an ABI Prism 3110 genetic analyzer (Applied Biosystems, Foster City, CA, USA) (Table 2). Raw data were read in Geneious v.6.1.6 (Biomatters Ltd., Auckland, New Zealand) and allele binning was done in FlexiBin (Amos et al., 2007).
Amplification and Sequencing of the Mitochondrial Control Region
Four NTC and one OTC individuals were selected based on genealogical records as representatives of all the unique mitochondrial lineages in both herds. A fragment of 379 bp in the Mitochondrial Control Region (MCR) was amplified and sequenced with the primer pair Ilie.F (5´CAGAATTTGCACCCTAACCAA 3´) and Ilie.R (5´GGGGCCTGCGTTTATATATTG3´) (Ilie et al., 2015). The PCR cocktail contained Buffer 1X, dNTP´s 0.2 µM, MgCl2 2 mM, 0.2 µM of each primer, Taq polymerase 0.7 U (Qiagen, Hilden, Germany), and 1 µL DNA in a final volume of 40 µL. The thermal profile was as follows: 94 °C for 2 min, followed by 35 cycles at 94 °C for 30 s, 60 °C for 45 s and 72 °C for 50 s, and a final step of 72 °C for 10 min.
Table 2 Microsatellite markers used in this study indicating allele size, fluorochrome labeling and amplification conditions.
A volume of 20 µL of the PCR product was purified with a mix of Exonuclease I 0.5 U, Alkaline Phosphatase 0.25 U (New England Biolabs, Ipswich, MA, USA), and milliQ water in a final volume of 30 µL, and incubated at 37 °C for 30 min. Sequencing of the clean amplicons was then outsourced with a commercial supplier. Raw sequence profiles were read and edited in Geneious v.6.1.6 (Biomatters Ltd., Auckland, New Zealand), and aligned in Mega v.7 using the ClustalW algorithm (Kumar et al., 2008).
Diversity and genetic structure
The number of alleles (Na), effective number of alleles (Ne), observed (Ho) and expected (He) heterozygosities, probability of identity (PI), and probabilities of exclusion (PE) for microsatellite loci were estimated in GenAlex v.6.5 (Peakall and Smouse, 2006). Corrected allele richness was estimated using rarefaction with default parameters in iNEXT (Hsieh et al., 2016). PI is defined as the probability that two randomly picked specimens in a given population share identical multilocus genotypes. PE is defined as the probability of excluding an alleged father or parent pair from parentage of a given offspring in three possible scenarios: testing one parent when the other parental genotype is unavailable (PE-1 or first parent), testing one parent when the genotype of the other parent is available (PE-2 or second parent), and when a parent pair is tested (PE-3 or parent pair) (Jamieson and Taylor, 1997; Marshall et al., 1998). The Polymorphic Information Content (PIC) was estimated with CERVUS v.3.0.7. (Marshall et al., 1998).
Testing of Hardy-Weinberg equilibrium and estimation of the Wright’s fixation index (Fis) were done in Genepop v.4.6 (Rousset, 2008). Linkage disequilibrium was tested with a significance level of 0.05 and 10,000 permutations in Arlequin v.3.5.2.2 applying Holm (1979) corrections for multiple comparisons (Excoffier and Lischer, 2010). Genetic differentiation between OTC and NTC was assessed using a Principal Coordinate Analysis (PCoA) and a frequency-based Assignment test (FAT) in GenAlex v.6.5., as well as a Bayesian test of genetic differentiation in STRUCTURE v.2.3.4 (Pritchard et al., 2000; Peakall and Smouse, 2006; Garrido-Garduño and Vázquez-Domínguez, 2013). The PCoA is a multivariate method and STRUCTURE is a Bayesian approach, both designed to detect patterns of genetic differentiation within a dataset of multilocus genotypes without previous individual assignment to a candidate population. FAT is a population assignment test that estimates a log-transformed value of the probability of an individual to series of previously delimited populations based on the expected allele frequencies at each locus. The Bayesian test was implemented assuming a variable number of gene pools (K) in the sample, from K = 1 to K = 4, where the most likely number was inferred estimating ΔK in the Excel spreadsheet EX_TRUCTURE (González, 2018).
DnaSP v.5.10.1. (Librado and Rozas, 2009) was used to estimate nucleotide diversity, number and diversity of haplotypes and number of segregating sites in the MCR sequences. A haplotype network was constructed in PopArt (Leigh and Bryant, 2015) combining our sequences with others retrieved from GenBank for Old Type from Argentina and Britain, New Type from the USA and Argentina, and the diagnostic haplotypes for African (T1), Near- Eastern (T2), European (T3) and Zebuine (I1 and I2) breeds (see Accession codes in Supplementary Table 1) (Anderson et al., 1982; Troy et al., 2001; Achilli et al., 2008).
Results
Genetic diversity in microsatellite loci
The set of 10 microsatellite loci was successfully amplified in 29 individuals belonging to NTC and OTC. The total number of alleles was 44 in all loci, where SPS115 and BM2113 exhibited the largest number of alleles (five in OTC and six in NTC, respectively), whereas TGLA122 and SPS115 showed the largest effective number of alleles (3.806 and 3.982, respectively) (Table 3). The alleles 122, 128 and 138 in the locus BM2113, 184 in BM1824 and 220 in INRA64 were exclusive of NTC. PI values for single loci were between 0.092 and 0.326 with a combined value of 1.896 10-8 (Table 4). PE-1 was between 0.248 and 0.548, PE-2 between 0.112 and 0.366, and PE-3 between 0.392 and 0.739. Combined PE-1, PE-2 and PE-3 values were 0.995, 0.942 and >0.999, respectively.
Table 3 Indices of genetic diversity for ten microsatellite loci in two populations of Aberdeen Angus in Colombia (Old Type Colombia and New Type Colombia).
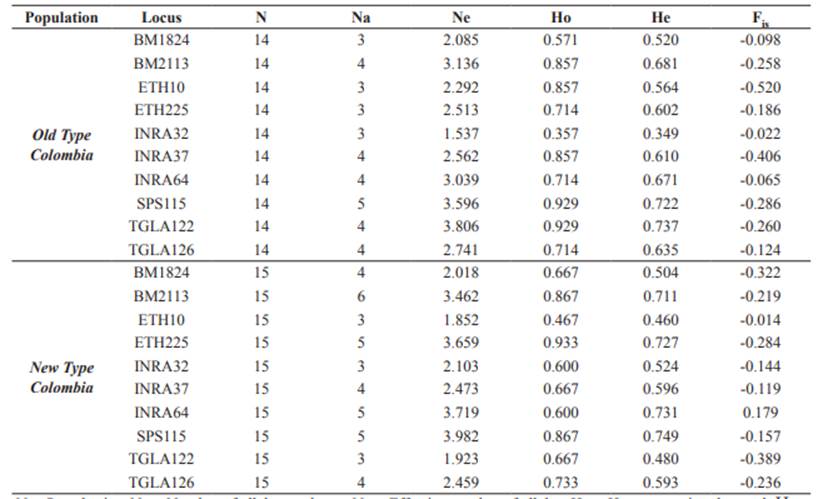
N = Sample size; Na = Number of alleles per locus; Ne = Effective number of alleles; Ho = Heterozygosity observed; He = expected Heterozygosity; Fis = Wright’s Fixation Index.
PIC was between 0.425 and 0.723 with a mean value of 0.599. Significant deviations from Hardy- Weinberg equilibrium or significant inbreeding (Fis) were not found in any locus (α ≥ 0.05, Table 3). Also, no linkage disequilibrium between any pair of loci was found after Holm’s correction.
Genetic structure in nuclear loci
Genetic differentiation of NTC and OTC was evidenced in the PCoA (Figure 1), where principal components 1 and 2 provided 42.4 and 32.3% of the total genetic variation, respectively. However, an individual initially classified as OTC (AA284), was more related to NTC. The Population Assignment test in GenAlex successfully assigned every individual originally classified as OTC or NTC to its original cluster and evidenced a clear genetic differentiation of these two types (Figure 2).
Table 4 Values for Probability of Identity (PI), probabilities of Exclusion (PE-1, PE-2 and PE-3) and Polymorphic information content (PIC) for 10 loci microsatellite loci in Aberdeen Angus from Colombia.
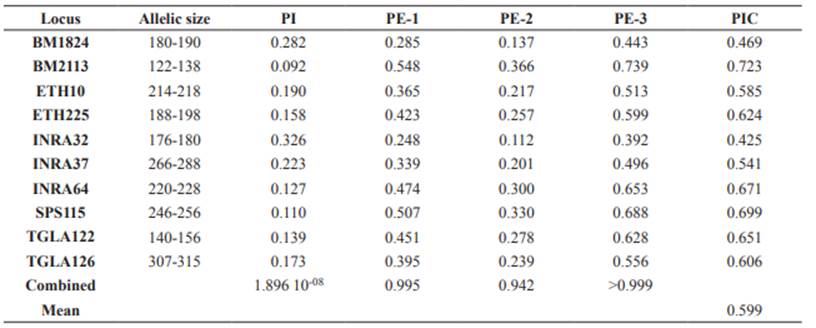
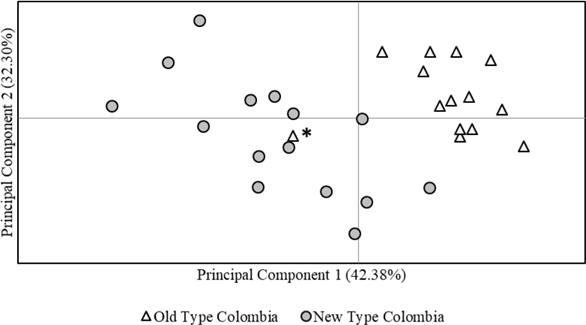
Figure 1 Principal Coordinates Analysis (PCoA) for Old Type and New Type Aberdeen Angus in Colombian herds. The asterisk points out an Old Type individual (AA284) with closer relationship to New Type.
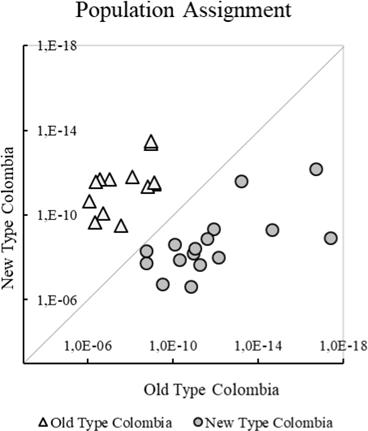
Figure 2 Individual probability of assignment of Aberdeen Angus in Colombian herds to their original Old and New Types.
The most likely number of gene pools in our sample, as inferred with the Bayesian population analysis in STRUCTURE, was one (K=1; ΔK=8.09), since substantial levels of genetic admixture were found in several individuals such as 2 (AA284), 19, 21 and 25 in Figure 3. However, the analysis with K = 2 (ΔK=2.04) allowed the recognition of two clusters that in most cases match the original classification as OTC or NTC (Figure 3).
Rarefaction curves revealed a corrected allelic richness close to an asymptotic value for all loci in both OTC and NTC, indicating only a limited effect of sampling effort on the detected levels of allelic richness (Figure 4).
Diversity and genetic structure of the Mitochondrial Control Region
The MCR sequences recovered from the five selected individuals were all different from each other (haplotype diversity of 1.0), showed 16 variable sites and nucleotide diversity of 0.00841. The haplotype network with the sequences derived from this study and those retrieved from the Genbank showed a “star” pattern around Hap_05, which is one of the European diagnostic haplotypes (T3), present in USA New Type, Argentinean New Type, British Old Type and Argentinean Old Type, but not in Colombian Aberdeen Angus sampled in this study (Figure 5). NTC was more diverse than OTC since they exhibited four and one haplotype, respectively. NTC haplotypes were Hap10, Hap25, Hap26 and Hap27; and the only haplotype present in OTC was Hap28. In particular, Hap27 is four mutational steps from both the African T1 Hap29 and Hap15 present in Argentinean New Type. Similarly, Hap26 is four mutational steps from both the European T3 Hap1 present in Argentinean New Type, and Hap18 present in British Old Type. Haplotypes Hap10 and Hap25, as well as Hap28, were between one and three mutational steps from the European Hap5 in the haplotype network.

Figure 3 Assignment Test based on the Bayesian model (n=29): Old Type Colombia (1-14) and New Type Colombia (15-29). Individual AA284 corresponds to number 2 in this figure.
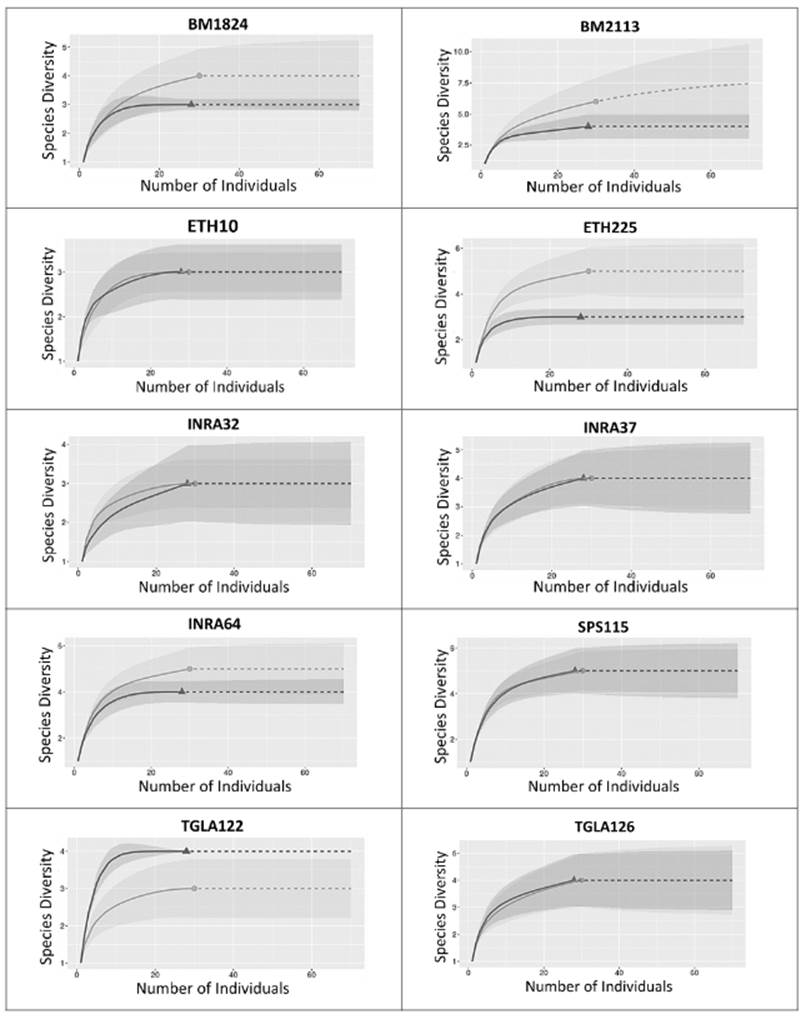
Figure 4 Curve of rarefaction for corrected allele richness of Old Type Colombia (OTC, Δ) and New Type Colombia (NTC, O). Interpolated data (--) and extrapolated data (---).
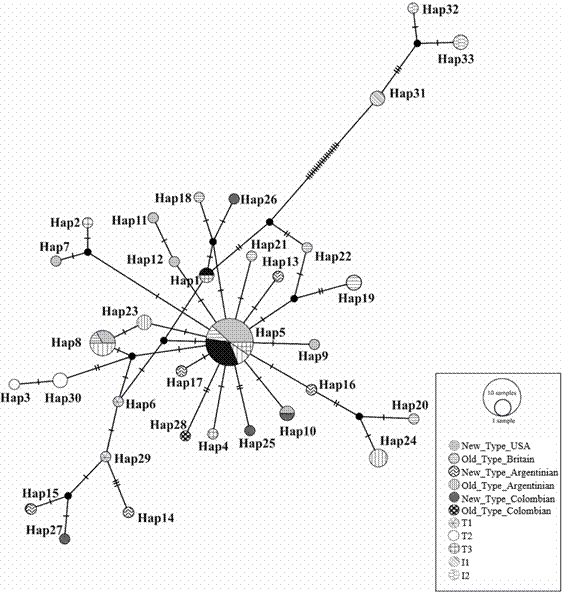
Figure 5 Haplotype network of mitochondrial sequences of Aberdeen Angus New Type USA, New Type Argentina, Old Type Britain, Old Type Argentina, New Type Colombia y Old Type Colombia. Diagnostic haplotypes for African, Near-Eastern, European and zebuine breeds are T1, T2, T3, I1 and I2, respectively.
Discussion
This study of the genetic structure and diversity of Aberdeen Angus in herds of the Colombian provinces of Cundinamarca and Huila made use of ten nucleotide markers that revealed high polymorphism and elevated levels of genetic diversity in both New Type and Old Type biotypes. These markers were very informative and good candidates for demographic studies as well as relatedness and paternity tests in Aberdeen Angus, given the high average Polymorphic Information Content (>0.5), a value of the combined Probability of Identity close to zero and Powers of Exclusion on three different scenarios that were also close to an ideal value of 0.999 (Botstein et al., 1980; Stevanovic et al., 2009; Radko, 2010; Montoya et al., 2010; Sepúlveda et al., 2012; Campos et al., 2018). However, the average number of alleles per locus was below the number previously reported for Aberdeen Angus in Antioquia, where it varied between 7 and 11 alleles for the same markers (Montoya et al., 2010). Rarefaction analysis indicated that this deficit cannot be explained by limited sampling effort and therefore may be a consequence of regional differences in population history and management.
Both analyses of population structure were consistent in the recovery of two distinct groups corresponding to the New Type and Old Type biotypes. The only exception to this pattern was observed in one individual, whose biotype corresponds to Old Type, but was assigned to New Type by the genetic analyses. This might be due to errors in genealogical records and incorrect morphological assignment to Old Type.
Levels of mitochondrial haplotype diversity of Aberdeen Angus in Colombia were high and similar to those previously reported for this breed in the USA, Argentina and Britain (Ginja et al., 2010). Unlike nuclear markers, genetic structure between Old Type and New Type was absent at the mitochondrial level. Several haplotypes such as Hap5 and Hap8 are present in both European and American Old Type and New Type, but a few haplotypes with restricted distribution might still be proposed as candidates to diagnose Old Type and New Type (e.g. Hap7, Hap9, Hap11 and Hap12).
All the Aberdeen Angus haplotypes found in this and other studies are clearly related to European or African Bos taurus lineages. Likewise, most NTC haplotypes correspond to European lineages, but the close relation of the NTC haplotype Hap27 to African T3 haplotypes revealed introgression in the mitochondrial genome between African and European bovines (Troy et al. 2001; Bruford et al. 2003; Ginja et al. 2010; Villegas Castagnasso et al. 2015). This pattern of mitochondrial introgression can also be observed in Argentinian New Type haplotypes (Hap15 and Hap14), given their close relationship to T3 haplotypes in the mitochondrial network, revealing widespread mitochondrial introgression in Latin American herds of Aberdeen Angus.
In conclusion, this study provides a set of polymorphic markers useful to trace the origins, admixture, relatedness and overall for genetic management of Aberdeen Angus in Colombia. We also proved genetic introgression in Aberdeen Angus in Colombia, mainly through crosses with females of other breeds of European or African origin.


