Services on Demand
Journal
Article
Indicators
-
 Cited by SciELO
 -
 Access statistics
Related links
-
 Cited by Google
 -
 Similars in
SciELO
 -
 Similars in Google
Share
Desarrollo y Sociedad
Print version ISSN 0120-3584
Desarro. soc. no.75 Bogotá Jan./June 2015
https://doi.org/10.13043/DYS.75.5
DOI: 10.13043/DYS.75.5
Testing for Bubbles in the Colombian Housing Market: A New Approach1
Detectando burbujas en el mercado de vivienda colombiano: un nuevo enfoque
José E. Gómez-González2
Jair N. Ojeda-Joya2
Catalina Rey-Guerra2
Natalia Sicard2
1 The findings, recommendations, interpretations and conclusions expressed in this paper are those of the authors and do not necessarily reflect the view of the Banco de la República or its Board of Directors.
2 The authors are, respectively, Senior Research Economist, Research Economist, Research Assistant and Research Assistant pertaining to the Research Department of the Central Bank of Colombia. Bogotá, Colombia. Emails of the authors are, respectively, jgomezgo@banrep.gov.co, jojedajo@banrep.gov.co, mc.rey11@uniandes.edu.co, nataliasicard91@gmail.com.
Este artículo fue recibido el 10 de diciembre de 2013, revisado el 14 de marzo de 2014 y finalmente aceptado el 16 de marzo de 2015.Abstract
In the context of financial crises influenced by the development and burst of housing price bubbles, the detection of exuberant behaviors in the financial market and the implementation of early warning diagnosis tests are of vital importance. This paper applies the bubble-detection methodology developed by Phillips, Shi and Yu (2012) to the most important Colombian residential property market. The empirical results suggest that this housing market experienced a price bubble that began in the second half of 2012. This result holds true under alternative robustness checks, namely alternative price deflators, regression windows and price segments. The only exception is in the case of the low-price segment of the housing market where prices have not increased recently. Bubble episodes, under this approach, consist of periods of explosive behavior of the nominal asset price which are not explained by the evolution of its market returns.
Key words: Housing-price bubbles, unit-root tests, asset pricing, Colombia.
JEL classification: C22, G12, R31.
Resumen
En el contexto de crisis financieras influenciadas por el desarrollo y caída en las burbujas de precios de la vivienda, la detección de comportamientos exuberantes en los mercados financieros y la implementación de pruebas diagnósticas de detección temprana son de importancia vital. Este artículo aplica la metodología de detección de burbujas desarrollada por Phillips, Shi y Yu. (2012), al mercado de propiedad residencial más importante en Colombia. Los resultados empíricos sugieren que este mercado de vivienda ha experimentado una burbuja de precios a partir de la segunda mitad del 2012. Este resultado se mantiene para varios chequeos de robustez alternativos, en particular, para diferentes deflactores de precios, ventanas de regresión y segmentos de precio. La única excepción se da en el caso del segmento de precios de vivienda bajos, ya que allí no se han observado incrementos recientes. Los episodios de burbuja, según este enfoque, se definen como periodos de comportamiento explosivo del precio nominal del activo, los cuales no son explicados por la evolución de sus retornos de mercado.
Palabras clave: Burbujas de precio, mercados de vivienda, pruebas de raíz unitaria, precios de los activos, Colombia.
Clasificación JEL: C22, G12, R31.
Introduction
Financial crises and asset price bubbles are strongly connected. Many financial crises have followed episodes of exuberant price increases in real and financial assets. Traditional examples include the Dutch Tulipmania, and the 1929 Great Crash in the United States. During the seventeenth century Dutch Tulipmania, extremely rapid price increases in tulips motivated people to buy tulip bulbs on credit with the hope of making instant fortunes. A single bulb of the "Semper Augustus", one of the priciest types of tulips, cost 13,000 guilders, more than many first-class houses in Amsterdam. However, by 1637 the tulip price bubble crashed and many market participants went bankrupt. The history of the 1929 crisis is not that different, although stocks instead of tulips were involved in it.
More recent examples of asset price bubbles include Japan in the late 1980s and early 1990s (real estate and stocks), several Latin American economies in the 1980s (credit and housing), South East Asian Economies in the late 1990s (housing, credit and stocks), the Mexican Tequila crisis, Russia in the late 1990s, and an important group of industrialized economies in the recent international financial crisis.
Following Brunnermeier (2008), we define bubbles as those periods when asset prices exceed their fundamentals due to the expectations of market participants about future price increases. These phenomena typically have common features. In a first stage, ample credit expansion accompanied by sustained increases in asset prices, such as stocks and real state, inflate the bubble. In a second stage, the bubble bursts and asset prices collapse as short sales abound. Sufficiently large bubble bursts lead to the default of many agents who had borrowed to buy assets at historically high prices and banking crises may follow.
Given its importance, price bubble detection has been widely studied in the literature. The most commonly used detection methods follow the present value model under the assumption of rational bubbles. Early proposals include Shiller's variance bound test (Shiller, 1981), and West's two-step test (West, 1987). Campbell and Shiller (1987) and Diba and Grossman (1988) introduced the (perhaps) most commonly used methods for detecting asset price bubbles in the literature, namely the right-tailed unit root test and the co-integration test.3 These two tests have been extensively used to detect stock price bubbles and housing price bubbles over the last two decades (for instance, see Arshanapalli and Nelson, 2008; Drake, 1993).
These frequently used methods, however, suffer from a serious limitation that was first pointed out by Evans (1991), who shows that these tests lose significant power to detect explosive bubbles when the sample data includes multiple bubbles that emerge and collapse.4 Different alternative approaches have appeared in the literature to deal with Evans' critique. In a recent paper, Phillips, Wu and Yu (2011) propose an Augmented Dickey-Fuller (ADF) test that improves power significantly with respect to the conventional unit root and co-integration tests, and allows estimating the origination and final dates of the bubble. This method is however designed to analyze a single bubble episode, while most datasets might include multiple bubbles. To overcome this limitation, Phillips et al. (2012) generalize the methodology and propose a generalized test (GSADF) for detecting multiple bubbles. They show that this method identifies the presence of bubbles in the S&P 500 around every financial crisis during the period 1871 - 2010 in the US.
This methodology is also used by Yiu, Yu and Jin (2013) for detecting bubbles in the Hong Kong residential property market. Interestingly, they find striking results that significantly contrast with earlier papers on Hong Kong's housing market. In particular, they report evidence of housing price bubbles that have not been detected using traditional detection methods.
In this paper we present a new application of this newfangled method, using monthly data for the most important regional housing market in Colombia: the city of Bogota.5 Our monthly data span the period January 1994 - December 2013. Studying housing markets in Colombia is interesting due to the following reasons. First, Colombia experienced a deep financial crisis in the late 1990s after a period of financial liberalization. This financial crisis has been widely attributed to a housing price bubble following the financial liberalization process of 1991.6 Second, since 2010 housing prices have steadily grown in the country, motivating a heated debate on whether or not Colombia is experiencing a new episode, (Hernández and Piraquive, 2014; Salazar, Steiner, Becerra y Ramírez, 2013). In contrast to earlier papers that study this debate, we find that the main housing market in the country was experiencing a residential property market price bubble since 2013 until the end of our sample. Hence, these results confirm that this new methodology can be useful as an alternative early-warning tool for detecting exuberant behavior in financial and real asset prices.
Section I presents some stylized facts of the Colombian housing market. Section II presents a theoretical asset-pricing model, which includes the possibility of a rational bubble. Section III makes a brief presentation of the econometric methodology and highlights its advantages with respect to alternative methods. Section IV presents the empirical results. Some robustness checks are described in Section V. Finally, Section VI concludes.
I. Stylized Facts
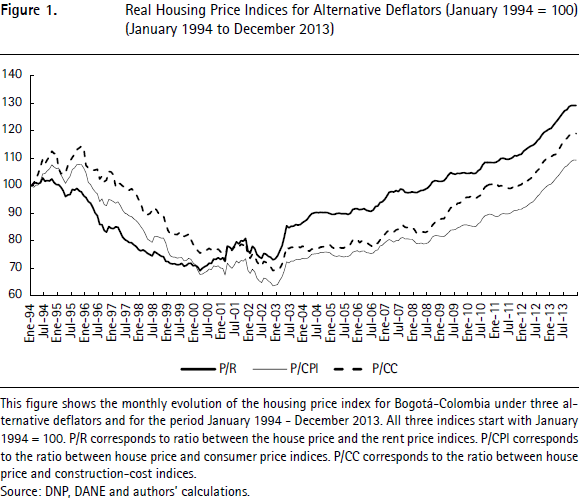
Figure 1 displays the time series plot of the monthly real price index for the Bogota housing market under three different deflators. P/CPI uses the Colombian Consumer Price Index (CPI) to deflate the nominal housing price index. P/R uses the housing rental price index. Finally, P/CC uses the housing construction cost index.7 Our interest lies mainly with the P/R ratio since asset prices are basically determined by the discounted sum of its expected dividends, which in the case of housing are rental prices. Asset pricing theory shows that studying the price-dividend ratio allows deriving regularities in the historical behavior of asset prices (see, for instance, Cochrane, 2005). In the case of housing prices the P/R ratio can also be interpreted as the user cost of capital (Poterba, 1992).
From the argument above, the rental price should be considered as fundamental to housing prices. The other two deflators (CPI and CC) are used here as alternative benchmarks and demonstrate the robustness of our results. We assume there are no unobservable fundamentals.
It is important to note that measuring the fundamentals in housing markets is difficult. Ideally rents and prices should be calculated separately for groups of identical, or at least homogeneous, houses. Even in the case in which disaggregated information on housing units is available, some problems must be solved. While rents and prices for rented units may be observed, it is hard to determine implied rents for owner-occupied houses. However, in our study (and in most studies of this market) we only count with aggregated data. Therefore, we use the ratio of the two indices for the whole market.8 Prices of new houses are collected by the National Planning Department (DNP for its acronym in Spanish); data on the rent, cost construction and CPI indices are provided by the National Bureau of Statistics of Colombia (DANE for its acronym in Spanish).
Colombia's real estate market experienced a strong down-price movement between the end of 1995 and the end of 1999, before and during the first stages of the late 1990s' financial crisis. Once this slowdown stopped, housing prices stabilized at a relatively fixed level for almost six years showing a marginal increase in 2003. It was not until the beginning of 2006 that the index started showing an increasing slope that has become more pronounced since the beginning of 2012.
Recent papers studying the behavior of the Colombian housing market price index have concluded, after implementing standard bubble detection tests, that although prices have increased importantly since 2010, there is no statistical evidence of housing-price bubbles for this market. See for instance, Salazar et al. (2013). Hernández and Piraquive (2014) find that housing prices are reaching historical highs in Bogotá, but do not associate this behavior to a housing price bubble. In a recent paper, Morales (2014) shows that the immigration of Venezuelan citizens has affected housing prices in Colombia; in particular those Colombian cities with a higher number of immigrants have experienced more pronounced price increases.
Our results are in this sense striking, as we find robust evidence of a housing price bubble at the final part of the sample by using an econometric test which detects explosive behavior of the asset price with respect to its fundamentals.
Figure 2 shows the time series plot of the monthly real price index for the Bogota housing market for three house-price segments and using the rental price index as deflator. P1/R corresponds to low-value houses that are 108 million or lower (Colombian pesos) at constant prices of 2012.9 P2/R corresponds to medium-value houses that are between 108 and 242 million (Colombian pesos) at constant prices of 2012. Finally, P3/R corresponds to high-value houses that are more than 242 million (Colombian pesos) at constant prices of 2012.10
It is clear from Figure 2 that the behavior of the total index (Figure 1) is mostly driven by the index for high-value houses. The price indices for the other two segments show a milder decline during the financial crisis period (1995-2000). The indices for medium-value houses show a similar behavior to the high-value index since 2003, especially, their steep increase in 2012 and 2013.
II. Asset Pricing
We use a new recursive procedure which allows testing, identifying and date stamping explosive bubbles in economic time series. This econometric method is developed by Phillips et al. (2012) and its purpose is serving as an early warning system. It is assumed that prices of financial assets are subject to pricing errors and/or time-varying discount factors which induce the formation of financial exuberance through price bubbles.
Following Phillips et al. (2012), a bubble can be defined within a standard assetpricing model with a constant discount factor:
The after-dividend price of the asset is Pt; the payoff (dividend) received from the asset is Dt; the expectations operator with information until period t is Et; finally, rf is the risk-free interest rate. Solving Equation (1) recursively, we obtain an expression for the price of the asset as a function of the expected flow of future payoffs.
The bubble component can be defined from Equation (2) as the difference between the asset price and its fundamental which is defined as the discounted sum of expected future payoffs: Bt = Pt - PtF. Diba and Grossman (1988) show that this component has an explosive behavior since: Et(Bt+1) = (1 + rf)Bt. Note that in this model, bubbles can arise even under rational expectations, which differs with the behavioral finance approach that considers alternative definitions of rationality; see for instance, Blanchard and Watson (1982).
The presence of explosive behavior is the key feature used by the bubble detection tests. However, since the behavior of the price is driven by the (possibly exuberant) behavior of its expected payoffs, Phillips et al. (2012) suggest applying these econometric tests to the ratio Pt/Dt which cannot behave explosively in the absence of bubbles.
III. Econometric Methods
The econometric method is based on the ADF unit root test which follows Equation (3):
where ft is the price-dividend ratio of the asset and εt is a white-noise error term. The null hypothesis is unit-root behavior (H0 : ρ = 1) and the alternative hypothesis is explosive behavior, (H1 : ρ > 1). Notice that this alternative hypothesis differs from that in traditional unit-root tests (H1 : ρ < 1).
The right-tailed ADF statistic is computed in multiple recursive regressions in which the number of observations is varying as well as the initial observation for each regression. The GSADF statistic is the supremum of the test with respect to the number as well as the alternative initial observations. This statistic is then used to detect the presence of at least one bubble in the whole sample. In order to estimate the origination and collapse dates of every bubble, a sup ADF (BSADF) statistic with respect to the number of observations is computed for each alternative last observation in every regression. The resulting series of ADF statistics is then compared with an appropriate series of critical values.
A. GSADF: Bubble Detection Method
Let r0 be the fraction of the sample that corresponds to the minimum number of observations used in each regression. Furthermore, let r2 be the fraction corresponding to the last observation used in the regression. Finally, let rw ≥ r0 be the fractional window size of the regression and n the total sample size. Let  be the test statistic obtained in a regression starting in fraction r2 - rw and ending in fraction r2. Then the test statistic is defined as follows:
Phillips et al. (2012) derive the limit distribution of the GSADF statistic which is a non-linear function of r0 and Brownian motions. Using this result and Montecarlo simulation methods, it is possible to compute both asymptotic and finite-sample critical values.11
B. BSADF: Bubble Stamping Method
The methodology for time stamping bubbles consists of computing a series of test statistics which are defined in the following way:
Notice that a BSADF statistic is computed for each alternative fraction r2 which corresponds to each observation in the sample (except for the first [r0n] observations). In this case the supremum is computed with respect to the alternative sample sizes used to compute the ADF statistic. The origination date of a bubble corresponds to the date when the sup ADF statistic is increasing and reaches a specific critical value. Similarly, the collapse time is defined as the date when this test statistic is decreasing and gets below an appropriate critical value.
We use the following series of critical values (see Yiu et al., 2013):
where 2.44 is the 99th percentile of the asymptotic distribution of the sup ADF statistic. Alternatively, we use the 95th and 90th percentiles, which are equal to 1.92 and 1.66, respectively.
IV. Results for Alternative Deflators
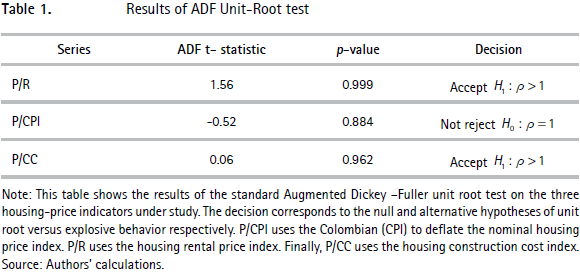
When applying a standard ADF test (Table 1), we are able to reject the unit-root null hypothesis for the P/R ratio, in favor of an explosive behavior of the series. When checking for robustness of this result, a similar result is obtained for the P/CC ratio. However, we are unable to reject the unit-root null hypothesis for the P/CPI ratio. In contrast, when we apply the methodology of Phillips et al. (2012), we are able to find evidence favoring the presence of multiple bubbles in all three series (Table 2). This result illustrates that this method is able to identify the presence of bubbles that are not always identifiable through the implementation of standard unit-root tests, and therefore it is very useful as an early warning method.
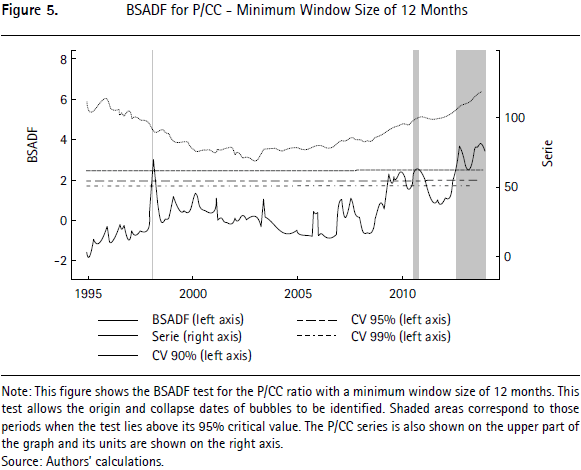
Once the presence of bubbles is confirmed in Table 2, figures 3, 4 and 5 show our main results through the identification of the points of origin and collapse of the bubbles. These estimations are performed with a minimum window size of 12 months and alternative deflators for the house price index.
Figure 3 presents evidence of six episodes of price exuberance when considering the P/R ratio. A Table in Appendix 1 shows the exact dates of origin and collapse of all the identified bubbles. We focus our attention on the two longest bubbles in Figure 3. The first one starts in May 1996, lasts 6 months and corresponds to a negative bubble that preceded the financial crisis which started a few months later.12 The second period of exuberance starts in the second half of 2012, is a positive bubble, lasts 18 months until December 2013, and can be associated to the period of ample credit expansion recently experienced by Colombia. This credit expansion is a common feature in many emerging economies given the wave of capital inflows during recent years, (see for instance Levy-Yeyati, Sturzenegger and Gluzmann, 2013), which is a reaction to the expansionary monetary policy in the United States, and has influenced the behavior of asset prices in Colombia and many other emerging economies (see, for instance, Cubeddu, Tovar and Tsounta, 2012).
Figure 4 shows the results when using the CPI for deflating the housing price index. Only two bubbles are identified, the first one is a negative bubble in April 1998. The second one corresponds to the same positive bubble at the end of the sample which is also identified in Figure 3.
Figure 5 shows analogously the results of the bubble-identifying test when the construction cost index (CC) is used as a deflator of the house price index. The use of CC as deflator is justified by the potential effect of construction costs on the final price of houses. In this case, three exuberance periods are identified. The first one is the negative bubble of 1998. The second one is a positive bubble that started in September 2010, lasted two months and is related to the credit expansion period in Colombia. The bubble at the end of the sample is also identified starting in September 2009. Therefore, these figures show that the negative bubble in the 1990s and the positive bubble at the end of the sample are robust to alternative deflators of house prices.
Notice that Appendix 1 describes the exact periods of exuberant price behavior for alternative deflators and minimum window sizes.
V. Robustness Checks
A. Results for Longer Regression Windows
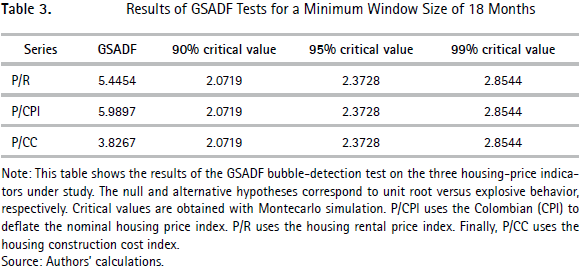
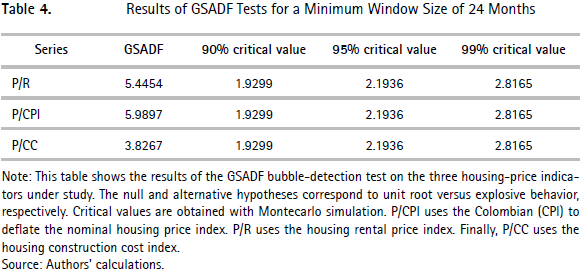
The results in Table 2 are computed for a minimum window size of 12 months. Therefore, the test identifies a bubble only if the explosive behavior of the deflated house price persists during at least 12 months. As a robustness check we incorporate more strict requirements for the detection of bubbles by assuming longer minimum window sizes. Tables 3 and 4 show results for sizes of 18 and 24 months, respectively. Overall, these results are qualitatively identical since the unit root hypothesis is rejected favoring the alternative of at least one episode of explosive behavior in all three house-price ratios.
Figures 6 to 8 present results of the BSADF test for the three ratios using a longer window size. In this case, for a bubble to be detected the explosive behavior should have persisted during at least 24 months (instead of 12). The main results on bubble detection periods hold true.13
Some of the bubbles identified in Figures 3 to 5 are not robust to longer regression windows, but the test still detects a positive bubble beginning in the second half of 2012. Therefore, it is important to highlight that the existence of a period of housing price exuberance starting in the middle of 2012 is robust under alternative deflators and minimum window sizes.
B. Results for Alternative House-Price Segments
As another robustness check, we apply the bubble-detection methodology to three alternative house price segments which are part of the total house price index for the city of Bogota. These price indices are deflated by the rental price index as explained in Figure 2.
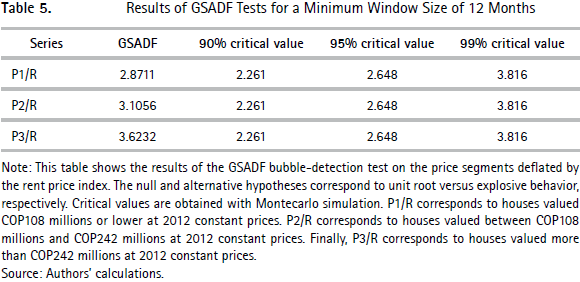
Table 5 shows that the GSADF test detects the presence of at least one bubble in all three price segments. However, in the case of the lower price segment this evidence stands only at the 90% degree of confidence. This result is consistent with Figure 2 since the evolution of the price ratio for this price segment is less volatile and with less pronounced cycles than the other two price segments. In particular, this price ratio does not show a high growth rate during recent years.
Figure 9 shows the results of the bubble-identifying test in the case of the low-price segment. As mentioned previously in Table 5, the evidence of exuberance behavior is not strong for this series and therefore, the test only identifies a one-month positive bubble in September 2006. The recent behavior of this price segment has not been explosive (see upper part of Figure 9), but it has fluctuated around the level reached in 2008.
Figure 10 shows the results in the case of the medium-price segment. The BSADF test finds three recent bubbly episodes. The first one goes from September 2008 to May 2009 and corresponds to a period of accelerating house prices in this segment. The second bubble is very brief and takes place in October 2012 during a new upward trend of house prices. Then, after a 3-month pause, the third positive bubble starts in February 2013 and lasts until the end of the sample.
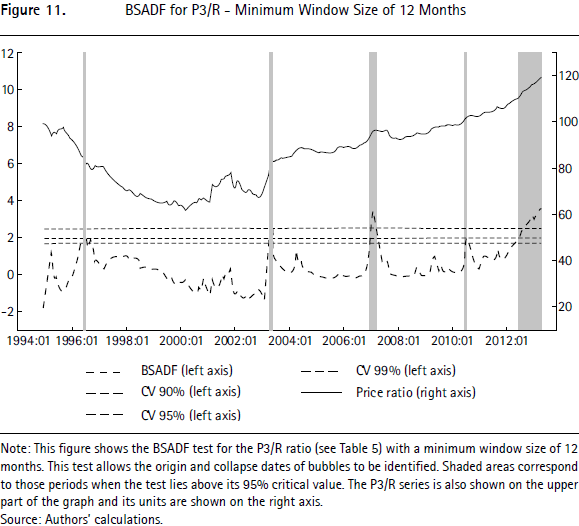
The series for the high-price segment has a similar behavior to the total house price index in Figure 1 which is explained by the high share that this segment has on the total index (56%). Therefore, the results from the bubble detection test for this segment (Figure 11) are quite similar to those for the total price index in Figure 3. The price-ratio for the high-price segment has five bubble episodes in our sample including a negative bubble in July 1996. However, the longest episodes are the most recent bubble, which starts in July 2012, and a 3-month bubble starting in January 2007. The timing of these episodes is also consistent with those in Figure 3.
Summing up, the results on the identification of housing-price bubbles in Bogota, Colombia are found to hold mostly in the high and medium-price segments. Data for low-value houses do not show any evidence of a recent episode of price exuberance.
VI. Conclusion
This article performs the bubble detection test described by Phillips et al. (2012) and shows that the Bogota - Colombia housing market may have been experiencing a price bubble since the second half of 2012. This evidence contrasts with recent works employing traditional bubble-detection methodologies. The economic reason for this behavior is the high growth rate of nominal prices, which are mostly driven by the interaction of a strong demand with a slow reacting supply. It has been documented that low interest rates and enhanced mortgage access have accelerated the demand for housing by Colombian families. On the other hand, regulatory restrictions and speculative behavior by landowners have prevented a faster supply of new housing. See Clavijo, Vera and Ordóñez (2014) for further details of these developments in the Colombian housing market.
Our results have gone through three robustness checks: alternative price deflators, alternative minimum regression windows and house-price segments. First, we find that the recent bubble episode is also detected when two alternative price deflators (consumer prices and construction costs) are used. Second, this result is also robust to longer regression windows which imply more strict requirements for the existence of a bubble. Finally, our results show that the recent bubble has taken place mostly in the high and medium house price segments. No recent exuberant behavior has been detected in the low-price segment.
On the other hand, we find evidence of a negative bubble during the late 1990s, which could have triggered the financial crisis that Colombia experienced at that time. However, this bubble is not robust to alternative regression windows or price segments. It is important to note that Diba and Grossman (1988) establish that negative bubbles cannot exist under the free disposal of assets, because the asset holders cannot rationally expect a stock price to decrease without bound and, hence, to become negative at a finite future date. Considering this argument, in our context a negative bubble can only happen temporarily (for a finite time-window) and under the restriction that the housing price index cannot take on a negative value.
These results illustrate that this method is able to identify the presence of the exuberant behavior of asset prices, which are not identifiable under traditional methodologies. Therefore, it is very useful as an early warning indicator for central banks and economic policymakers.
Acknowlegements
The research carried out for this article did not have any institutional funding, however this was done within the framework of the activities of the Research Unit of the Banco de la República.
We gratefully acknowledge Peter C. B. Phillips, Jun Yu, Hernando Vargas, Andrés Murcia, Luis Fernando Melo, and seminar participants at CEMLA and the Banco de la República's workshop for valuable comments. We are especially grateful to Adriana Camacho and two anonymous referees for superb comments on a previous version of our document. All remaining errors are our own.
_____________________________
Foot notes
3 The idea behind this methodology is that explosiveness in the dynamic behavior of an asset price after its fundamental value is considered is a necessary condition for the identification of a bubble.
4 The main point here is that traditionally, right-tailed unit root tests are performed on the whole time series implying that either the whole time series exhibits an explosive behavior or not. By using these types of tests, it is difficult to identify asset price bubbles when they emerge and collapse during the same sample period.
5 This is the capital and largest city of Colombia. It has around 20% of the total population and the highest GDP per capita of the country. There is not any monthly housing price index available for the whole country.
6 See, for example, Clavijo, Janna and Muñoz (2005).
7 We do not use the price of any financial asset as a deflator because the test might falsely reject the presence of a bubble in the house price if its deflator is also experiencing a similar behavior.
8 One partial fix to this issue is using price indices for different types of houses (i.e., luxury vs. mass segment houses). We also apply the bubble detection tests to these disaggregated price data, however, we do not have access to rents discriminated in this way for our period of study.
9 In this definition, constant prices correspond to house values with constant purchasing power. Therefore, house-price segments are defined by their relative behavior with respect to the consumer price index.
10 The average share of low, medium and high-value houses in the total index is 19%, 25% and 56%, respectively.
11 We computed our own critical values for our tests using Montecarlo simulation methods given our sample and window sizes.
12 Previous methodologies emphasize only on positive bubbles. However, negative bubbles are also possible, corresponding to explosive reductions in asset prices that cannot be explained by fundamentals.
13 These results also hold true for minimum window sizes between 12 and 24 months.
References
1. ARSHANAPALLI, B., AND NELSON, W. (2008). "A co-integration test to verify the housing bubble", The International Journal of Business and Finance Research, 2(2):35-43. [ Links ]
2. BLANCHARD, O., AND WATSON, M. (1982). Bubbles, rational expectations and financial markets (Working Paper 945). NBER. [ Links ]
3. BRUNNERMEIER, M. (2008). "Bubbles", The New Palgrave Dictionary of Economics. Palgrave MacMillan: London. [ Links ]
4. CAMPBELL, J., AND SHILLER, R. (1987). "Co-integration and tests of present value models", Journal of Political Economy, 95:1062-1088. [ Links ]
5. CLAVIJO, S., JANNA, M., AND MUÑOZ, S. (2005). The housing market in colombia: Socioeconomic and financial determinants (Working Paper 522). Inter-American Development Bank, Research Department. [ Links ]
6. CLAVIJO, S., VERA, A., AND ORDÓÑEZ, L. (2014). "¿Burbuja hipotecaria en Colombia? Evaluación de sus indicadores de largo plazo, entre 2011-2014", Revista Carta Financiera, 165:12-16. [ Links ]
7. COCHRANE, J. (2005). Asset pricing. Princeton, New Jersey: Princeton University Press, Revised Edition. [ Links ]
8. CUBEDDU, L., TOVAR, C., AND TSOUNTA, E. (2012). Latin America: Vulnerabilities under costruction? (Working Paper 12/193). IMF. [ Links ]
9. DIBA, B., AND GROSSMAN, H. (1988). "Explosive rational bubbles in stock prices", American Economic Review, 78:520-530. [ Links ]
10. DRAKE, L. (1993). "Modelling UK house prices using co-integration: An application of the Johansen technique", Applied Economics, 25:1225-1228. [ Links ]
11. EVANS, G. (1991). "Pitfalls in testing for explosive bubbles in asset prices", American Economic Review, 81:922-930. [ Links ]
12. HERNÁNDEZ, G., AND PIRAQUIVE, G. (2014). Evolución de los precios de la vivienda en Colombia (Archivos de Economía 407). Departamento Nacional de Planeación, Colombia. [ Links ]
13. LEVY-YEYATI, E., STURZENEGGER, F., AND GLUZMANN, P. A. (2013). "Fear of appreciation", Journal of Development Economics, 101:233-247. [ Links ]
14. MORALES, C. (2014). Effects of migrations on housing prices in Colombia, 1997-2013. Thesis, Department of Economics, Universidad de los Andes. [ Links ]
15. PHILLIPS, P. C. B., WU, Y., AND YU, J. (2011). "Explosive behavior in the 1990s Nasdaq: When did exuberance escalate asset values?", International Economic Review, 52:201-226. [ Links ]
16. PHILLIPS, P. C. B., SHI, S., AND YU, J. (2012). Testing for multiple bubbles (Discussion Paper 1843). Cowles Foundation. [ Links ]
17. POTERBA, J. (1992). "Taxation and housing: Old questions, new answers", American Economic Review, 82(2):237-242. [ Links ]
18. SALAZAR, N., STEINER, R., BECERRA, A., AND RAMÍREZ, J. (2013). "Los efectos del precio del suelo sobre el precio de la vivienda para Colombia", Ensayos sobre Política Económica, forthcoming. [ Links ]
19. SHILLER, R. (1981). "Do stock prices move too much to be justified by subsequent changes in dividends?", American Economic Review, 71:421-436. [ Links ]
20. WEST, K. (1987). "A specification test for speculative bubbles", The Quarterly Journal of Economics, 102:553-580. [ Links ]
21. YIU, M., YU, J., AND JIN, L. (2013). "Detecting bubbles in Hong Kong residential property market", Journal of Asian Economics, 28(C):115-124. [ Links ]


