Introduction
Lead (Pb) is a natural element of the Earth's crust present in the air, water, and soil. Due to its unique characteristics, humans have used lead in different manufactured products that have become its main anthropogenic sources, such as leaded gasoline, paints, ceramics, solders, water tanks, hair dye, cosmetics, airplanes, agricultural machinery, armour for X-ray machines, etc. (Boskabady et al., 2018). However, lead is also an environmental pollutant and a non-biodegradable toxic metal, with well-known toxic effects (Poma, 2008). Therefore, it poses a risk to public health and, as a result, the world health organization, as well as other international organizations, has established a Pb(II) limit for drinking water of 0,01 mg Pb(II)/L (Uddin, 2017).
To stop releasing of Pb(II) into the environment and improve public health, it is necessary to remove Pb(II) from industrial wastewater. It is common today to use a large number of techniques for this purpose, including ion exchange, reverse osmosis, precipitation, and adsorption (Carolin, Kumar, Saravanan, Joshiba, and Nau-shad, 2017). Adsorption is an efficient separation technique that has been in use for a long time to remove heavy metal ions. In aqueous solutions, a wide variety of solid adsorbents have been reported, such as natural zeolites (Belova, 2019), bentonite (Ramola, Belwal, Li, Wang, and Zhou, 2020), cassava peel (Albis, 2016), activated carbon (Zafarzadeh, Sadeghi, Golbini-Mofrad, and Beirami, 2018), carbon nanotubes (Wang, Zhou, Peng, Yu, and Yang, 2007) or clay monoliths (Ahrouch, Gatica, Draoui, Bellido, and Vidal, 2019), among others.
Zeolites are crystalline solids with pores of molecular dimensions that allow the passage of molecules below a certain size depending on the porous system of the material. Zeolites contain mainly silicon, aluminium, oxygen, and some metals, including titanium, tin, zinc, and others. They have applications in adsorption, catalysis, ion exchange, and biological processes (Montalvo, Huiliñir, Borja, Sánchez, and Hermann, 2020).
Clays have been used as a source of silicon and aluminium in zeolite synthesis (Ayele, Pérez-Pariente, Chebude, and Díaz, 2016; Luo, Lau, Wu, Zhu, and Yang, 2018), since they are abundant and cheap materials in many countries, as is the case of Ecuador. Clays are very abundant silicoaluminates worldwide. They are used mainly for to manufacture construction materials such as bricks and tiles, as well as in the ceramic sector (Wi, Yang, Park, Chang, and Kim, 2020; Moussi et al., 2020).
Synthetic zeolites with a faujasite structure (FAU) have been effective for the removal of Pb(II) in wastewater (Pandey, Sharma, and Sambi, 2015; Shariatinia and Bagherpour, 2018). In light of the above, this research aims to synthesize zeolite from Ecuadorian clay and evaluate its potential as an adsorbent for the removal of Pb(II). In this work, faujasite type X zeolite was synthesized from clay from southern Ecuador, and cylindrical extrudates were prepared to evaluate its performance as an adsorbent in the removal of Pb(II) using an aqueous solution prepared in the laboratory. It was compared the behaviour of extrudates prepared with clay and those prepared with zeolite-clay mixtures.
Methods and materials
Materials and reagents
The starting clay, collected in the province of Loja, Ecuador, was named PACL-029. This clay, available in lumps of relatively large size, was oven-dried at 90 °C overnight, then crushed and sieved to a No. 200 ASTM mesh (0,075 mm) (Gilson Co., n.d).
The following reagents were used:
Zeolite synthesis
In summary, the synthesis conditions were set based on previous work on zeolite synthesis from aluminosilicate gels (García, López, García, Casanova, and Goldwasser, 2016). The composition set for the synthesis mixture was

 . Since the employed clay has a
 ratio equal to eight, it was necessary to add sodium aluminate as an additional aluminium source to decrease the molar
 ratio to four.
The detailed process consisted of the following steps:
(i) Mixing 30 g of clay with 35 g of NaOH dissolved in 50 ml of water to form a homogeneous mud;
(ii) calcinating the clay-NaOH mud at 800 °C for 4 h;
(iii) triturating the calcined product and mixing with a solution prepared by dissolving 15 g of sodium aluminate in 390 ml of water and stirring the mixture at room temperature for 1 h to homogenize;
(iv) keeping the mixture at room temperature for 24 h (aging);
(v) a hydrothermal treatment of the mixture in covered and heated containers at 90 °C for 24 h;
(vi) separating the solid product by filtration, washing with water to remove excess alkali, and drying at 90 °C overnight; and
(vii) packaging the solid for subsequent characterization (the zeolitic product obtained with this procedure is the sodic form).
Preparation of adsorbents
For the evaluation of the solids as adsorbents, cylindrical extrudates with approximate dimensions of 0,5 cm in length and 0,25 cm in diameter were prepared. The preparation of these solids consisted of the following stages:
(i) mixing of the solid materials in zeolite (clay ratio 40:60) adding water (approximately 35%) to form a mixture with good plasticity;
(ii) extruding the mixture using a syringe with a 2,5 mm diameter plunger (the mixture is expelled at a constant speed, thus achieving extrudate threads with a diameter equal to the opening of the syringe);
(iii) drying the extrudates at 90 °C for 12 h;
(iv) Calcining in a muffle furnace with the following heating program: from room temperature to 100 °C at a rate of 2 °C/min, maintaining this temperature for 40 min, and increasing to 550 °C at a rate of 3 °C/min, leaving 550 °C for 8 h.
Characterization of solids
X-Ray diffraction measurements of the clay, synthesized zeolite, and the extrudates were performed on a Bruker model D8 Advanced, equipped with a solid-state LynxEye detector, using Cu Kα radiation (λ = 1,5406 Å), operated at 40 kV and 25 mA, with a step width of 0,02044 in a 2θ range of 4,0-60,0°. The chemical composition was determined through X-Ray Fluorescence (XRF) in a portable Bruker model S1-turboSD, using the Mining Light Elements measurement method.
The determination of the specific surface area of the solids (m2/g) was carried out in the ChemiSorb 2720 equipment from Micromeritics, by adsorption of nitrogen at the temperature of liquid nitrogen (-196 °C) with a 30% gas mixture of diluted N2 in He. The ChemisoftTPxV1.03 software allows calculating the specific surface area by applying the BET equation and the single point method (Webb, Orr, Camp, Olivier, and Yunes, 1997). The scanning electron microscopy (SEM) micrographs were taken on a Hitachi S-500 at 20 keV and 50 mA.
Pb(ll) removal studies
Effect of pH: With the extrudates prepared with clay and extrudates prepared with zeolite-clay, an experiment was carried out consisting of contacting 25 mg of adsorbent with 25 mL (1g of solid per liter of solution) of 80 mg Pb(II)/L solution at 30 °C for 24 h and 100 rpm. The pH was adjusted to 4,03, 4,97, 6,06 and, 6,99 with 0,1 M HCl or NaOH solutions. The pH interval was chosen based on Pandey's work (Pandey et al., 2015).
Adsorption equilibrium studies: For this study, Pb(II) solutions of 20, 40, 60, 80,110,140,180, and 240 mg/L were used. The solution was maintained at pH = 5 based on the results obtained from the studied pH interval. The extrudates and an amount of Pb(II) solution, with a ratio of 1 g of solid per liter ofsolution, were placed in an Erlenmeyer flask of100 mL. The above recipients were placed in an orbital agitator (Thermo Scientific SHKA2000) at 30 °Cfor 24 h and 100 rpm.
Adsorption isotherm: The adsorption capacity of solids can be determined by analyzing the equilibrium data through isotherm models. An equilibrium isotherm relates the amount adsorbed and the concentration remaining in the solution in equilibrium. The Langmuir, Freundlich, and Temkin isotherm models were applied in this research (Bhatt et al., 2012).
The Langmuir isotherm assumes a surface with homogeneous adsorption sites, without interactions between adsorbed species. Equation (1) represents the linear form of this isotherm (Bhatt et al., 2012):
where
Q e =equilibrium adsorption capacity, mgPb(II)/gofadsorbent
Q m = maximum adsorption capacity, mg Pb(II)/g ofadsorbent
C e = equilibrium concentration, mg Pb(II)/g of adsorbent
K L = Langmuir adsorption constant, L/mg Pb(II)
Plotting
 against C
e
obtains a straight line with slope and intercept of
 and
and
 respectively. K
L
is a tool to the calculation of the dimensionless equilibrium parameter (R
L
) calculated using Equation (2) (Bhatt et al., 2012).
where
C0 = initial concentration, mg Pb(II)/g of adsorbent
The Freundlich isotherm is an empirical model that describes monolayer and multilayer adsorption, expressed mathematically as Equation (3) (Bhatt et al., 2012).
K
f
and n are Freundlich constants incorporating the factors affecting the adsorption capacity and adsorption intensity, respectively. Plotting log Q
e
vs. log Ce results in a linear graph with slope n and intercept log K
f
, from which
 and K
f
can be calculated.
The Temkin isotherm model assumes that the adsorption heat decreases linearly with the increase in coverage of the adsorbent surface and a uniform distribution of binding energies up to a maximum binding energy. Equation (4) describes the Temkin isotherm (Inyibor, Adekola and Olatunyi, 2016):
B is a constant related to the heat of adsorption, and A is the Temkin isotherm constant (L/g). From the plot of Q e vs ln C e , B and A can be calculated from the slope (B) and intercept (B ln A) (Inyibor, Adekolaand Olatunyi, 2016).
In all cases, the equilibrium adsorption capacity, Q e , was determined through Equation (5) (Bhatt et al., 2012).
 is the relationship between the Volume of solution in L (V) and mass of solid in g (m) used in the experiment. In all experiments, the
 ratio was the unity.
Adsorption kinetics studies: A plot of sorption vs. time usually indicates the adsorption kinetics. For kinetics experiments, the (
 ) ratio was kept equal to unity: 500 mg of solid in 500 mL of 80 mg Pb(II)/L solution at 100 rpm and 30 °C. The sampling was performed in triplicate from time zero to 180 minutes, taking the average value in each measurement. The adsorption capacity of the solid (q), expressed as mg of Pb(II)/g, was determined through Equation (6) (Tan and Hamed, 2017):
where q is the adsorption capacity of the solid for any time t, expressed as mg Pb(II)/g extrudate; C0 and C, represents the metal concentration initial and at time t, respectively. In all of the above experiments, the Pb content in the solutions was determined on a Perkin Elmer Analyst 400 atomic absorption spectrometer.
Adsorption kinetics were investigated using pseudo first order (PFO), pseudo second order (PSO), and Elovich models. The diffusion mechanism was studied applying the Bangham-Burt and Webber-Morris intra-particle diffusion models (Tan and Hamed, 2017).
The pseudo first order (PFO) model has the linear form given in Equation (7) (Tan and Hamed, 2017).
where qe is the equilibrium adsorption capacity (mg/g) at time t (the process time), k1 is the pseudo first order rate constant which is calculated from the slope of the plot of ln (qe - q) vs. time.
The PSO model assumes that the sorption rate is of the second order with respect to accessible active sites. Equation (8) shows the linear form of this model, where k2 is the rate constant. A plot of q vs.
 produces a straight line for conforming kinetics. The values of k2 and qe are obtained from the slope and the intercept (Tan and Hamed, 2017).
The linear form of the Elovich model is presented in Equation (9), where α is the initial adsorption rate (mg/g.min) and β is the desorption constant associated with surface coverage. Kinetic data obeying this model would produce a straight line from the plot of q vs. ln t. The slope and intercept are equal
 , respectively (Tan and Hamed, 2017).
Bangham's model is usually applied to verify if pore diffusion is the only rate-controlling mechanism during an adsorptive process. It is generally used in the following form (Equation 10) (Tan and Hamed, 2017):
where V is the volume of the solution (mL),
 is the amount of extrudate per volume of solution in g/L, and k0 and α are constants. In order to check the Bangham-Burt model, a plot of
 . logt should produce a straight line.
The Webber-Morris model (Equation 11), is also used to describe adsorption kinetics controlled by intra-particle diffusion (Equation 11), (Tan and Hamed, 2017).
where k
id is the intra-particle diffusion rate constant
 , while B is the initial adsorption capacity (mg/g). To validate the Webber-Morris model, a plot of q vs.
 should be linear with k
id and B obtained as the slope and intercept, respectively.
Results and discussion
Characterization of clay and synthesized zeolite
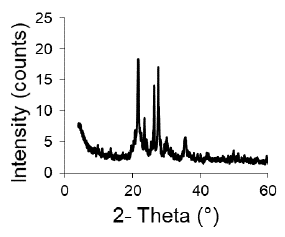
The XRD pattern of the original clay (Figure 1) indicates the presence of these phases: heulandite (9,80 and 11,11° 2 θ), cristobalite (22 and 36° 2 θ), quartz (26,6° 2 θ), and anorthite (28° 2θ). The XRD lines of the clay have a low intensity, indicating a low proportion of the identified clay minerals. For the synthesis, the alkaline fusion method recommended by various authors was used to obtain zeolites from clays, porcelain, and ashes (Ayele et al., 2016; Bai, Zha, Chang, Zhang, and Chu, 2018; Kongnoo, Tontisirin, Worathanakul, and Phalakornkule, 2017; Ke, Shen, and Yang, 2019; Boycheva, 2020; Wajimaand Ikegami, 2009). It was possible to zeolitize the clay through the applied method, since the synthesis product has the characteristic XRD pattern of the Faujasite structure (Figure 2), without the presence of lines corresponding to other crystalline phases (Treacy and Higgins, 2001). However, it cannot rule out the presence of amorphous phases not detectable by XRD.
The cell parameter α0(Å) of the synthesized zeolite was determined from the XRD pattern of the solid (Figure 2) according to the equation of the cubic crystalline system of the FAU structure. This parameter was calculated for each of the XRD lines at positions 15,44, 23,35, 26,70, and 30,92 position 2θ, Cu, taking the average value of the determinations. The number of structural Al atoms in the zeolite was determined using the Breck-Flanigen equation (Giannetto, Montes, and Rodriguez, 2000), and the structural Si/Al ratio of the synthesized zeolite was calculated with this value. The calculated value for αo was 24,99 Å with
 (Table 1). These values classify the synthesized zeolite as type X Faujasite (FAU). Therefore, the nomenclature used for this zeolite was FAU-Na.
Figure 3 shows a SEM micrograph of the synthesized FAUNa zeolite. The sample showed the typical morphology of octahedral crystalline aggregates, whose size aggregates can be lower than 1 m.
Table 1 shows the values of mass percentage of SiO2 and Al2O3, the molar (
 ) ratio, and values of specific surface area(SSA) of the synthesized zeolite and clay. The synthesized zeolite has a SSA value 30 times higher than that of clay, due to the structural difference between the two solids. The dense phases that constitute the clay as cristobalite, quartz, and anorthite have low SSA values (about 3 m2/g) (Bustillo, Fort, and Bustillo, 1993), whereas the synthetic Faujasite zeolite can have SSA values of up to 700 m2/g (Garcia et al 2016).
The chemical composition also changes with respect to the clay; the molar
 ratio in the zeolite is lower because it was changed in the synthesis mixture by the addition of the aluminium source. The determined value of the ratio
 in the zeolite was lower than that used in the synthesis mixture, which suggests that soluble silicate species formed during the alkaline fusion process remain in the synthesis mother liquor. On the other hand, the molar ratio
 indicated the difference between global molar and structural molar ratio; the first includes all present phases and the second refers only to zeolitic structure.
Characterization of the prepared extrudates (solid adsorbents)
Despite the great industrial importance of producing structured adsorbents and catalysts from powders, few articles directly address structuring. Traditionally, the structuring of catalysts and adsorbents has been developed by companies and maintained as an internal know-how only disclosed in patents (Akthar, Anderson, Ogunwumi, Hedin, and Bergstrom, 2014).
Single-component clay extrudates and clay-zeolite extrudates were prepared with the synthesized zeolite. Table 2 shows the obtained SSA values. It is worth noting that the extrudates kept their shape after the adsorption experiments.
The XRD pattern of the extrudates prepared from the PACL-029 clay (Figure 4) is very similar to that of the original clay; only the lines under the 20 angle are lost. In the XRD pattern of the clay-FAU-Na extrudates, the characteristic lines of the FAU structure are present with a high intensity (Figure 5), indicating that the structure is preserved. They also have all the DRX lines of the clay-only extrudates. The SSA of the clay extrudates is very similar to the area of the original clay, indicating that the calcination treatment does not appreciably modify the structure of the solid. However, the slight difference in SSA values can attributed to the lack of heulandite phase in the calcined clay, as indicated the XRD pattern in Figure 4. The zeolite-clay extrudates reported a higher SSA value due to the contribution of the 40% of zeolite.
Adsorption studies
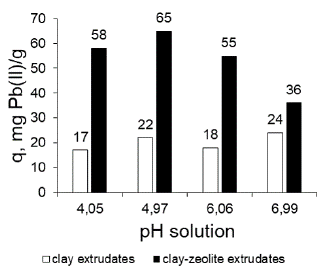
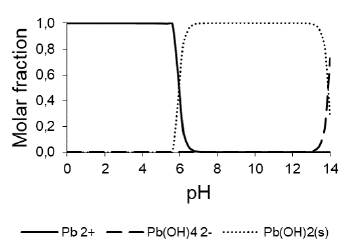
Effect of pH on Pb(II) adsorption: With the combined adsorbent zeolite FAU Na-clay PACL-029, the maximum adsorption capacity is obtained at pH 4,97 (Figure 6), in accordance with what was reported by other authors (Pandey et al., 2015; Bai, Wang, and Zhu, 2020; Alsuhybani, Alshahrani, Algamdi, Al-Kahtani, and Alqadami, 2020; Yuan, Xie, Yan, Chen, and Wang, 2018). Figure 7, made with the chemical-equilibrium-diagram tool (Puigdomenech and Of, 2010), illustrates Pb(II) distribution vs pH. The Pb species present vary according to the pH of the solution. Considering only the influence of pH, Pb(II) dominates at low pH, whereas, at neutral-alkaline pH, the precipitation of Pb(OH)2 is dominant. Pb is amphoteric and, under extreme alkaline conditions (pH > 12), the negatively charged ion Pb(OH)-2 4 is dominant (Jensen, Ottosen, and Pedersen, 2006).
Source: Authors
Figure 6 Variation of the adsorption capacity of Pb(II) with changes in pH of the solution.
Source: Authors
Figure 7 Predominance diagram Pb(II) in solution as a function of pH. Total concentration Pb(II) 80mg/L.
Pandey et al. (2015) found that the removal of Pb(II) increased with increasing pH and recorded its minimum values at 4,0. The above behaviour was explained with the following argument: at lower pH values, the H+ ions compete with the metal cation for the adsorption sites on the adsorbent, which in turn leads to partial release of the metal cation. At a higher pH level, the concentration of the H+ ions as competing ion decreases, thus resulting in an increase in the amount of removed metal. Additionally, in the zeolite-containing adsorbent, the removal of Pb(II) can be carried out by adsorption and by ion exchange with the exchangeable cations of the zeolite. For a pH close to 5, it is likely that the concentration of interchangeable cations with Pb(II) such as H+ and Na+ is adequate to increase the adsorption capacity of the solid. With the PACL-029 adsorbent clay, little variation of the adsorption capacity of Pb(II) was obtained in the studied pH interval. In clay, the removal of Pb(II) could occur mainly by adsorption.
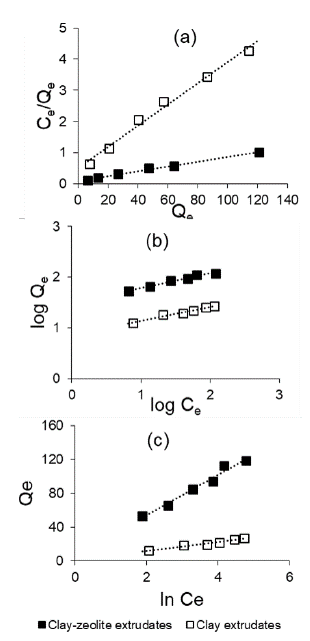
Equilibrium isotherm studies: The parameters obtained from isotherm model plots at 30 °C are tabulated in Table 3. Figure 8 shows plots of the linear form of the Langmuir, Freundlich and Temkin isotherm models.
Source: Authors
Figure 8 Representation of the isotherm linear forms for the extrudates: (a) Langmuir, (b) Freundlich, (c) Temkin.
The best fit was obtained with the Langmuir model. For the determination of the constants of the Langmuir equation, the linear form of the Langmuir model, Equation (1) was employed obtaining acceptable adjustments (Figure 8a). The Langmuir model served to estimate the maximum metal uptake values where they could not be reached by the experiments. The separation factor (RL) values, calculated through the Langmuir isotherm model for C0 = 80 mg/L (Table 3), indicate that the adsorption is favourable for both adsorbents. The KL values are comparable, but the maximum adsorption capacity Qm according to the Langmuir equation is 4 times higher in the combined clay-zeolite extrudate. The representation of the linear Langmuir model in Figure 8a indicates a clear difference between the clay extrudates and the clay-zeolite combination. The zeolitization process remarkably improves the adsorption properties for Pb(II). Clay-zeolite extrudates have a higher adsorption capacity, which may be due to the higher specific surface area value of the extrudates, as well as to a difference in surface composition.
The parameters estimated from the Freundlich plot (Figure 8b) are presented in Table 3. The nature of the adsorptive process can be determined by the value of n (the process is linear if n = 1, chemical if n < 1, and physical and favorable if n > 1). The values of n are > 1, which indicates a favorable physisorption condition (Ohale, Onu, Ohale, N., and Oba, 2020).
The parameter B in the Temkin isotherm (Equation 4) is equal to
 , where R is the universal gas constant (J/mol K), T is the absolute temperature (K), and b
T
(J/mol) is a factor that an indicates the adsorbent-adsorbate interaction (Ohale etal., 2020). Then from B, the parameter bT was determined, obtaining the following values: bT
clay extrudate = 487 J/mol, and b
T
clay - zeolite extrudate = 105 J/mol. These indicate a high interaction between adsorbent and the adsorbate, in disagreement with postulates from the Langmuir and Freundlich isotherm models. This model is probably not applicable in the present study. It is worth noting that the fit of the data is not very good.
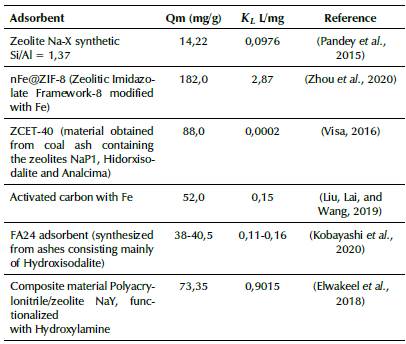
The data from the isotherms, adjusted according to the Langmuir model, indicate that the developed adsorbents are suitable for the adsorption of Pb(II). The maximum adsorption capacity values shown in Table 3 are comparable and even higher than other adsorbents reported in the literature. In Table 4, the maximum adsorption capacity and the adsorption constant according to the Langmuir model are compared for various solid adsorbents reported in previous works.
Table 4 Comparison of the Qm adsorption capacity and k l adsorption constant of the Langmuir model with different solid adsorbents
Source: Authors
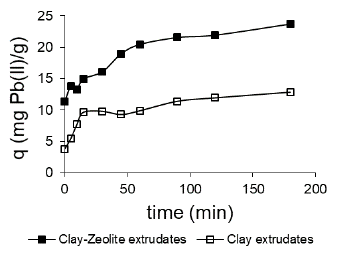
Adsorption kinetics studies: The kinetic behaviour is an important aspect to study the adsorption process of heavy metal ions in the solid adsorbent. The adsorption capacity q t for each contact time represented in Figure 9 indicates that the combined adsorbent of the synthesized clay and FAU-Na zeolite has the highest Pb removal capacity.
Source: Authors
Figure 9 Adsorption capacity as a function of contact time for the two prepared adsorbents.
The complete course of adsorption includes mass transfer and comprises three steps: (i) film diffusion (external diffusion), which is the transport of adsorptive from the bulk phase to the external surface of the adsorbent; (ii) pore diffusion (intra-particle diffusion), which is the transport of adsorptive from the external surface into the pores; and (iii) surface reaction, which is the attachment of adsorptive to the internal surface of sorbent (Tan and Hameed, 2017).
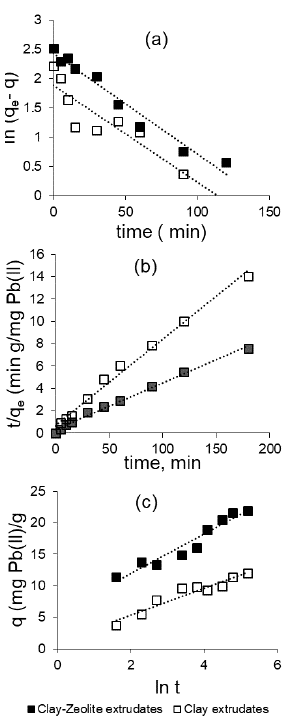
The surface reaction kinetics were studied with the pseudo first order, pseudo second order, and Elovich models stated in Equations (7), (8), and (9), respectively. Table 5 shows the parameters estimated from the plots of these models as described earlier in Experimentation section.
The graphs corresponding to the linear Equations (7), (8), and (9) are shown in Figure 10. The best fit was obtained by the second-order model. The q e values obtained from pseudofirst order and Elovich models were different from the actual qe values obtained experimentally (Table 5). This suggests that these models were unsuitable to describe the adsorptive rate processes. However, q e values of the pseudo second order model showed good agreement with experimental qe values. The evaluated regression coefficients were satisfactorily high (R2 ~ 0,99) for the PSO model than for other sorption models.
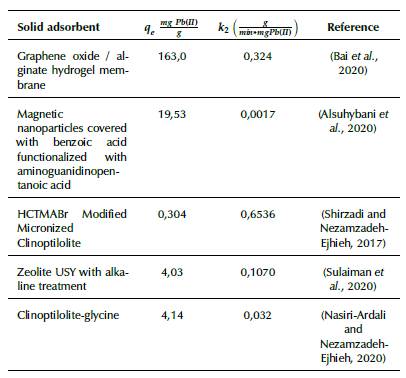
The values of the adsorption rate constant (k2) are of the same order in the clay extrudates and in the combined extrudate, and the latter has twice the adsorption capacity. The pseudo second order kinetic model has been reported in several investigations on Pb(II) removal in aqueous systems. Table 6 shows the kinetic parameter values reported in other investigations. Like the data indicated by the adjustment with the Langmuir isotherm model, these data indicate that the two prepared adsorbents are suitable for the Pb(II) removal.
Table 6 Comparison of the kinetic parameters of the pseudo second order model reported in previous investigations
Source: Authors
To determine whether pore diffusion was the only rate-limiting step in the adsorptive study of this system, experimentally obtained kinetic data was fitted to the Bangham-Burt model stated in Equation (10). The linear plot presented in Figure 11b and the corresponding R2 values given in Table 7 suggest that pore and film diffusion influenced the kinetic mechanism.
Source: Authors
Figure 10 Kinetic plots for (a) Pseudo first order model, (b) Pseudo second order model and (c) Elovich model.
The Webber-Morris intraparticle diffusion model (Equation 11) was used to examine the contributions of each diffusion step in the overall mass transfer mechanism: external and intra-particle (Robati, 2013; Chu et al., 2019). Results of model plot are presented in Figure 11a. This Figure shows two linear segments, which implies that adsorptive mass transfer took place under two steps. The first segment signifies an external surface adsorption associated with liquid film diffusion, while the second segment depicts an adsorption controlled by intra-particle diffusion. The intra-particle diffusion rate constant (kid1 and kid2) estimated from both segments is presented in Table 7.
Conclusions
Zeolite X with Si/Al = 1,08 ratio was synthesized from clay, using synthesis mixture compositions employed in synthesis from aluminosilicate gels. The characterization carried out indicated adequate properties in the synthesized zeolite, such as purity, crystallinity, and specific area. The zeolite in the extrudate maintains the crystalline structure and increases the specific surface area 10 times compared to the clay-only material, notably improving the adsorption capacity of Pb(II), which is favoured at pH = 5. The adsorption equilibrium isotherm (at 30 °C) was adjusted applying the Langmuir model, with a separation factor R L indicating favorable adsorption. The maximum adsorption capacity Q m was 132 mg Pb(II)/g, a comparable value and even higher than reported values for a variety of solid adsorbents. The adsorption kinetics were adjusted to the pseudo second order model with chemical adsorption controlling the process. The value of the kinetic constant is of the same order in the evaluated materials. However, in the combined material, the adsorption capacity q e is almost double. The liquid film diffusion and intra-particle diffusion influence the kinetic mechanism.


