Introduction
Cavitation is the physical phenomenon that occurs in a fluid when vapor cavities are formed due to a pressure drop, which can be generated by a sudden decrease in the flow cross-sectional area. When designing an experiment that involves cavitation, parameters such as velocity, temperature, and the geometry through which the fluid passes must be considered (Barona-Mejía et al., 2021 ; Sarc et al., 2017).
Mathematical models can simulate cavitation by describing the phase change and behavior of the bubble. One of the most commonly used models is the Singhal method, also known as the full cavitation model, since it describes the formation and transport of the bubble, the turbulent fluctuations, and the magnitude of non-condensable gases (Singhal et al., 2002). Another widely known model is the Schnerr-Sauer method, which is a combination of the VOF (Volume of Fluid) technique and a prediction of bubble growth and collapse (Sauer and Schnerr, 2000).
One of the parameters that affects cavitation is temperature, which has been studied in different ways, be it to determine erosion in solids (Dular, 2015) or to study bubble dynamics (Petkovšek and Dular, 2013). Moreover, the thermal effect has been studied in hydrodynamic cavitation reactors used for water cleaning (Ge et al., 2022; Sun et al., 2018). Another parameter is the geometry through which the fluid passes, among which Venturi tubes are the most common (Shi et al., 2019). Given its basic configuration, this geometry has been used to test different turbulence models (Nouri et al., 2010) or to compare experimental and computational data (Cappa et al., 2014).
Additionally, during the hydrodynamic cavitation process for oil upgrading, a hydrogen donor such as gasoline (Yang et al., 2013) needs to be added in order to avoid the reorganization of the free radicals in heavier molecules during the implosion of bubbles, thus preventing the crude from becoming even more viscous (Askarian et al., 2017).
The oil and gas sector has different applications for the use of cavitation within crude refining processes, e.g., enhanced recovery, de-metallization, viscosity reduction, desulfurization, and upgrading (Avvaru et al., 2018). In terms of upgrading, hydrodynamic and acoustic cavitation are the most attractive from an industrial point of view (Montes et al., 2018; Olaya-Escobar et al., 2020; Sawarkar, 2019). Consequently, projects have focused on making this process profitable. However, a number of design parameters must be considered, which means that further research is needed (Gogate and Pandit, 2000). In this sense, several works have shown that vortex reactors using hydrodynamic cavitation are more energy-efficient for oil upgrading in comparison with thermal cracking and acoustic cavitation (Quan et al., 2011; Sawarkar, 2019; Senthil Kumar et al., 2000).
The purpose of this study is to evaluate the effect of temperature on a vortex reactor for hydrodynamic cavitation. The fluid of study is heavy crude oil, and the evaluation is carried out experimentally and numerically by using Ansys Fluent.
Materials and methods
The methodology was divided into two parts: the first one consists of the experimentation process in the vortex reactor; and the second one is the computational fluid dynamics analysis performed in the Ansys Fluent software.
Experimental design
The effect of temperature was determined via a two-factor, three-level experimental design. The factors evaluated were the temperature and the percentage of injected hydrogen donor, and the response variable was the final viscosity when the crude had already undergone the hydrodynamic cavitation process. All tests were performed with a crude flow rate of 12 GPM.
The data employed are shown in Table. 1. The initial viscosity was measured before the oil was introduced into the vortex reactor. The initial viscosity was not measured in the presence of hydrogen. Overall, there was a decrease in viscosity as the temperature increased. However, it was much lower when compared to that generated by an increase in the percentage of the injected hydrogen donor. A statistical analysis was conducted in the Minitab software for a detailed assessment of the effect of each factor.
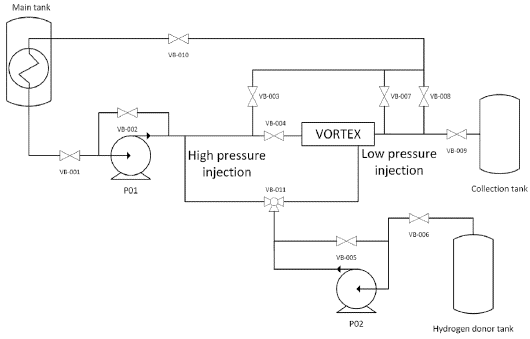
The tests were run in the vortex reactor owned by the Energy Rap Vortex Services company (Quiroga et al., 2021). shows the complete system that made the reactor functional. It is composed of the pumping subsystem; the piping subsystem; the storage subsystem, which can elevate the oil temperature to 180 °F; the control subsystem; and the vortex reactor. The hydrogen donor can be injected into the oil with high or low pressure. In this case, the latter was employed. Note that the phenomena of mixing and vapor generation were not studied independently. It was assumed that these two conditions affect the performance of the vortex reactor (Quiroga et al., 2021).
Cavitation model
Modeling cavitation in the vortex reactor allowed studying the fluid-dynamic behavior of the oil. The parameter of interest in the numerical model was vapor generation, which is a consequence of the cavitation process.
The selection of numerical models was carried out by reviewing the works of several authors (Moll et al., 2011, 2012; Salvador and Frankel, 2004; Darbandi and Sadeghi, 2009), who simulated the behavior of a cavitating fluid in injectors. This research is based on a widely recognized experimental study in this field (Nurick, 1976).
The turbulence model used was the K-Epsilon Realizable with Standard Wall Functions because the viscous effects near the wall were not relevant. As there is cavitation, there is a two-phase flow. For this reason, a mixture model was chosen in conjunction with the Schnerr-Sauer method in order to model the formation of bubbles. Since the behavior and evolution of bubbles is not a concern in this project, the model was run in a steady state.
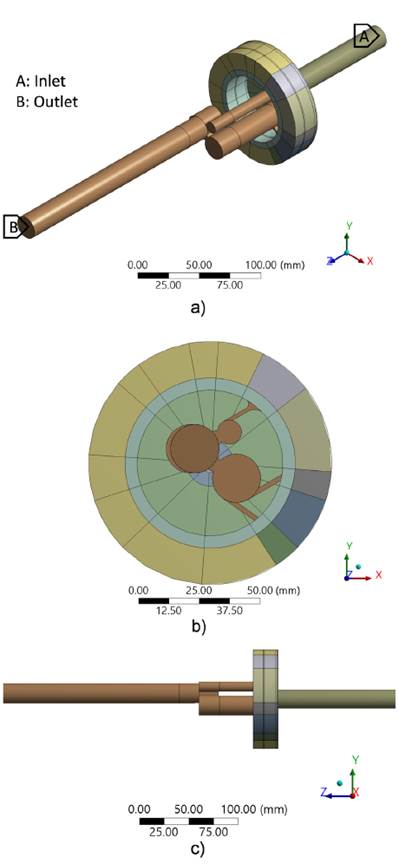
The geometry used corresponds to the volume of fluid extracted from the vortex reactor, which is shown with the corresponding scale in Figure 2. The inlet and outlet domains for the boundary conditions are indicated in the isometric view in Figure 2a. Detailed geometric dimensions are not provided for patent protection purposes.
Source: Authors
Figure 2 Volume of fluid extracted from the vortex reactor: a) isometric view with inlet and outlet domains, b) front view, c) side view
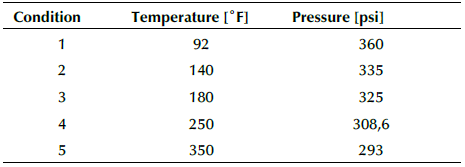
The values established as boundary conditions for each numerical model are shown in Figure 2a, where the first three were taken from the experimental stage. Furthermore, two models with pressure values corresponding to higher temperatures were added, which were obtained through a mathematical correlation. Finally, the walls were treated with the conditions of non-slip and zero flow.
A mesh independence study was conducted in order to find the appropriate element size. Overall, five meshes were employed which had between 1 179 758 and 8 474 211 elements. Finally, a mesh with 6 764 078 first-order elements was selected. The skewness, orthogonal quality, and aspect ratio were evaluated, and they are shown in Table 3. Note that the quality of the mesh is enough to achieve a good accuracy and avoid high discretization errors.
The numerical results were evaluated using various guidelines related to the validation and verification of computational fluid dynamics simulations (Freitas, 2002). To define the models, prior characterization of the oil in the liquid and vapor phase was necessary. To find the required properties, the Aspen HYSYS software was used in conjunction with the data obtained from the following tests:
ASTM D445 for viscosity (2021)
ASTM D1298 for API gravity (2017)
ASTM D86 for a distillation curve (2020)
PVT analysis
Figure 3 shows the configuration used in Aspen HYSYS. It has an oil stream whose properties were obtained using the previous tests, a control valve to throttle the fluid and generate two phases, and a flash drum to independently obtain the properties of vapor and liquid.
Once the configuration was set, five different conditions were established on the crude stream, which are shown in Table 4. The first three conditions are the values used in the experimental stage, when a 2% hydrogen donor was injected. Additionally, two conditions were added, with higher temperatures to evaluate the behavior of the vapor fraction.
Results
Statistical analysis of experimental data
The data obtained through the experimental design was evaluated using Minitab. The individual effects of each variable on the final viscosity were entered, and a statistical analysis was performed.
The Pareto chart of standardized effects can be seen in Figure 4. When the bar of one of the factors crosses the dotted line with a value of 2,8, it can be considered to be statistically significant. In this case, both the temperature and the injected hydrogen donor crossed it. Nevertheless, the donor did it to a greater extent, which means that it has a greater effect on the final viscosity.
Moreover, the main effects of the levels of each factor on the viscosity can be seen in Figure 5. The temperature showed an almost horizontal line at the different levels, which means that its effect on the final viscosity is low. On the contrary, the hydrogen donor presented inclined lines at its different levels, which suggests that there is a considerable effect on the response variable.
Vapor generated from cavitation
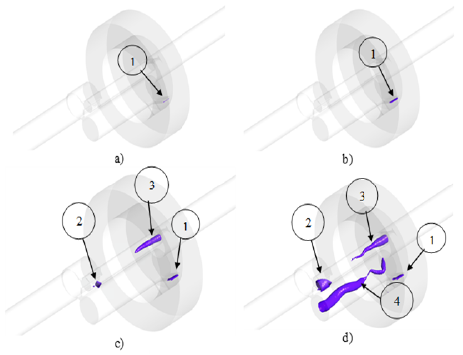
The generated vapor was the variable of interest in the model because, with it, the effect of temperature on cavitation can be observed. Figure 6 shows the vapor fraction isosurfaces at the different analysis temperatures, except for 92 °F, since there was no vapor. Note that there is an increase in vapor generation as the temperature rises. In total, four different zones were found and marked with a number.
Source: Authors
Figure 6 Vapor fraction isosurfaces at 140 °F (a), 180 °F (b), 250 °F (c), and 350 °F (d)
Zone 1 occurs when there is a sudden reduction in the cross-sectional area and an abrupt change in the flow direction. This leads to a separation of the boundary layer from the walls and causes what is known as vena contracta, from which a recirculation zone is formed. Here, the static pressure can be lower than the vapor pressure, thus producing cavitation (Payri et al., 2005). This phenomenon is usually studied in injector nozzles (Sou et al., 2014). Likewise, in zone 2, a similar type of cavitation is generated since the flow is abruptly diverted.
Zones 3 and 4 correspond to cavitation generated by a vortex. Vapor is formed in its center, since there is a zone of low pressure because of the centrifugal force created by the rotation of the fluid. This phenomenon occurs mainly in the suction tubes of Francis turbines (Brennen, 1995).
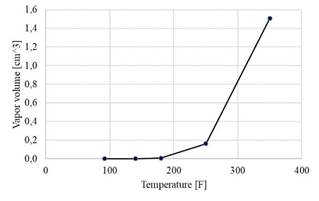
The total vapor volume generated was obtained from the numerical models and was plotted as a function of temperature, as shown in Figure 6. At 92 °F, no vapor has yet formed, and, as the temperature rises, the amount of steam increases exponentially. The maximum value was 1,507 cm3 at 350 °F. By contrasting the graph with the isosurfaces of Figure 7, the increase in vapor volume can be related to the aforementioned zones, thus implying that the vortices contribute the greatest amount.
Conclusions
The experimentally obtained data showed that the increase in the fluid temperature during the tests did not have a considerable effect on the final viscosity of the oil. On the contrary, the increase of the injected hydrogen donor did achieve a high final reduction. This could be verified in the Pareto chart of standardized effects and the slopes of the main effects plot.
The Aspen HYSYS software, along with the ASTM D445, ASTM D1298, and ASTM D86 tests as well as the PVT analysis allowed completely characterizing the oil. The software proved to be a useful tool for obtaining the properties of the oil necessary to develop the numerical model in Fluent.
Using computational fluid dynamics, the behavior of the oil through the vortex reactor at different operating temperatures was modeled. It was found that, in the range from 92 to 180 °F, the vapor volume did not exceed 0,00685 cm3. However, at 350 °F, the vapor volume increased significantly to 1,507 cm3. By observing the isosurfaces, it was found that the sudden increase is due to cavitation in the vortices.
From the data obtained both experimentally and numerically, it is concluded that the temperatures employed in the tests were very low to have an effect on the final viscosity of the oil. Therefore, it is recommended to increase the power in the storage tank's resistance in order to reach higher temperatures. In addition, a feasibility analysis must be conducted since this change represents costs that could not be offset in the reduction of viscosity of the oil.


