1. Introduction
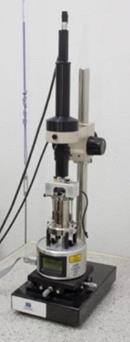
Atomic Force Microscope (AFM) is a mechano-optical instrument capable of detecting forces of the order of nanonewtons. The probe is coupled to a very flexible microscopic bar of only about 200μm Figure 1. The Atomic Force Microscope has been essential in the development of nanotechnology for the characterization and visualization of samples with nanometric dimensions, that is, 10-9 m = 1nm. It is a non-destructive technique of surface measurement based on the interaction of a tip in a pyramidal or conical shape with the surface of the sample that, when traced, is capable of continuously recording the surface. This technique allows the surface analysis of samples with nanometric or even atomic resolution. As a main advantage, it has the possibility of developing measurements without any previous treatment of the sample, and without the need to use vacuum [1,2].
The analysis through this method is characterized by the distribution of amplitudes across an electromagnetic wave phenomenon that is generated, that can be superposition waves of several frequencies. Mathematically, this spectral analysis is related to a tool called a Fourier transform.
The results provide the geometric information from surface images (shape and dimensions) of deposits such as nanoparticles, deposited surface roughness [3,4], Figure 1 shows the operation of the equipment.
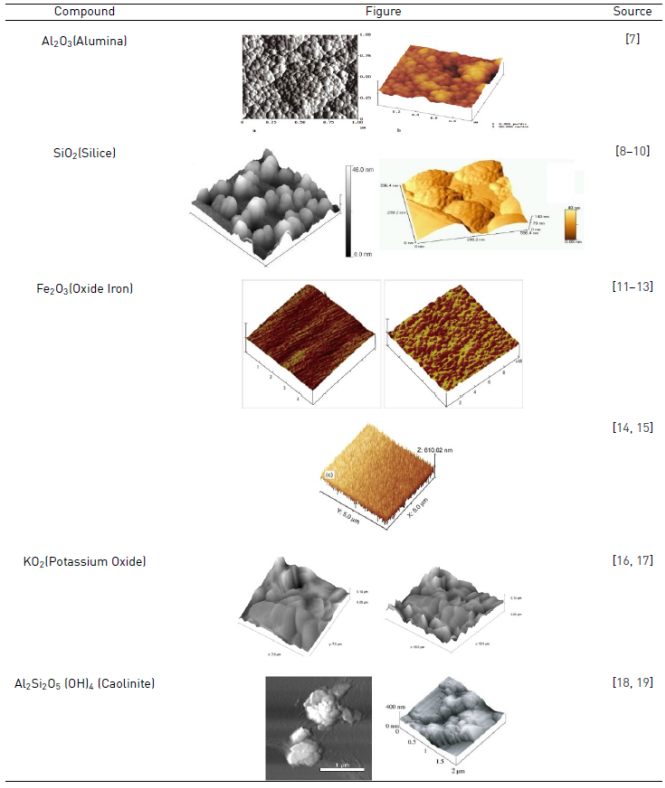
The superficial characteristics of the minerals concentrated in the clay in high percentages are presented in the Table 1, according to investigations carried out by several authors.
The uses of such technique make it possible to obtain information about the shape, morphology and size of the clay particles. There are several studies in the literature that studied the characterization of surfaces in atomic scale through AFM, as river humic substances and minerals such as illite and smectite, kaolinite, gibbsite, montmorillonite and goethite. However, the number of studies aiming to characterize the soil clay fraction minerals using this technique is still very low [20-22].
AFM can be used to measure properties of minerals such as clay and to identify the presence of clay minerals, hydrated aluminosilicates. Using this technique, the first quantitative measurements of the Young's Clay module are presented. For example, the Young's modulus of dickite according to research conducted by Prasad is 6.2 GPa [19].
According to Bastos of Sousa, AFM has been recognized as one of the most powerful tools for analyzing surface morphologies because it creates three-dimensional images on the angstrom and nano scale. This technique has been ideal in the dispersion analysis of nanometric components in nanocomposites and in polymer blends due to the ease of sample preparation and low equipment maintenance cost when compared to scanning electron microscopy [23].
Clay minerals are playing an increasingly important role in nanocomposites for the remarkable property improvements in comparison with the normal microscopic counterparts, such as nanometer thickness, extraordinary high surface area and ease, properties allowing hybridization by polymers or ions to form new composites [24]. However, in the mineralogy properties, lattice defects such as isomorphous substitution present in the clay or nanosheet surface are known to significantly affect clay property. Generally, clay minerals are composed of silica tetrahedron (T) and alumina or magnesia octahedral sheet (O) and form the T-O-T layer structure or the T-O layer structure [25].
Likewise, reliable techniques to measure both particle size and shape distributions are required to gain a better understanding of the impact of particle size and shape, and select the most appropriate pigments for obtaining a coating with specific end-use properties. Moreover, there are several commercial instruments for determining particle size in the near-micron range [26].
In the research carried out by Schoonheydt, they developed an AFM analysis to study clay mineral films and clay-based catalysts based on the mechanical properties and the number of layers formed in each particle, identifying mainly sizes and shapes of the particles with a homogeneous distribution of the surface [27].
Most of the research conducted on this topic describes the contributions that AFM uses, with emphasis on the dispersion of nanofilters in matrix polymers, besides showing the importance of technical analysis for nanocomposites and mixtures of polymers based on elastomers.
The quantitative characterization techniques used for conventional composites include microstructure image analysis from which a number of quantitative measures, whether deterministic or probabilistic, are calculated. Deterministic measures include quantities such as intercept lengths. Therefore, it is possible to modify and update the quantitative characterization techniques used for conventional compounds to extend their use for nanocomposites.
2. Materials and methods
In the present study, it was used the laboratory equipment Veeco Multimode V Model Atomic Force Microscope made in the United States, using the Nanoscope 7.3 Software to analyze and measure the images obtained, in order to study the surfaces or topography of the samples in contact mode with a sharp tip that perceives the force emitted by the surface according to the type of material. This equipment has modules for magnetic tests, in fluids and tunneling at room temperature, in addition to a scanner that can control the temperature of the samples in a range from -35 to 250°C. The obtaining geometric information was derived from topographic images (shape and dimensions) of deposits such as nanoparticles and surface roughness.
This analysis was developed in the laboratories of the National Polytechnic Institute in Mexico, using a mechano-optical instrument capable of detecting forces of the order of nanonewtons, shown in Figure 2.
Five samples of clay of the raw material lot of a company dedicated to the manufacture of masonry products for construction were selected. Also, it is important to mention that the analyses performed are to validate an alternative characterization of ceramic materials and thus predict the behavior in the transformation phases of the material in the production process. In addition, the main objective was to study the presence of aluminosilicates (Al 2 O 3, SiO 2, K 2 O, among others) that are the elements present mostly in this type of materials; approximately 50 images were obtained but the most relevant ones were selected.
The results were validated with X-ray fluorescence analysis, the preparation of the samples for analysis consisted of the crushing according to ASTM C323-56, screening the material for 400 mesh, until obtaining a particle size of 38 μm, (If the particle size of the sample is greater than 63 microns); Six grams of the original sample are taken to a hydraulic press at 15 tons for 1 minute, thus obtaining a pellet of 30 mm diameter for analysis in the Bruker S4 Explorer fluorescence equipment with Detector Pro4 and X-ray tube Rh at a voltage of 40KV and 25mA [28-31].
The samples of clay were then subjected to the calcination process, which consists of carrying each sample at 1000°C and maintaining it at that temperature for 1 hour, to evaluate the weight percentage lost during the treatment after weighing the sample before and after, at 105°C. These calcination losses L.O.I. (Loss On Ignition) represent the amount of volatile components (H 2 O, CO 2, F, Cl y S) and organic matter not detected with the fluorescence equipment.
For the success of laboratory tests, samples were taken randomly taking into account that they were too small without the need to perform any type of preparation. In the present study, AFM technique was employed to characterize the morphology and microtopography of the main minerals present in the clay fraction from the superficial layer of a soil in the industries dedicated to the fabrication of masonry products in Ocaña Norte de Santander. In the characterization, image analysis programs, XRF spectroscopic techniques and XRD were used together to determine and quantify the main minerals identified [32].
3. Results and discussion
The surface images were taken at 5 µm for 5 µm and in some with a 2 µm for 2 µm approach for each particle of clay mineral samples, with the help of software which has the equipment to identify the structures present in the samples by means of the frequency distributions obtained.
3.1 AFM results
Taking into account the above and the selected samples, the following results were obtained for the surfaces of the samples selected in 2 and 3 dimensions, as well as the distribution of frequencies to the grouping of data that analyzes the equipment in mutually exclusive conditions which indicate the number of observations in each category, with respect to the areas of the surfaces, being a characteristic graph for each element of the sample obtained from the computer software. This provided an added value to the grouping of data as shown in the following figures from 3 to 12 as in all AFM images, topographic differences are originally color coded and then converted to a scale where red are immersions and yellow are the maximum. Because of the above, images taken on the microscope of force atomic are shown in Figure 3.
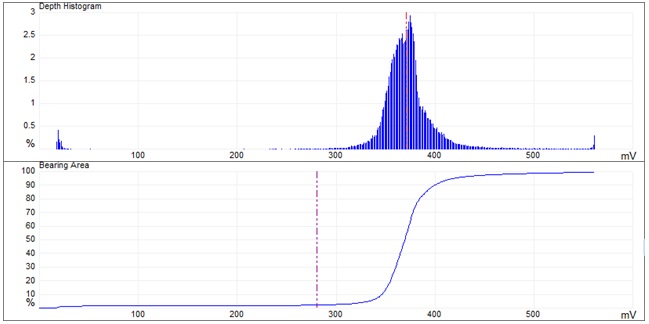
The topographic pattern of sample 1 Figure 3 suggests that it contains Al₂Si₂O₅(OH)₄ (Caolinite), for which the characteristic frequency graph is shown in Figure 4.
The previous histogram shows Caolinite has higher depths between 0 to 40 and 350 to 390 mV of 2% surface response.
Figure 5 shows the images taken on the microscope for sample 2.
The topographic pattern of sample 2 Figure 5 suggests that it contains KO 2 (potassium oxide), for which the characteristic frequency graph is shown in Figure 6.
The previous histogram Figure 6 shows potassium oxide has higher depths between 330 to 380 mV of 4% surface response.
Figure 7 shows the images taken on the microscope for sample 3.
The topographic pattern of sample 3 Figure 7 suggests that it contains Fe 2 O 3 (iron oxide), for which the characteristic frequency graph is shown in Figure 8.
The previous histogram shows iron oxide has higher depths between 70 to 78 mV of 4,66% surface response.
Figure 9 shows the images taken on the microscope for sample 4.
The topographic pattern of sample 4 Figure 9 suggests that it contains Al 2 O 3 (Alumina) y SiO 2 (Silica), for which the characteristic frequency graph is shown in Figure 10.
The previous histogram shows alumina and silica has higher depths between 135 to 145 mV of 4,43% surface response.
Figure 11 shows the images taken on the microscope for sample 5.
The topographic pattern of sample 5 Figure 11 suggests that it contains Al₂Si₂O₅(OH)₄ (Caolinite), for which the characteristic frequency graph is shown in Figure 12.
The previous histogram shows Caolinite has higher depths between 350 to 380 mV of 2,96% surface response, being similar to sample 1.
Afterwards, it was observed the samples behave as layers according to the research done by Sachan, taking into account Samples 1 and 5, where the presence of Caolinite is evidently observed. The frequency distribution for all images represents the area and depth of the particle that was analyzed [33].
The distortion present in sample 5 is due to the contact mode of the AFM equipment with the powder of the sample and the type of mineral texture, in addition to the topographic variations that are color-coded. On the other hand, some air current or sudden movement could influence the glass slide and the plate, taking into account that the assembly of the sample on the plate is by pressure and adhered by a special tape [34].
AFM topographies of clay samples as seen in figures from 3 to 12, are in the form of Caolinite for the grains shaped in the form of rosettes; also, the presence of aluminum-silicates are characteristic of this type of material. In addition, the presence of Alumina, Silica and Iron Oxide is also observed in the samples, because these are presented in the form of flat plates (Silica) and others in spheroidal form (Alumina and Iron Oxide), which is of great importance for the investigation; these forms are typical images with topographic variations below 10 nm [18].
According to the technological review, the presence of Al 2 O 3 (Silica), SiO 2 (Alumina), FeO 2 (iron Oxide) and KO 2 (Potassium Oxide) is the most important and relevant taking into account that approximately 50 images of different particles and samples were selected for research. The potassium and iron oxides exhibit similar histogram behavior, but the intensity of the millivolts (mV) of the response surface varies.
In the research developed by Sachan, it was determined that the AFM method worked quite well for different clay microfabricates, confirming reliability and versatility of the method, assuming the potential application to become a routine tool for the identification, quantification and evaluation of soil micro-manufacturers [33].
Finally, the results in the topography of samples varied depending on the type of clay, this could be evidenced in the images obtained by AFM where, as the sample changes, larger and deeper valleys are formed; thus also the decrease in the thickness of the material can be observed.
3.2 Validation of results
The FRX and DRX tests yielded the following results shown Table 2, for comparing the test in AFM.
The Table 2 shows a high percentage weight of silica (SiO 2) of 54.743 and 56.582 % for the two mixtures, which causes a rapid drying process in cooking and, a decrease in the contraction. The alumina (Al 2 O 3) is also found in high percentages for the two mixtures of 20.670 and 20.565 %, giving it a resistance to high temperatures and a decrease of breaks in cooking. Although the current industrial use of this clay is for construction and the recommended chemical characteristics are of 50 to 60 % for SiO 2 and of 20 to 30 % for Al 2 O 3, with which evidently the presence of montmorillonite clays is verified because its chemical composition is: SiO 2: 48 - 56%, Al 2 O 3: 11 - 22%, MgO: 0.3 - 0.8%, and the percentages obtained in the analysis of XRF make it suitable for this use. The values of the proportions of iron oxide (Fe 2 O 3) are normal up to 10% percentage. This oxide will give it a red color after burning [35]. The low content of alkaline oxides (sodium and potassium) and alkaline earth oxides (magnesium and calcium) makes it possible for the clay to generate the glassy phase at relatively high temperatures (Higher to 900°C), conferring properties of semirefractariety. The presence of a high content of potassium oxide (K 2 O) of 2.926 and 3.301 % above the other alkali and alkaline-earth oxides, classifies it as an illitic material, the other elements are in low proportions that do not affect the structure of the final product [36]. Taking into account the previous values, the other samples must contain percentages similar to sample 1.
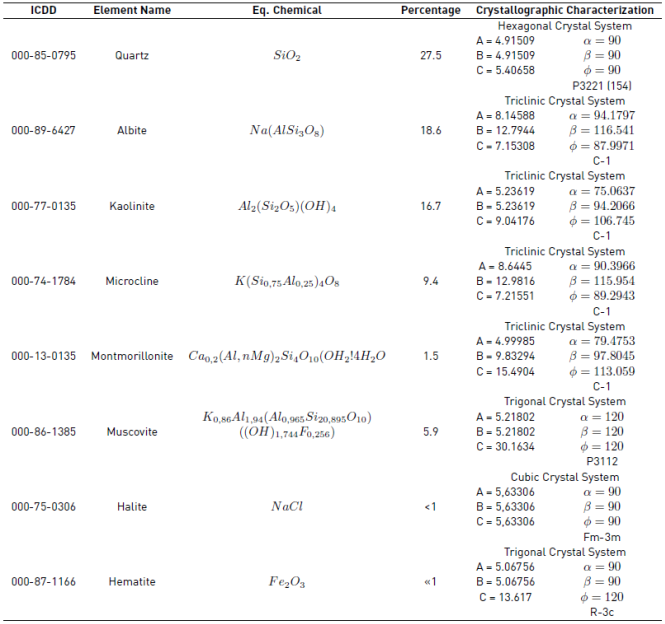
Also, the diffractograms of the sample are shown in Figure 13 and Table 3 indicating the quantitative analysis obtained in the laboratory.
Figure 13 shows the composition of the constituent feldspars of rocks corresponds to a ternary system composed of Quartz (SiO 2), Albite (Na (AlSi 3 O 8)) and Caolinite (Al 2 (Si 2 O 5) (OH)4). The above can be checked with the XRD analysis of the following Table 3.
Most of the clay mixtures have a composition, for example: 50% kaolinite + 30% quartz + 20% potassium feldspar [37]. As for the clay minerals, it is observed that the majority of the samples is constituted by the Illite in an important proportion (generally it is the second mineral in importance after the quartz). Additionally, some samples contain smectites but in a proportion similar to kaolinite. In addition, the Table 3 shows the phases present in the specimens selected from the samples. They were performed by comparing the profiles observed with the diffraction profiles reported in the PDF-2 database of the International Center for Diffraction Data (ICDD). Quantitative analysis without amorphous determination [38].
4. Conclusions
The resolution and results of images by AFM is a great tool to determine the topographies of the clay compounds used in the ceramics industry by which it can be verified that the texture of the samples are repeated in random places.
The found topographies of the constituent elements of the clay were validated with the XRD and FRX tests, which was of great importance for the investigation, taking into account that the abundant elements were iron oxide, alumina and silica, components found in the topographic images of AFM. These results make a contribution to the scientific community and future work in this area of nanotechnology.
Most of the samples were found in the form of flat plates in mineralogical compound characteristic of silica and others in spheroidal form, alumina and iron oxide forms, which varies the frequency of the histogram as its percentage of area for each of the samples studied.
Additionally, the potential of the AFM is based on the performance of an analysis to determine the contact angle, the hardness and the roughness of the samples with the material that will be carried out in future investigations. On the other hand, for these small pore sizes, a statistical analysis could be performed to determine, on average, the amplitude of these zones as well as to determine the mechanical strength of the particles.
Taking into account the bibliographic review of the literature, it can be affirmed that in the literature no record of complete characterization of clays at manometric level using AFM was found.
The AFM with the help of the XRD and XRF tests provides a broader view of the distribution in the overall volume of the elements and characteristics of the samples, that can lead to a much more reliable prediction of the properties of the nanocomposites. Some of these characterization techniques, which can produce a large-scale distribution analysis in nanocomposites, directly result in a pictorial image of the distribution (e.g. Confocal Raman Microscopy and Atomic Force Microscopy).


