1. Introduction
Geophysical techniques are used to study earthen materials based on their physical properties obtained in real time. Some of the properties that have been measured in geophysical techniques are electrical conductivity, seismic velocity, density, magnetic susceptibility, etc. [1]. Currently, electrical measurements may be obtained in situ; they are reliable, cheap, fast and non-destructive. However, conventional laboratory experimental testing can be very costly and takes a longer time when dealing upon large number of soil [2]. In view of these attractive features, a large number of applications have been developed for electrical measurements in a wide variety of scientific and engineering fields.
Electrical resistivity is an important parameter in the geophysical field. It represents the capacity of the soil to oppose the passage of an injected current. In Soil Science, the main advantages of electrical resistivity are based on its high sensitivity to the small electrical variations of subsurface, its speed of acquisition of measurements and its non-destructive character. The use of electrical resistivity has been applied to various fields such as geotechnical, environmental, agriculture, groundwater and underground resource exploration [3-7].
The wet climate during the last years has raised salinity soils. The salty crust results from a process of deposition produced by salt precipitation in depth, generated by water movement due to capillarity action from salty waters. Sodic soils have excessive levels of sodium adsorbed at the cation exchange sites. Sodic salts deposits are vulnerable to soil structure. The forces that hold clay particles together are weakened when excessive sodium is adsorbed at the negative charges [8]. In sodic soils, higher concentrations of salts provide excess cations which promote flocculation by moving in close to the negatively charged particles. These types of soils present high rigidity and high shear strength in natural dry conditions. In front of water action, they may be subjected to localized settlements, which can be increased by dynamic loading. Besides, the salts can act on the structures as very harmful corrosion agents from the natural foundation soils, as well as when used as quarry material for concrete.
Pore fluid chemistry is one of the factors that influence the adsorbed water layer thickness surrounding the clays. That is, strong cation concentration, high cation valence and acidic environment dramatically decrease the double layer thickness around the clay particles [9]. Engineering characteristics of fine-grained soils may be subjected to several factors including density, porosity, structure, history of tension, granulation, amount and type of clayey minerals, plastic property and amount and kind of minerals in the pore water [10]. Any change in each of these characteristics will change the physical and mechanical characteristics of soil, and consequently structures which are built on soil will be exposed to change or threat [11]. Electrical methods are used not only for prospecting geological formations and aquifers [12-13] but also may be extended to characterize soils affected by salinization. The determination of the chemical properties of soils by electrical resistivity has an important effect in identifying a chemo-mechanical behavior of some saline soils for the foundation of structures. [14-18].
Researchers attempted to limit electrical conductivity to geotechnical properties [19-22]. Other models attempted to explain the conductivity in clayey soils [23-26]. An empirical relationship between electrical conductivity and soil properties was proposed [27], based on laboratory measurements of clean sand stone samples. However, the Archie’s law is suitable only for saturated rock or sandy soil. A study was conducted on the relationship between electrical resistivity and water content of kaolinite clay mixed with various percentages of sand [28]. An experimental study in which the electrical resistivity was measured in different specimens of white kaolin compacted with different voids ratio [29]. Nevertheless, most of these studies concern specific type soil and are not applicable to natural soil. Recently, it was shown that decreasing the pressure increases the resistivity and porosity for a constant temperature [30]. Increasing the temperature causes the resistivity to follow a quadratic relationship with the permeability for a constant confining pressure. Increasing the confining pressure decreases the sensitivity of the permeability and resistivity to the confining pressure. However, the obtained relations are considered local relations as they are affected by the geological formation of the site conditions.
The aim of this research is to investigate the geotechnical and chemical behavior of a natural soil using electrical resistivity measurements under various conditions, (various chloride salts types and concentrations, voltage).
This paper presents experimental laboratory results of a natural sodic soil from the region of Ain Nouissy (Mostaganem), where future large urban planning is underway. In this investigation, soil behavior is experimented and analyzed under various salinity conditions. It appears from this study that the electrical method is a very useful geophysical technique in order to determine relationships between electrical resistivity of the soil and the physical and chemical parameters such as water content, porosity, salt concentration and pH. The determination of these physical and chemical parameters allowed us to reduce the salinity of the natural studied soil and consequently improve its mechanical properties.
2. Experimentation
The soil studied is silt which was taken from the region of Ain Nouissy Mostaganem. The physical and mechanical properties of the studied soil are listed in Table 1.
A chemical analysis was made on the soil sample; the chemical properties are shown in Table 2.
The Figure 1 shows the experimental glass cell 25 cm long, 10 cm wide and 10 cm high. The cell is unscrewed in three parts, 15 cm reserved for the soil sample and 5 cm in the extremities for the flow of water using the Geofabric. Copper plates are used as electrodes in the extremity.
In the first step, a pocket conductivity meter (Hanna 7833) was used to directly measure the electrical conductivity of soil samples mixed with distilled water and salt solutions at different concentrations (0.2, 0.6 and 1 mol/l).
The soil samples were mixed with three types of chloride salts, NaCl, KCl and MgCl2. The saline solutions were prepared by mixing salt concentrations with distilled water using an electric stirrer for a period of 20 minutes to dilute the salt molecules in water. The powdered soil grains were manually mixed with the salt solutions, prepared for one hour to thoroughly mix the water molecules in the soil, and then left standing for one to two hours to ensure even distribution of the water content.
The following step was the injection of a direct current of 15, 30 and 45 volts on the soil sample for duration of 72 hours (quantity of fixed drained water). Measurements of the voltages and the current electrical devices are obtained using a mega 2560 arduino acquisition card. The assembly used for the measurement is shown in Figure 1.
3. Results and discussion
3.1 Direct measurement of electrical resistivity
The electrical resistivity of a ground horizon is equal to the inverse of its electrical conductivity; it is therefore defined by the ability of the horizon to limit the passage of the electric power. Electrical resistivity has been used as an indicator of the influence of different parameters such as, water content, degree of saturation, porosity, concentration of ion and the pH of soil. The electrical resistivity is calculated as shown in the Equation (1):
where:
σ is the electrical conductivity measured with the conductivity meter Hanna 7833
Variation of water content
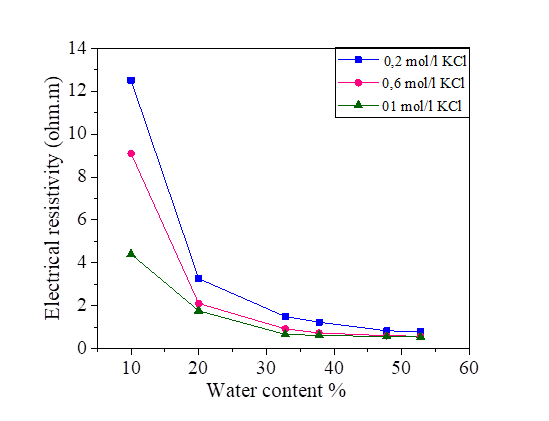
The electrical resistivity of silt and silt mixed with different percentages of salts, compacted to several water contents is presented in Figures 2, 3, 4 and 5. From these figures, it is noted that there is a large decrease in the electrical resistivity of the silt sample and silt mixed with salts for low water content. There is a slight variation in electrical resistivity beyond 30% of the water content, closer to optimal water content. The effects of the salts on the electrical resistivity are shown in Figures 3, 4 and 5. The mixtures of silt with NaCl, KCl and MgCl2 have a tendency of decreasing the values of electrical resistivity with the increase of the water content.
It is noted that the decrease of the electrical resistivity with the increase of the water content is similar for the different mixtures of NaCl, KCl and MgCl2 salts. The increase in the salt concentration causes a decrease in the electrical resistivity [Figures 3, 4 and 5]. The clay which is mainly composed of clay particle, insoluble salts, sesquioxides and humus, whose conductivity is very good, especially the surface of clay particle has much negative charge that can adsorb a lot of positive charge (such as K+, Na+, Ca2+) which can increase conductivity [31]. This hypothesis justified the decrease of the electrical resistivity in the presence of the salts compared to the samples mixed with distilled water.
Variation of degree of saturation
The degree of saturation is calculated by the Equation (2).
With:
ω Water content; Gs Density of the solid grains and ρd Dry density.
From Equation (2), it is clear that the degree of saturation increases with the increase of water content or dry density.
Figures 6, 7, 8 and 9 indicate that electrical resistivity of silt sample and silt mixed with salts decreases when the degree of saturation increases, and the electrical resistivity decreases evidently after the water content is above 30 %.
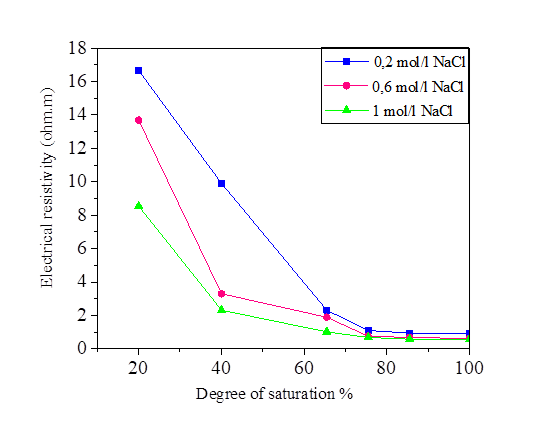
Figure 7 Variation of the electrical resistivity with degree of saturation for silt and NaCl mixture
When the water occupies larger connected pores, the electrical resistivity will decrease. When the water content is above 30%, the diminution of electrical resistivity slows down due to that the water content is close to saturation.
Variation of the porosity
The parameter of the porosity is determined by the use of the Equation (3):
Where:
γ Total density; γs Density of the solid grains and Sr the degree of saturation
From this equation, we note that there is a relationship between the porosity and the degree of saturation of the soil, therefore the effect of the porosity on the electrical resistivity of silt and silt mixed with the percentage of salts is the same as the degree of saturation. Increasing porosity causes a decrease in electrical resistivity. Figures [10, 11, 12 and 13].
Variation of salt concentration
The variation in the salinity of the water mixed with the silt at 42.8% and 52.8% of the water content is shown in Figures 14 and 15. From these figures, it can be seen that the increase in the salt concentration causes a decrease in the electrical resistivity. The variation of the electrical resistivity in the NaCl and KCl mixtures is practically the same. On the other hand, the MgCl2 mixture reduces the electrical resistivity compared to that of the NaCl and KCl.
As is expected, the salt content of pore fluid reduces rapidly with the resistivity value increasing. The salt content will have higher influence on the measured resistivity in marine clays than the grain size distribution and density. The same observations are reported by [32].
Variation of pH measurement
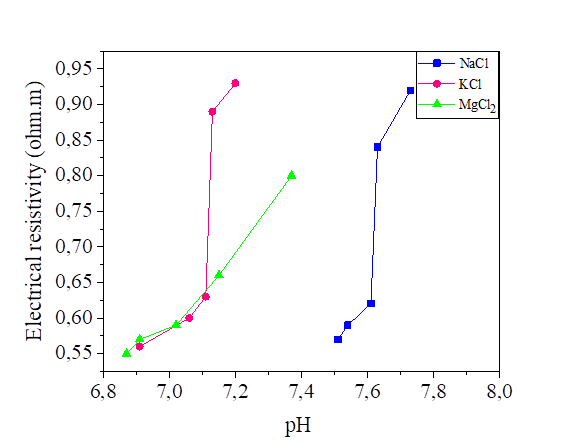
Figures 16 and 17 show the variation of the pH as a function of the electrical resistivity of the silt mixed with five concentrations solutions of NaCl, KCl and MgCl2, (0.2 , 0.4, 0.6, 0.8 and 1.0 mol/l) and two different water content 42.8% and 52.8%.
The pH of the silt mixed with the three salts is varied between 6.63 and 7.77 so we can consider that the effect of NaCl, KCl and MgCl2 is neutral, the ions of Na+ and Cl- have no effect on [H3O+] and [OH-], because they are respectively indifferent acids and bases (HCl and NaOH are strong): the pH remains at 7. Same principle for KCl and MgCl2. From the curves presented, the increase in water content slightly decreased the electrical resistivity and the pH of the soil samples. So, we can observe that the water content has a significant effect on the soil parameters. Soil pH is known as “soil reaction”; it indicates the acidity or alkalinity of soil. pH of water effects on the ion solubility of soil, can directly affect the microbial and plant growth, [18]. Even though there are several factors that may provide acidity or alkaline conditions, neutral salt concentration also may affect pH variation [33].
3.2 Measurement of electrical resistivity by applying an electric current
Electrical resistivity measurements were done according to Wenner method configuration [34] by applying a DC current in the exterior electrodes and measuring potential in the inner ones. The value of electrical resistivity was computed through Equation (4) [35], where L1 and L2 are the spacing and depth of the electrodes, respectively, and R is the electrical resistance Equation (4).
Variation of water content
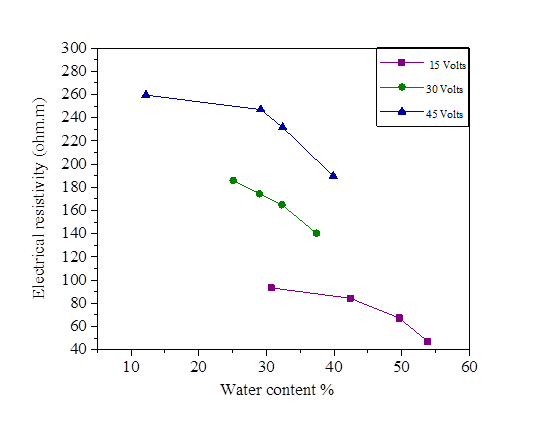
The initial water content used is 5% of the liquid limit (47.8%).The variation of this water content after injection of the direct current is represented in Figures18, 19, 20 and 21.There is a large increase in electrical resistivity compared to that measured, the electrical resistivity increases with the increase of the electric current. According to these figures, the increase in the applied current causes a decrease in the water content, (for an electric current of 15 volts we have a water content varied of 30.72% and 53.78% and for 45 volts we have a variation of 12.2% to 39.87%).A concentration of 0.2 mol/l of NaCl, KCl and MgCl2 decreased the electrical resistivity so increased the water content (Figures 18, 19, 20 and 21].

Figure 19 Effect of water content on electrical resistivity at 15, 30 and 45 volts with NaCl concentration

Figure 20 Effect of water content on electrical resistivity at 15, 30 and 45 volts with KCl concentration
Variation of degree of saturation
The degree of saturation is calculated by the same formula as that of the electrical conductivity measured directly by the pocket conductivity meter.
Figures 22, 23, 24 and 25 show the decrease in electrical resistivity as a function of the increase in the degree of saturation of silt samples and silts mixed with salts with a DC variation of 15, 30 and 45 volts. For a fixed water content of 47.8% corresponding to a degree of saturation of 95.75%, the application of the electric current varies the degree of initial saturation along the sample from the anode to the cathode. For the silt sample mixed with distilled water, the increase in electrical current causes an increase in the electrical resistivity and a decrease in the degree of saturation. There is a variation in the degree of saturation from the anode to the cathode. The saturation of the samples near the anode is practically dry with respect to the cathode; the figures show that there is a decrease in the electrical resistivity of the samples mixed with the salts compared to the samples mixed with the distilled water, It can be observed that the presence of salt decreases the electrical resistivity of silt and thus increases the degree of saturation with respect to the natural samples.

Figure 23 Effect of degree of saturation on electrical resistivity at 15, 30 and 45 volts with NaCl concentration

Figure 24 Effect of degree of saturation on electrical resistivity at 15, 30 and 45 volts with KCl concentration
Variation of porosity
The porosity is calculated by the same formula as that of the electrical conductivity measured directly by the pocket conductivity meter. Figures 25, 26, 27 and 28 show the effect of porosity on the electrical resistivity of naturally occurring silts and with a salts concentration of 15, 30 and 45 volts.
It is noted that there is a decrease of the porosity with the increase of the electrical resistivity for the sample of silt mixed with distilled water and with salts. The presence of the salts reduces the resistivity and increases the porosity. From the Figures [25, 26, 27 and 28], the variation of the porosity and the degree of saturation is practically similar.

Figure 27 Effect of porosity on electrical resistivity at 15, 30 and 45 volts with NaCl concentration

Figure 28 Effect of porosity on electrical resistivity at 15, 30 and 45 volts with KCl concentration
Variation of pH measurement
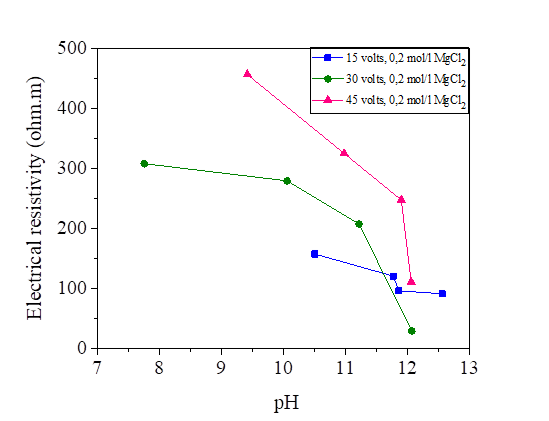
Figures 29, 30 and 31 show the variation of the pH as a function of the electrical resistivity after 15, 30 and 45 volts direct current injection. According to these figures, the presence of electric current increases the alkalinity of the mixture of silt and salts by comparing with the pH of the samples measured directly (the measured pH varies directly from 6-7 and from the current between 7 and 12). There is a large variation of the pH of the soil from the anode to the cathode. The injection of the electric current insured the increase of the OH- and the decrease of the H.O + in the transformation of the molecules of water, this reaction increases the pH of the soil (pH > 7).From the figures below, we note that there is a linear relationship between the electrical resistivity and the soil pH, (the higher the pH, the lower the electrical resistivity). Variation of pH may significantly affect the soil behaviour. While low pH may cause a flocculated structure, high pH may result in a dispersive or oriented structure. In addition, variations of pH may affect the suction performance of soil [36].

Figure 30 pH variation as a function of the electrical resistivity of a NaCl concentration at 15, 30 and 45 volts

Figure 31 pH variation as a function of the electrical resistivity of a KCl concentration at 15, 30 and 45 volts
4. Conclusion
An experimental investigation is conducted using electrical technique in order to determine soil properties. The soil was studied in its natural state and with mixtures of salt solution.
This research aims to determine the influence of water content, degree of saturation, porosity, ion concentration and pH on the electrical resistivity. The study was based on a comparison of the direct measurement of electrical resistivity with the injection of the 15, 30 and 45 volts electric current. The electrical parameters were obtained using an automatic data acquisition system developed in our laboratory. This work will be used for soil identification, resolving soil pollution or further mechanical treatment.
Based on the experimental investigation the following conclusions can be drawn:
There is a linear variation between electrical resistivity and geotechnical parameters; the increase of water content, degree of saturation and porosity causes a decrease in the electrical resistivity.
There is a relationship between electrical resistivity and salinity of soils. A decrease in electrical resistivity is observed with the increase of the concentration of salts in the soil. The variation of the electrical resistivity in the NaCl and KCl mixtures is practically the same. On the other hand, the MgCl2 mixture reduces the electrical resistivity compared to that of the NaCl and KCl.
Variation of pH affects significantly the soil behavior. Based on the test results, it was found that there is a linear relationship between soil electrical resistivity and soil pH. The presence of electric current increases the alkalinity of the mixture of silt and salts.
These findings indicate that the electrical resistivity may be used as a non-destructive and cost efficient issue to determine physical and chemical parameters for soil investigation. However, more resistivity and geotechnical tests should be carried out for various types of soils. Besides, other relationships between electrical resistivity and chemical parameters such as CEC and mineralogical composition should be performed.


