Introduction
Medicinal plants constitute the basis of traditional medicine and continue to provide new molecules for the synthesis of new drugs (Majeed, 2017). In Colombia, their use is ancestral, and more than 50% of the herbs are collected (Cardona & Barrientos, 2011) including basil, thyme, chamomile, calendula, rosemary, etc. Calendula (Calendula officinalis L.) is one of the most used herbs among 156 medicinal, aromatic and condiment species that are marketed (Zamudio et al., 2006) and the second in the number of marketing authorizations (Guevara et al., 2010).
Calendula belongs to the Asteraceae family (Pérez Arbeláez, 1956) and its flower heads have different culinary and pharmacological uses such as antiphlogistic, healing, and anti-inflammatory properties (Acosta de la Luz et al., 2001; Franzen et al., 2019).
Knowledge about the functions of nutrients in plants is required during the management of soil and fertilization in agricultural agroecosystems since they allow carrying out vital processes related to the absorption, transport, and use of assimilates (Castro & Gómez, 2010). The cultural management of medicinal plants is a factor that strongly influences the synthesis of secondary metabolites, with fertilization being essential to achieve good productivity and satisfactory levels of bioactive compounds (Marques, 2019).
There are several studies on the effect of fertilization on the nutrition of calendula. In Iran, several authors measured the effect of N, P, K, vermicomposting, and gibberellic acid on growth, flowering, and availability of nutrients in the post-harvest soil (Tiwari et al., 2018). In Brazil, the effect of the application of N, P and bovine manure on the concentration of secondary metabolites was evaluated (Fernandes et al., 2013). Additionally, some authors determine that nitrogen fertilization increases the total content of flavonoids (Paim et al., 2010). Under the conditions of Poland, agronomic responses such as number of flowers, fresh and dry weight of flowers, and total flavonoids (1.14%) have been monitored (Król, 2011; Bielski & Szwejkowska, 2013). In Iran, it is observed that humic acids promote the increase of weight of fresh leaves and flowers (Mohammadipour et al., 2012). Ganjali et al. (2010) also show that the sowing dates, sowing density, and fertilizer dose significantly regulate the yield and essence of calendula.
Researchers at the international level have made contributions in the use of calendula in the pharmacological sector, but studies in terms of plant nutrition are very scarce. Colombia is not an exception, since producers are unaware of the phenological stages of greatest nutritional demand, the absorption of nutrients by vegetative organs and especially flowers, and the fertilization programs under field conditions. For these reasons, this pioneering research was carried out with the aim of evaluating the content and distribution of essential micronutrients (Mn, Fe, B, Cu, Zn) and beneficial elements (Na) in the different organs (stems, leaves, flowers, and seeds) and stages of development of calendula under field conditions.
Materials and methods
Characterization of the experimental area
The research was carried out in the municipality of Yumbo, Valle del Cauca, located at 3°35'0" N, 76°28'0" W, at an altitude between 1650 and 2000 m a.s.l., with 50% relative humidity in the dry season and 70% in the rainy season. The soil in this municipality was classified as Typic Dystrudepts (IGAC-CVC, 2004) in a low montane humid forest life zone bh-PM (Holdridge System) (CVC, 2017).
Samples of the soil where the calendula (C. officinalis L.) crop was established were collected at a depth of 0 cm to 20 cm (Tab. 1). The physical characteristics of the soil were determined in the laboratories of the Universidad Nacional de Colombia, Palmira campus, with the following methodologies.
The analysis determined that the soil had a silt loam texture, 0.9 and 2.53 g cm3 for apparent and real density, respectively, and 63.5% of total porosity. These characteristics provided the optimal conditions of workability, development of root system, and circulation of water and air within the soil.
The samples for analysis of the chemical properties (Tab. 2) were transferred to the Analytical services laboratory of the International Center for Tropical Agriculture (CIAT). The results were interpreted following several parameters at the national level (Castro, 2004; Zamudio et al., 2006).
TABLE 2 Chemical characteristics of the soil in the study area.
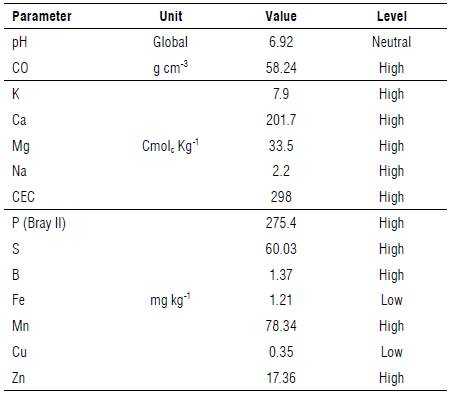
CO - organic carbon; CEC - cation exchange capacity.
The soil had a neutral pH with high availability of nutrients (S, B, P, Mn, Ca, Mg, Na and Zn) and nutrient exchange due to the levels of organic carbon and cation exchange capacity (CEC). Additionally, possible adverse effects on the plant due to low levels of Fe and Cu could be observed. In general, the soil had the capacity to provide sufficient nutrients during the calendula developmental stages.
Experimental description of the research
The sampling unit was a plot of 1000 m2 planted with calendula. The farmers of the area managed the crop with two fertilizations, the first based on a broadcast application of composted chicken manure that was removed along with the soil after four days during its preparation for sowing. The second fertilization consisted of mineral fertilization, using 5 to 8 g of urea (46% N) + triple 15 (15% of N, P and K). The amounts varied according to the empiricism of each product, which was applied in a crescent shape around the plant 1 month after sowing.
A completely randomized design was used, considering five phenological stages of the crop (2, 3, 5, 6 and 7 months after transplantation) as treatments and three replicates. The content of micronutrients (Mn, Fe, Cu, B, Zn) and beneficial element (Na) were evaluated at each stage in the organs of the plant shoot (leaves, stems, flowers, and seeds).
Tissues were collected in the flowering (2 to 7 months) and fruiting (5 months onwards) stages. The phenological stages can be shortened or prolonged according to the agronomic management of the producer and the agroclimatic conditions of the area.
At each stage, 10 complete plants were randomly harvested. The samples of leaves, stems and the floral head (flowers and seeds) were washed with distilled water. Each organ was dried at 60°C until obtaining a constant weight and then chopped with a tungsten knife mill (IKA LABORTECH-NIK M20, Sao Paulo, Brazil). Samples were sieved (using a 2 mm sieve/net), marked, packed, and finally transferred to the laboratory. Nutrient determinations in leaves, stems, and floral head (flowers and seeds) were carried out following the CIAT laboratory methodologies (CIAT, 2006).
Analyses of variance (P<0.05) and Duncan mean tests were performed using the statistical package SAS (Statistical Analysis System) version 9.13. (SAS Institute Inc., 2002).
Results and discussion
Nutrient distribution in organs of calendula
The analysis of variance (Tab. 3) found statistically significant differences for some of the nutrients (Na, B, Mn and Zn) monitored in the different vegetative organs of calendula.
TABLE 3 Analysis of variance for the concentration of nutrients in vegetative organs of calendula.
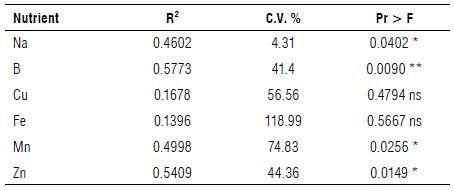
*significant, **highly significant, ns - not significant. C.V. - Coefficient of variation.
For manganese (Mn) and zinc (Zn), the ANOVA found significant differences (P<0.05) between the organs analyzed throughout the development stages (Fig. 1). The Mn dynamics were different, since the highest concentration was located in the leaf (161.84 mg kg-1), followed by the stems (63.85 mg kg-1), flowers (44.48 mg kg-1) and, in the seeds (19.36 mg kg-1) to a lesser extent.
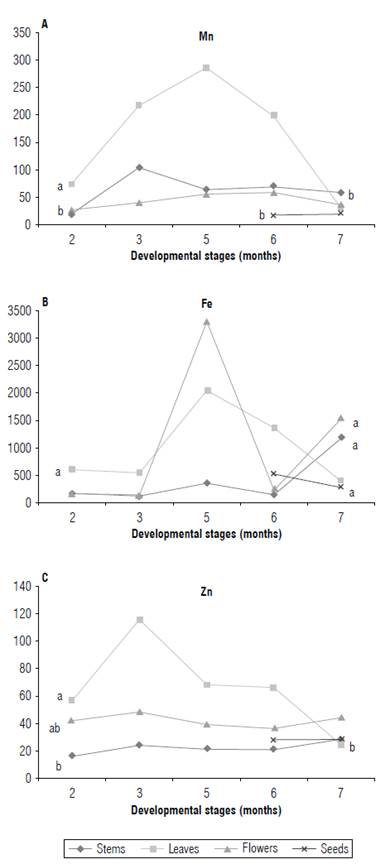
FIGURE 1 A) Manganese (Mn), B) iron (Fe), and C) zinc (Zn) contents (mg kg1) in leaves, stems, flowers, and seeds of the calendula plant at different developmental stages (months). Means with the same letter do not differ significantly according to the Duncan test (P<0.05).
Among organs, the greatest fluctuation of Mn occurred in the leaves with a perfect parabola; the greatest accumulation was recorded in the fifth month. One of the most notable functions of this element is its participation in photosynthetic activity, where oxygen is produced from water (Salisbury & Ross, 1994; Marschner, 2003). When there are deficiencies in the soil, symptoms are associated with interveinal chlorosis in the youngest leaves, depending on the species and its growth (Taiz & Zeiger, 2006).
Statistical differences were not found between plant organs for iron concentrations. The most elevated concentration was found in the flowers (1061.12 mg kg-1), followed by the leaves (976.15 mg kg-1), seeds (382.19 mg kg-1) and finally the stems (377.4 mg kg-1). These values exceed by far the ranges from 50 to 250 mg kg-1 registered in other crops (Navarro & Navarro, 2003).
Iron has low mobility in plant tissues due to the high concentration of P and Mn (Lopez, 1998). Low iron mobility was observed in the crop due to P concentrations ranging from 3.51 to 5.38 g kg-1 (Garcia Vivas et al, 2015).
Zinc showed a significantly higher accumulation in the leaf (66.33 mg kg-1) with a tendency to decrease its concentration as the plant grew during the months in production. A dilution effect could be observed due to an increase in the leaf mass or the translocation towards the other organs (Malavolta et al, 1997). The flowers (42.18 mg kg-1) were also valuable reserve tissues, followed by the seeds (28.41 mg kg-1) and stems (22.31 mg kg-1). However, in these last two organs, the concentrations were more constant throughout the crop cycle. The concentration of Zn in tissues ranged from 20 to 150 mgkg-1, with some of the most important functions being the biosynthesis of indoleacetic acid, chlorophyll formation, and nitrogen metabolism (Azcon-Bieto & Talon, 2013).
The ANOVA detected significant differences (P<0.05) for sodium (Na) and boron (B) between plant organs, but not for copper (Cu) (Fig. 2). Although the leaves (19.39 mg kg-1) are the organs of greater Cu accumulation, they did not vary much from the stems (14.02 mg kg-1), flowers (13.16 mg kg-1) and seeds (9.25 mg kg-1), except in the third month, where the leaves accumulated more Cu and then homogenized their behavior with the other organs.
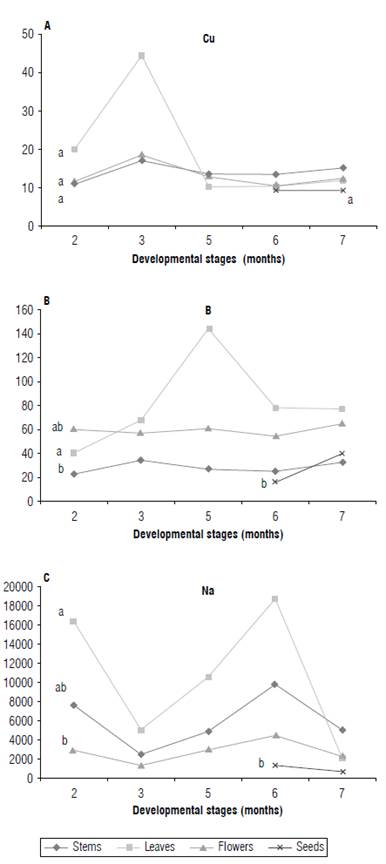
FIGURE 2 A) Copper (Cu), B) boron (B), and C) sodium (Na) contents (mg kg1) in leaves, stems, flowers and seeds of the calendula plant at different development stages (months). Means with the same letter do not differ significantly according to the Duncan test (P<0.05).
The highest concentrations of B, Mn and Zn were found in the leaves (81.66 mg kg-1), where the highest photo-synthetic activity occurs, and the lowest accumulation of these microelements was observed in the flowers (59.47 mg kg-1), stems (28.37 mg kg-1) and, finally, in seeds (28.02 mg kg-1).
Boron shows little mobility in the plant, with the leaves and reproductive organs having the highest concentrations of this nutrient. Young plants absorb more boron than old ones (Navarro & Navarro, 2003), which acts on the apical growth points of the genetic material and facilitates the transport of carbohydrates throughout the internal membranes.
Figure 2C shows the behavior of Na between the plant organs, with the leaves (10556.57 mg kg-1) being the largest accumulators of this nutrient, followed by the stems (5951.65 mg kg-1), flowers (2772.87 mg kg-1) and seeds (1000.69 mg kg-1) where the concentration is lowest. Although the nutrient content fluctuates in each organ, it coincides to the months with the highest and lowest levels.
The higher concentrations in leaves and stems reveal the high activity of Na in osmotic control processes and turgor generation. It can replace K in many species with its similar functions and concentrations in chloroplasts, exercising phosphorylation functions in photosynthesis (Salisbury & Ross, 1994; Marschner, 2003). The high levels of Na in the soil possibly facilitated its absorption by the plant; so, the accumulation in the tissues without observing damage allows us to elucidate that the calendula prefers this nutrient.
On the other hand, the absorption and mobility of nutrients depends on environmental factors, the soil, and the crop. The interaction in the soil-plant phase is mainly determined by the ionic and molecular forms that, in turn, are influenced by the atomic weight, valence, and type of movement in the soil (diffusion, root interception, and mass flow) (Jungk, 1996). In this research, the nutritional supply exceeded the critical levels for Colombian soils (Castro, 2004), facilitating rapid absorption by the crop, which translated into vigorous growth and development.
Nutrient content at different stages of calendula development
The analysis of variance (Tab. 4) found statistically significant differences for all the nutrients monitored in the different developmental stages (months) of calendula.
TABLE 4 Analysis of variance of the concentration of nutrients in different vegetative stages (months) of calendula.
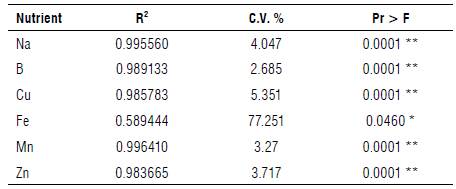
*significant, **highly significant, ns - not significant. C.V. - Coefficient of variation.
For Mn, Fe and Zn, the ANOVA found significant differences (P<0.05) between the stages of plant development (Fig. 3). The dynamics of Mn are in the shape of a parabola, from minor accumulations in the second month (41.41 mg kg-1) reaching the highest value in the fifth (135.95 mg kg-1) and then declining in the seventh (42.84 mg kg-1). Manganese acts as a cofactor activating about 35 enzymatic reactions, with some of them related to photosynthetic activity and others involved in plant defense (Azcon-Bieto & Talon, 2013).
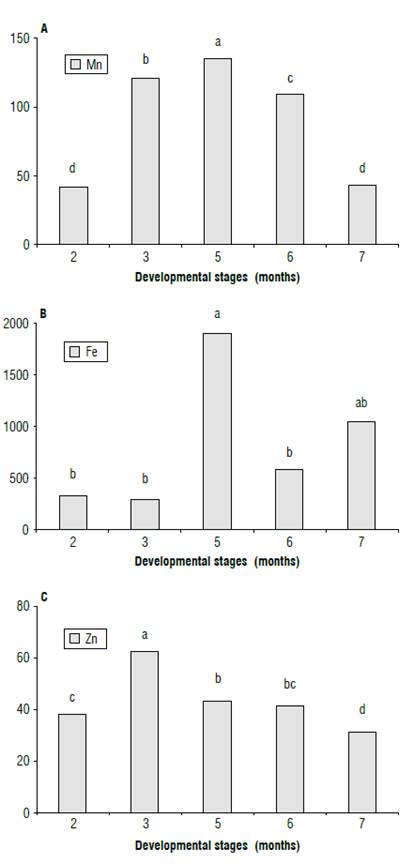
FIGURE 3 A) Mn, B) Fe, and C) Zn contents (mg kg1) at different developmental stages (months) of the calendula plant (leaves + stems + flowers + seeds). Means with the same letter do not differ significantly according to the Duncan test (P<0.05).
The behavior of Fe was characterized by a low concentration in the first months of cultivation, and 294.64 and 253.56 mg kg-1 in the second and third, respectively. Then, it accumulated the largest amount in the fifth month (1891.52 mg kg-1) with a decrease in the following samplings, and a value of 1021.36 mg kg-1 in the seventh month.
The highest Zn concentrations in the plant accumulated in the second month with a value of 62.88 mg kg-1, while in the coming months the demand gradually decreased with 43.01 mg kg-1 in the fifth month, 41.26 mg kg-1 in the sixth, and 132.56 mgkg-1 in the seventh month. One of the primary functions of Zn is the synthesis of tryptophan, the amino acid precursor of indoleacetic acid (IAA), which is a growth hormone (Navarro & Navarro, 2003).
For Cu, B and Na, the ANOVA also found significant differences (P<0.05) between the stages of development (Fig. 4). Like Zn, the plant steadily accumulated Cu, reaching its highest peak in the third month (26.66 mg kg-1) and declining to a level similar to the initial level for the rest of the cycle, with 12.19, 11.43 and 13.16 mg kg1 in the fifth, sixth and seventh months, respectively. This element is related to enzymes that participate in processes such as photosynthesis, mitochondrial respiration, cell wall metabolism, etc. (Hansch & Mendel, 2009; Mendel, 2013).
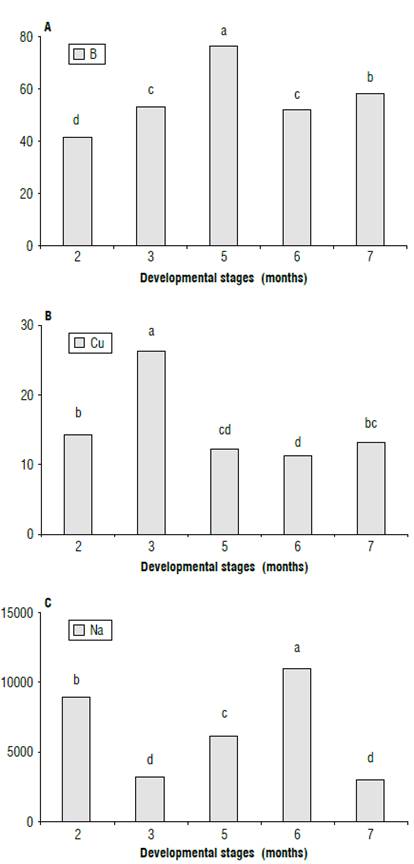
FIGURE 4 A) B, B) Cu, and C) Na contents (mg kg1) at different stages (months) of the calendula plant (leaves + stems + flowers + seeds). Means with the same letter do not differ significantly according to the Duncan test (P<0.05).
The accumulated concentrations of B in the plant were statistically different between the evaluated stages. An increase was observed from the first sampling in the second month with 41.14 mg kg-1 until reaching the highest value in the fifth month (77.32 mg kg-1). Then, a decrease was observed in the seventh month (58.25 mg kg-1). Boron is required in the productive stage of fruit crops and basic grains for its participation in multiple functions, such as flowering, pollen germination, fruiting, synthesis of carbohydrates and hormones, and regulation of water absorption (Rao, 2009; Mejia, 2010).
In the case of Na, significant differences were recorded between the stages of development. The highest concentrations were recorded in the second (8951.16 mg kg-1) and sixth months (11007.46 mg kg-1), while the lowest occurred in the third (2947.17 mg kg-1) and the seventh (3110.11 mg kg-1) months. Sodium is required by many halophyte and certain C4 plants as a micronutrient that is mainly involved in osmosis (movement of water), ion balance, and chlorophyll synthesis. Additionally, it can substitute the functions of potassium under certain conditions (Brownell, 1980; Malavolta et al, 1997).
During the phenological stages of calendula (Fig. 5), the accumulated concentration of Na (32,135.16 mg kg-1) at the end of the cycle was significantly higher than the rest of nutrients, followed by Fe (4,024.44 mg kg-1), Mn (450.0 mg kg-1), B (282.51 mg kg-1), Zn (218.04 mg kg-1) and Cu (77.61 mg kg-1). The most demanded nutrients during some stages of calendula development were Fe, Mg and B (Teixeira et al., 2000). The concentrations of essential and beneficial elements varied constantly in the organs and phenological stages of calendula. Siddiqi and Glass (1981) have shown that the absorption efficiency and utilization efficiency of nutrients vary by multiple factors: the concentrations and availability of nutrients in the soil, fertilization, species to be cultivated, age and organ of the plant, photosynthetic capacity of the organ (root, fruit, leaf, and branches), etc. These findings allow the identification of the participation of each nutrient under field conditions, though Na is of great preference in the productive cycle of the crop.
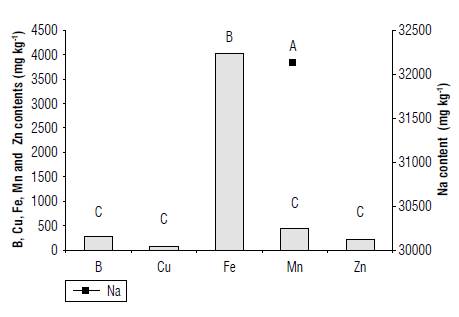
FIGURE 5 Concentration of essential (B, Cu, Fe, Mn and Zn) and beneficial (Na) nutrients in the calendula plant (leaves + stems + flowers + seeds) at different developmental stages (month 2 + 3 + 5 + 6 + 7). Means with the same letter do not differ significantly according to the Duncan test (P<0.05).
Conclusions
The accumulation of nutrients differs between the plant organs, with the most elevated concentrations in the leaves (Na, Mn, B, Zn, Mn) and flowers (Fe). Foliar monitoring is an adequate tool for evaluating the nutrition of the crop.
The content of micronutrients and beneficial elements registered in the entire calendula cycle followed the order Na>Fe>Mn>B>Zn>Cu. Calendula demanded the largest amount of Na in the second and sixth months, B and Fe in the fifth, Cu and Zn in the third, and Mg in the third and fifth months, allowing the identification of the most demanding stages for improving fertilization programs.


