


 English (pdf)
 Article in xml format
 Article references
 Send this article by e-mail
 Cited by SciELO
  Cited by Google
  Similars in
SciELO
Similars in
SciELO  Similars in Google
 Permalink
Introduction
Agriculture encompasses human activities and accumulated knowledge that have resulted in the domestication of animals and plants as a source of provisions for human consumption (Arenas et al., 2004). Over time, agricultural methods have evolved, increasing productivity and crop diversity in different agroecosystems. It is necessary to address comprehensive food needs through sustainable agriculture to ensure future food security (Gómez-Rodríguez & Zavaleta-Mejía, 2001).
So, crop diversity is presented as a sustainable alternative for food production, since it combats hunger, promotes food security, and fosters sustainable agriculture (Gómez, 2018). It is crucial to implement more efficient planting strategies, such as multiple or diversified crops that benefit producers by improving their investments, optimizing land use, and reducing their production costs (Esquivel et al., 2019). This will allow better use of space and time, increasing crop productivity and achieving income for families that produce food on a small scale.
These diversified crops increase productivity and resource use efficiency (Castillo et al., 2022). They reduce the presence of weeds (Pietrobón et al., 2019), lead to greater integral soil fertility, recycle and retain nutrients (Bover-Felices & Suárez-Hernández, 2020); and they have a greater capacity to recover from disturbances, such as pests and diseases (López-Rivera et al., 2020) and extreme weather events, such as droughts and floods (Céspedes & Vargas, 2021).
In this way, the association of leguminous species, grasses, and tubers benefits the soil with the contribution of atmospheric nitrogen, light interception, and wide biomass distribution (Bedoussac et al., 2015). This practice is widely used in organic agriculture to promote species diversity, translating into higher total biomass and better production yields. A study by Colina et al. (2020) in Venezuela evaluated the yield of the association of cassava (Manihot esculenta Crantz), maize (Zea mays L.), and plantain (Musa AAB) and found that inter-species competition affected crop yield compared to a monoculture of each species (Jiménez, 2016).
It is, therefore, essential to consider several parameters when planting, since not all associations are beneficial. Plants have different characteristics that can affect the optimal development of associated species, so it is essential to know the favorable interactions and avoid unfavorable ones (Tamayo & Alegre, 2022).
Nowadays, significant advances have been made that demonstrate that the implementation of multiple crops leads to higher productivity (Jaramillo & Salazar, 2021; Marcía, 2021; Yanes-Simón et al., 2022). The present study aimed to evaluate the effect of the association of maize (Zea mays L.), peanut (Arachis hypogaea L.) and cassava (Manihot esculenta Crantz) crops, to analyze the growth rates of maize in various associations. In this respect, this research allows identifying the physiological efficiency of the maize crop when combined with other species.
Materials and methods
Geographic location
The study was conducted at the Centro de Investigaciones Amazónicas Macagual (CIMAZ) of the Universidad de la Amazonía, an area corresponding to the tropical rainforest life zone, located in the village of La Viciosa, in the municipality of Florencia (Caquetá), at coordinates 1°30'4.39" N, 75°39'44.8" W at an altitude of 250 m, relative humidity of 85.1%, average temperature 24°C, average annual rainfall of 3,695 mm, and sunshine of 4.6 h d-1 (Bonilla et al., 2019; Aldana et al., 2021; Álvarez et al., 2021).
Study design
The experimental area consisted of 33x52 m. Each plot was 10x5 m, with a separation between treatments and between replicates of 0.5 m. In each of the plots there were ridges 0.2x0.3 m. A completely randomized block design was used with four treatments and five replicates (each replicate with 528, 322 and 80 of maize, peanut and cassava plants).
The treatments corresponded to the following: maize monoculture with a planting distance of 0.4 m between plants and 0.8 m between rows; association of maize (with the planting distance of maize) and peanut (in the middle of the maize rows, with a planting distance between plants of 0.2 m); association of maize (with the planting distance of maize) and cassava (in the middle of the maize rows, with a planting distance between plants of 1 m); and association of maize (with the planting distance of maize), peanut (planting distance between plants of 0.2 m and between rows of 2.4 m) and cassava (planting distance between plants of 1 m and between rows of 2.4 m).
The ICA V-105 certified maize variety was used (Arboleda & Cassalett, 1970), and native varieties known as var. red (type Valencia) and var. quindiana, respectively, were used for peanuts and cassava (Vicaría del Sur, 2018). The species were planted on the same date; for maize and peanut, two seeds were planted per site; and for cassava, a 0.25 m long stem cutting with 3 buds was planted. At the time of planting, bokashi fertilizer was applied at a dose of 1 kg m-2. Manual weed management was carried out every 30 d, and pest and disease monitoring were performed on each of the crops every 15 d. Four monitoring periods were carried out, randomly selecting 20 plants per species in a 1 m Z-shaped transept in each plot, visually verifying the presence or absence of pests and diseases on the underside and beam of leaves, stems, and the base of the stem (Velasteguí et al., 2010; Peralta et al., 2021). During the evaluation time, no diseases were recorded for any of the crops. Spodoptera frugiperda was found on maize leaves at stages V0 to V10 (Mora & Blanco, 2018; Abbas et al., 2022; Varón de Agudelo et al., 2022), and garlic and chili bell pepper extract was applied at a dose of 0.1 L per m2 with a frequency of 12 d (Ramón & Rodas, 2007; Salazar, 2010; Yaranga, 2014).
Sampling
We collected five samples starting at 21 d after planting (DAP) with a frequency of 10 d until 65 DAP. In each of the plots, ten maize plants were randomly selected for analysis.
Parameters evaluated
Soil area: An imaginary circumference was traced around the apexes of all the leaves of the plant and was recorded in cm2.
Leaf area of the plant: All the leaves of each plant were placed on a white sheet at a distance of10 cm apart; they were photographed, and the leaf area was determined with ImageJ software (Newton et al., 2020).
Fresh weight: The fresh weight of all parts of the plant was recorded as follow: leaves, stem, and roots using a 0.01 g precision scale.
Dry weight: All plant parts were placed in paper bags and into a drying oven at 80°C for 72 h; the weight was then recorded on a 0.01 g precision scale.
Growth rates were determined from measurements of leaf area, soil area, and dry weight (Tab. 1).
TABLE 1 Formulas and units for growth rate indices in plants (Melgarejo, 2010).
Ln: natural logarithm; W1 and W2: dry weight 1 and 2; T1 and T2: time 1 and 2; LA1 and LA2: leaf area 1 and 2; SA: soil area.
Statistical analysis
Python 3.6 software with Panda, Numpy, Pingouin, and Matplotlib libraries were used. Initially, the growth index, leaf area index (LAI), and leaf area ratio (LAR) were used as growth indices. Descriptive analyses were performed using box plots to determine the distribution of block treatments and days after planting. Descriptive results were obtained to show the presence of outliers and asymmetric distributions. Subsequently, completely randomized block design tests and assumptions of normality, constant variance (equality of variances in treatments), independence (P>0.05), and interaction plots were applied. Finally, a multiple pairwise comparison analysis (post hoc comparison) was performed using the Tukey's HSD test.
Results and discussion
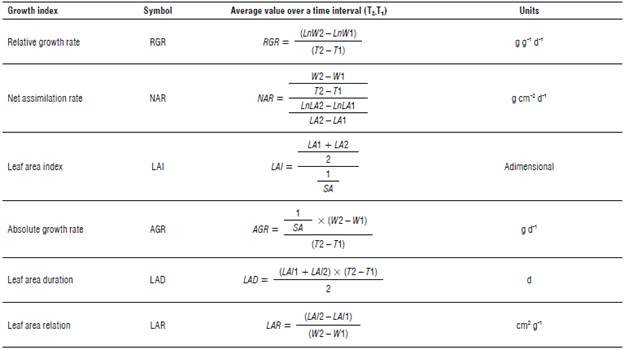
Leaf area index
The leaf area index (LAI) is a measure that evaluates physiological aspects and the total amount of photosynthetic radiation absorbed by the plants. A higher LAI is associated with an increase in biomass production (Barraza et al., 2004; Zavala-Borrego et al., 2022). In the maize treatment associated with peanut, a value of 0.3 was observed at 25 DAP; this value gradually increased until reaching a maximum value of 0.5 after 55 DAP. The association of maize and cassava did not show a significant variation, but it did show a similar behavior to the previous treatment, reaching its maximum value at 45 DAP with an LAI of 0.4 (Fig. 1).
In the maize-peanut-cassava association, the LAI was higher than 1.0 during the first 25 DAP and then progressively decreased to a value of 0.3 at 45 DAP; this subsequently increased to 0.6 at 55 DAP. The variability in LAI can be attributed to temporal and spatial differences as well as to factors affecting the crops, since this association involves the presence of multiple species; and greater variability is to be expected due to the influence of diverse factors (Nafarrate, 2017).
The monoculture maize treatment obtained its maximum LAI value at 35 DAP, later reaching the lowest value at 55 DAP compared to the other treatments. In general, it can be observed that the LAI in the different associations shows maximum values after 30 DAP, indicating that there is a greater capacity of the plant to take advantage of energy after 30 DAP (Castellanos et al., 2017). These findings coincide with the vegetative development of maize plants at the V10 stage that corresponds to the presence of 10 true leaves (Castellanos et al., 2017), at which time the maximum uptake of solar radiation and its transformation into biomass occurs, with most of the assimilates to be used in the formation of the cob (Rincón et al., 2007). However, these values for the association of maize, cassava, and peanut, and maize in monoculture decreased during this stage. According to Barrera-Violeth et al. (2017), this could be attributed to the effect of shading generated by the leaves within the crop itself that limits the assimilation of solar energy.
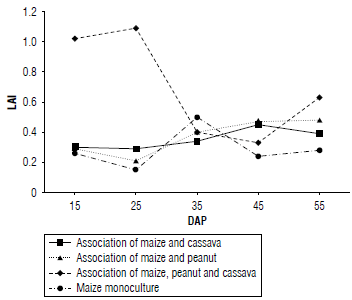
Leaf area ratio
The leaf area ratio (LAR) represents the relationship between photosynthetic activity and the cost of respiration (Hernández et al., 1999). In Figure 2, the highest values of LAR were found in the initial stages of the crops, gradually decreasing as time progressed.
In the association of maize and peanut, the maximum LAR value was reached at 35 DAP, with 180 cm2g4. The other treatments showed similar behavior in terms of LAR values. In each of the treatments, the highest values were recorded at the beginning of the crop and then gradually decreased as the maize crop aged. The association of maize, peanut, and cassava showed the highest LAR during the first 25 DAP, reaching a value of250 cm2 g 1 . However, a progressive decrease was observed, reaching 50 cm2 g 1 . LAR tends to be high at the beginning of a crop's growth and decreases as developmental stages advance (Orozco-Vidal et al, 2016). This is because plants allocate most of the photoassimilates to the development of their photosynthetic apparatus; and as the crop progresses, the plant deposits carbohydrates in its reproductive organs. In addition, during the initial stages of development, the plant is mainly exposed to photosynthetic activity and the generation of leaf tissues, meaning a low cost of respiration (Ayala, 2016).
The association of maize, peanut, and cassava showed higher LAR values during the first 30 DAP, this is because the presence of more species in this treatment favors the production of a greater number of leaves. During this initial stage, the plants are in their vegetative development phase, implying significant leaf growth and, therefore, an increase in the LAI (Hernández et al, 1995). With respect to the peanut and maize association, LAR increased between 25 and 35 DAR This increase can be attributed to the growth in leaf size during this period. In general, all treatments showed a decreasing trend in LAR as time progressed. This phenomenon may be related to the fact that, as the plants grow, there is an increase in overall plant size, but a decrease in the increase of leaf area (Guevara & Guenni, 2007).
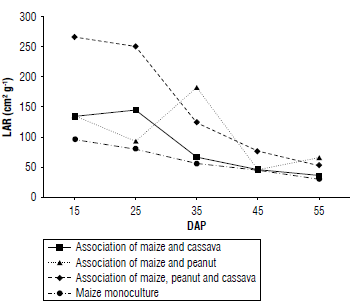
Leaf area duration
The leaf area duration (LAD) is a variable that represents the relationship between the photosynthesizing surface and the soil area occupied by the crop (Santos et al., 2010). So it is useful to determine the productivity and water requirements of crops. In this sense, the LAD allows for estimating the water requirements, nutritional and bioenergetic efficiency and determines the possible phytosanitary damages that the crop may have in its growth process (Mendoza-Pérez et al, 2017).
Figure 3 shows that the associations of maize and cassava and maize and peanut were similar in their LAD values at 25-35 DAP, reaching an average value of 3.1 d. However, both the association of maize and peanut, as well as the association of maize, peanut, and cassava, increased at 45-55 DAP with a value of 4.8 d, followed by the association of maize and cassava that showd a value of 4.2 d. The maize monoculture was the one that showed the lowest LAD, reaching a value of 2.6 d at 45-55 DAP.
The associations showed an increase in the LAD as time progressed. This increase was because the maize plant, after germination, went through a vegetative development stage that extends up to 60 DAP. In the associations of maize, peanut, and cassava, a higher LAD was observed compared to the maize monoculture, indicating a greater production of leaves during the vegetative growth stage of maize (Aguilar-Carpió et al., 2015).
The increasing trend of all associations in general is related to the constant formation of leaf structures and biomass. This is because plants are in a constant process of capturing solar radiation over time, stimulating the growth and development of leaves (Soplin et al., 1993; Aguilar-García et al, 2005).
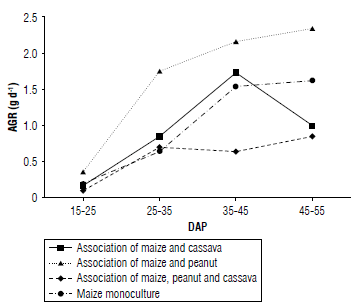
Absolute growth rate
The absolute growth rate (AGR) is used to measure the increase in dry mass over a given period (Barrera-Violeth et al, 2017). In the maize and peanut association, a significant increase was observed from 15-25 DAP to 25-35 DAP, reaching an AGR of 1.8 g d4. Then, between 45-55 DAP, this association reached its highest value with an AGR of 2.4 g d4. These results indicate that this association experienced a rapid increase in the production of dry matter compared to the other associations and the monoculture (Almanza-Merchán et al, 2016).
In contrast, the AGR of the maize-cassava association, as well as that of maize in monoculture, showed a similar trend during crop development, reaching values above 1.5 g d4 up to 35-45 DAP. However, in the case of the association of maize and cassava, a later decrease was observed, reaching 1.0 g d4 at 45-55 DAP (Fig. 4). During the vegetative stage of maize, the plants require a high amount of nutrients, and when these are insufficient, there may be a decrease in photosynthesis and in the production of assimilates (Sánchez-Olaya étal, 2019). This could explain the decrease in AGR observed in this association, suggesting possible nutrient deficiencies.
In the association of the three crops, a significant increase in AGR was not observed. However, it reached its maximum value of 2.3 g d-1 at 45-55 DAP. In comparison, the maize monoculture at 45-55 DAP had a value of 1.6 g d-1. In general, the association of maize and peanut showed the highest AGR as a function of DAP (Fig. 4). An increase in AGR was observed from 35-45 DAP for all treatments, except for the maize and cassava association. Possibly at this stage the plant was in its vegetative growth phase that implied a greater photosynthetic capacity and, therefore, higher biomass production (Barrera-Violeth et al, 2017).
Relative growth rate
Relative growth rate (RGR) is an important parameter for analyzing plant performance, since it represents the biomass gain at a given period of time. RGR reflects the morphological and physiological adaptations of plants in different environments and can be used as a measure of plant growth success (Gil & Miranda, 2007; Mayo-Mendoza et al, 2018).
The association of maize with cassava reached its highest RGR at 25-35 DAP, with a value of 0.15 g g-1 d-1, and then it decreased considerably until 45-55 DAP with an RGR lower than 0.04 g g-1 d-1 . The association of maize and peanut showed greater variability compared to the other treatments. The maximum value was 0.12 gg-1d-1 between 35-45 DAP, decreasing progressively until 45-55 DAP. The RGR of the association of maize, peanut, and cassava decreased after 35-45 DAP until the association reached a value of 0.05 gg-1 d-1 at 45-55 DAP. Finally, the maize monoculture showed no significant variation, remaining in a range of 0.10 to 0.08 gg-1 d-1 (Fig. 5).
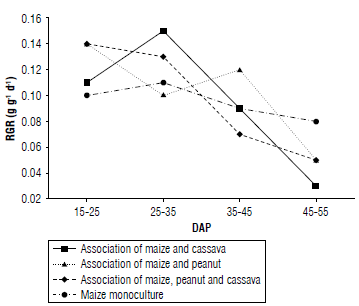
FIGURE 5 Relative growth rate (RGR) behavior in relation to treatments and days after planting (DAP).
In general, a considerable reduction in RGR is observed in all treatments as DAP increases. This decrease can be attributed to the change of plants from vegetative to reproductive stages and preparation for fruit/seed growth. As the crop progresses, the decrease in RGR becomes constant (Almanza-Merchán et al, 2016).
Differences in RGR between treatments are due to species-specific characteristics (Sánchez-Olaya et al, 2019) since significant differences in RGR values may result from interactions between species and mutual influences on their growth.
The RGR at the beginning of the crop shows high values and then decreases progressively at the end of the vegetative stage of the plants (Barrera-Violeth et al, 2017). Due to this, it is evident that the maize and cassava treatment had a higher RGR value compared to the others, reflecting the highest value for this association. However, the association of maize and peanut had a significant decrease in behavior at the beginning of the crop. The reduction could be attributed to competition between both species during the process of establishment and colonization of space in the soil; such competition may influence the behavior of the RGR (Mayo-Mendoza et al, 2018).
Net assimilation rate
The net assimilation rate (NAR) in crops refers to the capacity of plants to accumulate dry matter that, in turn, determines their efficiency. The NAR allows for evaluating plant efficiency of biomass accumulation (Cardona et al, 2021). López-Sandoval et al (2018) mention that NAR is a measure that reflects the efficiency of the foliage that is the principal source of photosynthates for dry matter production.
The associations of maize and peanut and maize and cassava presented a similar trend in the NAR; both treatments reached their maximum values at 25-35 DAP and then decreased until 45-55 DAP. In the association of maize, peanut, and cassava, a variation in the NAR was observed at 25-35 DAP, with a value of 0.002 g cm-2 d-1 followed by a decrease at 35-45 DAP. In contrast, maize in monoculture showed a different trend compared to the other treatments (Fig. 6) since it reached its highest NAR at 45-55 DAP with a value of 0.0075 g cm-2 d-1 suggesting that maize in monoculture achieved greater efficiency in the utilization of its foliage in that period compared to the other associations.
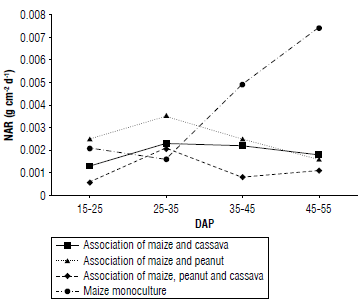
FIGURE 6 Net assimilation rate (NAR) behavior in relation to treatments and days after planting (DAP).
Shading caused by the joint growth of crops in the associations may have led to a reduction in the photosynthetic capacity of the lower leaves due to the shade cast by the upper parts of the plants. This results in a decrease in NAR due to increased biomass production by the different species in the association. In contrast, the maize monoculture, being the only species present, has a lower amount of biomass, suggesting a higher NAR (López-Sandoval et al, 2018).
This indicates that the population density of the species interferes with the NAR (Aguilar-Garcia et al, 2005). In addition, the maize monoculture has higher increments compared to associations, suggesting that maize is better adapted to open spaces under monoculture conditions (Mayo-Mendoza et al, 2018).
Conclusions
The growth stage of plants plays a crucial role in LAI and LAR, since in the early stages, growth focuses on the development of leaf tissues and photosynthetic apparatus, while in later stages growth allocates more resources to reproductive organs. This implies the need to consider the growth stage to optimize the relationship between photosynthetic activity and the cost of respiration.
Competition between species can affect initial growth, but certain associations, such as that of maize and cassava, can result in greater biomass gain over time as observed in the RGR. In turn, the NAR is influenced by the population density of the species and the interactions between them, since shading caused by the joint growth of the crops can reduce the photosynthetic capacity of the lower leaves and decrease the NAR.
These results highlight the importance of considering species diversity and species interactions to maximize the capture of solar radiation and to optimize biomass production in agriculture.

