


 English (pdf)
 Article in xml format
 Article references
 Send this article by e-mail
 Cited by SciELO
  Cited by Google
  Similars in
SciELO
Similars in
SciELO  Similars in Google
 Permalink
Introduction
Quinoa (Chenopodium quinoa Willd.) is an Andean seed widely cultivated by pre-Columbian communities. Its marginalization and replacement began with the conquest of America and the introduction of cereals such as barley and wheat (FAO, 2011).
One of the critical points in the cultivation of quinoa is the need to preserve the seeds to ensure that they are available over a long period of time. The start of the harvest is delayed until the seed reaches 14% moisture w.b. (wet basis), which is the marketing base and the seed moisture limit for temporary storage. The delay in harvesting increases the probability that the crop will be affected by rainfall and pests. The early seed harvest is used when its moisture is around 30% w.b. The alternatives for this practice are chemical desiccants or convective drying (Cuniberti, 2015).
In his study of convective drying, Garnero (2006) employed air temperatures between 40°C and 12°C for periods of 0.5 to 4 h. For wheat, the maximum air-drying temperature recommended is 90°C. The seed temperature must not exceed 50°C or 60°C to maintain an acceptable quality for seed use in industry. The optimum drying temperature should be lesser than 80°C because lysine content is destroyed by higher temperatures. As a general rule, in most countries, a maximum drying air temperature of 90°C has been adopted (Garnero, 2006). During quinoa drying, the thermal process modifies the digestibility of the seed protein and starches. This chemical alteration depends on various parameters: the variety and the processing conditions, temperature, pH, and the presence of oxygen (García Pacheco et al., 2019; Neji et al., 2022).
Different researchers (Wahengbam et al., 2019; Sozzi et al., 2021) designed mathematical models to study the moisture transfer process in the food structure using the classical theory of diffusion. These studies have generally been carried out in seeds whose geometry can be assumed to be spherical or cylindrical. The study of food matrices drying kinetics is important for the design and control of different drying process (Zhou et al., 2017; Chua et al., 2018; Moscon et al., 2020; Haripriya et al., 2021). The mathematical models that were validated with experimental data are appropriate alternatives to describe the operating conditions to design a dryer or to convert a batch process into a continuous process.
The present work was oriented to study the Hualhuas variety of quinoa, using a more industrial vision than the published antecedents. Estimated coefficients were the effective diffusivity (Deff) and the mass transfer (k). The parameters obtained by the model are suitable to designing industrial equipment or to convert a batch process into a continuous process.
Materials and methods
Raw material and sample preparation
Five kg of quinoa seeds (Chenopodium quinoa Willd. var. Hualhuas), suitable for consumption, was purchased at the Zucchi Distributor (Rosario, Santa Fe, Argentina). The quinoa employed in this study was native to Trujillo, Peru (8°6'57.56" S, 79°1'47.93" W).
Drying experiments
The temperatures were selected based on the other studies. Vilche et al. (2003) tested the temperatures 30°C, 50°C, 70°C, and 90°C. Ramos Gómez and Peña Rivera (2019) dried quinoa grains at 40°C, 5 0°C, and 60°C. Paquita Ninaraqui (2015) studied the Salcedo Inia variety of quinoa and used temperatures of 50°C, 60°C, and 70°C. Carciochi (2014) used temperatures of 100°C, 145°C, and 190°C. As a generally accepted standard in most countries, a maximum drying air temperature of 90°C has been established (Garnero, 2006). Considering the aforementioned, temperatures of 40°C, 60°C, and 80°C were selected for this study.
During the drying, the speed of the air must not be so high as to cause the entrainment of solids. Typical drying air velocities in industrial dryers range from 0.7 to 3.0 m s-1 (Perry, 1992). Vilche et al. (2003)) used a drying air speed of 0.3 m s-1. The laboratory dryer selected for this research operated at two speeds: 0.2 and 0.7 m s-1.
The drying treatments were carried out using a pilot-scale oven (Tecno Dalvo, Model CHC/F/I, Argentina). For each experiment, 0.200±0.001 kg of quinoa grains were weighed. The grains were placed in a stainless-steel mesh to allow the circulation of the air. The drying experiments were carried out in triplicate.
The sample moisture content was determined gravimetrically according to the AOAC 945.15 technique (AOAC, 1990); 0.002±0.001 kg of grains were weighed in aluminum capsules previously tared, then dried in an oven (Sific, Argentina) for 3 h at 103±2°C. The sample was cooled to room temperature in a desiccator before being weighed.
Flour milling and sieving
The seeds were processed for 15 s in a blade mill (IKA, Germany). The flour was kept in plastic bags until use.
Flours grading was determined by a Ro Tap sifter (Tyler, USA) equipped with 16 (1000 цгп), 25 (679 цгп), 50 (289 цгп), 100 (149 цгп), 200 (74 цщ), and 270 (53 mm) U.S meshes. 0.1 kg samples were sieved and shaken for 5 min. Finally, the fractions of flour retained in each sieve were weighed and the retention percentage was calculated. The final mean value size was obtained in triplicate.
Mathematical modeling of the drying operation
Quinoa seed sphericity
Sphericity is the degree of approximation of a seed to a sphere and in any seed it is a function of its physical dimensions (length, width, and thickness). The quinoa seed sphericity was calculated using the following expressions (Gallegos Ramos et al., 2022):
where:
ф is the dimensionless sphericity;
Dg is the geometric mean seed diameter in mm;
L is the seed length in mm;
A is the seed width in mm;
e is the seed thickness in mm.
Measurements of the seed length, width and thickness were made in triplicate with a caliper (precision 0.05 mm) as shown in Figure 1. For the determinations, a sample of thirty grains was taken at random.
Considerations for the drying model application in GAMS
Because the constant drying period in most foods is very short and the critical humidity is practically equal to the initial moisture, only the period of decreasing rate was considered.
A mathematical model based on the law of conservation of mass was proposed to describe the moisture profile of the samples during the drying process. The following hypotheses were considered:
Water diffuses to the surface of each particle, according to Fick's second law;
The diffusion phenomenon is the predominant mass transfer process;
Water evaporation takes place only at the surface level;
The moisture on the surface is in equilibrium with the drying air;
The air temperature remains constant. There is enough airflow to evaporate the internal moisture content through the mesh used;
Moisture diffusivity depends on moisture content and temperature;
Drying takes place over the entire grains surface, since a stainless steel mesh sheet is used;
The air flow is large enough to keep constant drying conditions (humidity, temperature) throughout the material. Grains reaches drying air temperature;
Heat generation inside the material and radiation effects are negligible;
The air is perfectly mixed inside the stove and the air flow characteristics are invariable;
Due to the small size of the seed, its density is considered constant during the drying process;
The seeds are considered as spheres with a diameter (D) of 1.99 mm.
Mass transfer model
The mathematical expressions used were written in spherical coordinates, which were fixed in the geometric center of the grain.
The radial diffusion model of moisture transfer was used to study the time evolution of the radial distribution of the local moisture content during drying.
Fick's second law was applied to describe the diffusion of moisture within qu inoa grain with radio R, as in Equation 3.
where HS is the grain moisture content; ps is the grain density; Deff is the effective diffusion of the moisture content; t is the drying time, and Rs is )he radius of the solid grain.
The initial and boundary conditions tha t wer e used to solve the equation are:
a) Initial condition
At the sta=t of the dryi ng operation th e moisture content of the grain was u n iform.
b) Symmetry condition
c) Due to symmetry, Üiere wa2 no moisture gradie nt. The bfundary conditions at the center were:
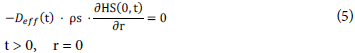
d) Boundary condition at the interface for convective drymg
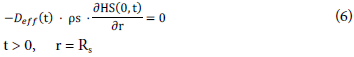
A convective mass transfer phenomenon was considered from the rurface of the grain to trie bulk air (Eq. 6). HS eq and k are the e=uilibrium m oisture content of the dry solid and the external mass transfer coefficient, respectively.
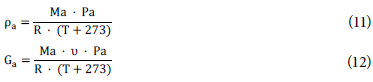
The mass transfe° coefficient (k) was calculated using the Sherw=od number (Sh). It was determined by Mills and Coimbra (2015) wi(h EquatioSis 7-12:
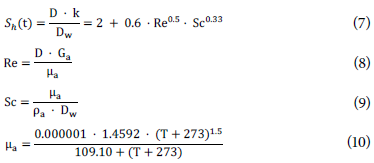
where
Dw is water vapor diffusion in air (cm2 s-1);
Re is Reynolds number;
Sc is Schmidt number;
Ga air mass flow rate (g с m-2 m in-1);
µa is air viscosity (g cm-1 min-1);
Ma is air molecular we ight (g mol-1) ;
Pa is water vapor rjressure in air (Pa);
v is air velocity (cm s-1).
An Arrhenius-type equation was employed to evaluate the eRfective diffusivity of the m oisture:

wh=re Deff is the effective diffusivity and the parameters A, B and C are predicted by the model.
The average moistu re co ntent < H S > at each instant was obtained by integrating the local moisture content over the volume (V). Specifically, the average moisture content was expressed аз stated in Equation 14, which can be solved using the trapezoidal rule.

Problem solving strategies
The differential e quations were discretized to become algabraic equations and then implemented in the GAMS soft-ware. Tharefore, Equations 3 to 6 were discretized using ihe implicit central finite di fference method (CFDM).
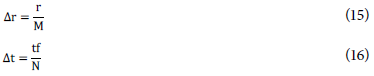
Spatialand temporal variations were defined by Equations 15 and )6 respectively with M=9 and N=100. M and N were ctetermined before and both guarantee the stability of the solution.
The nonlinear programming model was executed in the software GAM S using the; solver CONOPT (Singh & Heldin an, 2008).
At the beginning, the model was used to calculated the parameter of the effective diffusion (Eq. 13)- The objective of this step was to evaluate the model performance and the correlations used. Then, the obtained diffusion coefficient parameters values were fixed. An objective function (Fo) was implemented (Eq. 17), which was based on the minimization of the root me an squ are error (RMSE) of the experimental and predicted moisture content data.
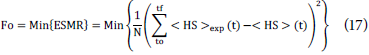
where <HS>exp is the experimental average humidity, <HS> is the average humidity predicted by the model, and N is the number of experimental data.
To estimate the mass transfer coefficients, correlations reported in the literature were used in order to reduce the degrees of freedom of the model and to facilitate the resolution of the Non Linear Programming (NLP) models. The resulting model involved 4,052 variables and 3,547 constraints.
Statistical analysis of the data
Experimental results were obtained in triplicate and were presented as mean ± standard deviation (SD). The statistical analysis was carried out using the Minitab program (Pennsylvania, USA), performing analysis of variance, with comparison of treatment means using the Tukey test (P<0.05). For the resolution of the drying model, the GAMS software (Washington, USA) was used, which solves models based on algebraic equations.
Results and discussion
Drying model application
Table 1 presents the water diffusion coefficient averaged over time, the mass transfer coefficient, and the root mean square error (RMSE) for the assayed model. The MSE is acceptable. The model describes the operation of drying satisfactorily and has a high goodness-of-fit.
TABLE 1 Adjustment data obtained by applying the drying model.
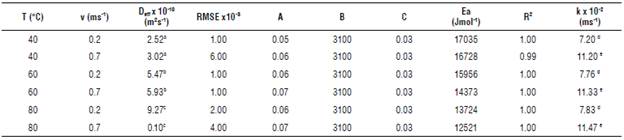
Different letters indicate significant differences using Tukey's test (P<0.05). T: drying temperature; v: air velocity; Dell: effective diffusion coefficient; RMSE: root-mean-square error, A, B, and C: parameters from effective diffusivity equation; Ea: activation energy; R2: coefficient of determination; k: mass transfer coefficient.
The water effective diffusion growth increased with increasing of the drying air temperature. As expected, the higher the temperature of the drying air, the greater the mobility of the water from the interior to the surface of the grains (Fabani et al., 2020). This results in an increase in the effective diffusivity of water and mass transfer. The effective diffusivity presented significant differences (P<0.05) concerning the drying air temperature. The results obtained were similar to those reported by other authors (10-11 and 10-8 m2 s-1) (Bravo et al., 2009).
Noroña Gamboa (2018) evaluated the drying kinetics of barley, wheat, and corn seeds using drying temperatures of 40 and 60°C and an air flow rate (1.1 m s-1). The diffusions coefficients obtained were in a range of 1.39x10⁻¹⁰ - 1.83x10⁻¹⁰ m2 s-1 for corn, 2.32x10⁻¹¹ - 7.84 x10⁻¹¹ m2 s-1 for wheat and 4.30x10⁻¹¹ - 1.41x10⁻¹⁰ m2 s-1 for barley.
Janampa Arango (2017 investigated the effective diffusivity during convective drying at 60°C and an air speed of 4.5 m s-1. The following values were obtained for the different varieties of quinoa: Black Collana (5.73 x 10⁻¹¹), Black Ayrampo (5.73 x 10⁻¹¹), Pasankalla (1.05 x 10⁻¹⁰), Yellow Composite (5.23 x 10⁻¹¹), and Rosada de Juli (5.13 x 10⁻¹¹).
According to Paquita Ninaraqui (2015), high Ea values indicate low sensitivity of the diffusion coefficient with respect to temperature. Lowest values were obtained for highest air drying temperature and velocity (80°C and 0.7 m s-1) (Tab. 1). Similar values were reported by Vega Gálvez et al. (2010), Noroña Gamboa et al. (2018)), and Aravindakshan et al. (2021).
The mass transfer coefficient increased with increasing temperature and velocity of the drying air. It was significantly influenced (P<0.05) by the drying air velocity. A higher speed of the drying air promotes the renewal of the drying air, avoiding its saturation; it produced an increase in the mass transfer coefficient.
Model validation
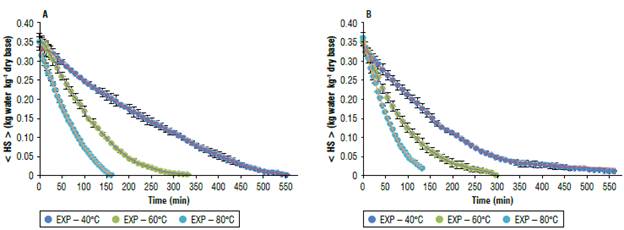
Figures 2 shows the experimental and model-estimated average moisture values for quinoa grains at different temperatures (40°C, 60°C, and 80°C) and drying air speeds (0.2 m s-1 and 0.7 m s-1). The proposed model accurately describes the drying kinetics for quinoa grains for all the operating conditions tested.
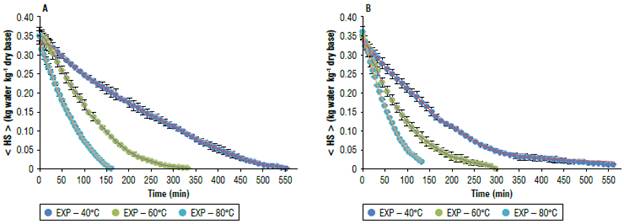
FIGURE 2 Experimental and model-predicted drying curves for the three drying temperatures tested. A) speed of the drying air, v1= 0.2 m s-1; B) speed of the drying air, v2= 0.7 m s-1. < HS >: average humidity. Error bars is standard error.
The development of the experimental design resulted in six runs. A portion of the data set (3 runs) was independently acquired to obtain A, B, and С from equation 13. The other experimental runs were implemented to validate the proposed model using the estimated coefficients.
Grading quinoa flour curve
Figure 3 shows flour grading curves obtained by grinding the dried seeds.
Table 2 shows the performance of quinoa flour retained in a 50-mesh sieve. According to the PROINPA (2011) classification, the flour obtained for 50 mesh (minimum granule size of 0.297 mm) corresponds to bran (granule size between 0.487 and 0.23 mm).
TABLE 2 Quinoa flour (50-mesh) performance to different treatments.
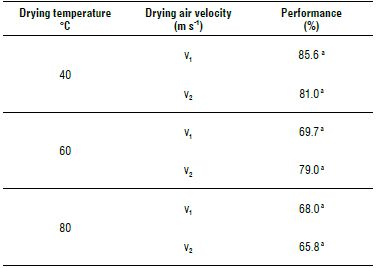
Different letters indicate significant differences according to Tu key's test (P<0.05).
This permits its use for balanced foods, whole meal bread, bakery, biscuits, pasta, purees, soups, and creams.
In grinding performance for the two drying air speeds or the three drying temperatures tested, significant differences (P>0.05) were not found.
Ortega Guerrero et al. (2013) used a series of Tayler sieves (14, 30, 60, 100, 200, and bottom) and reported 45.35% retained for 100 mesh. Likewise, Castro (2010) obtained 33.04% for 60 mesh for the unpolished Matarredonda variety quinoa flour. The variation in the granulometric analysis could be due to the variety of quinoa and the drying and grinding processes used in the evaluation.
Cerezal Mezquita et al. (2011) made the granulometric profile of quinoa flour obtained from the Nestlé Company (Chile). They used a vibrating sieve equipment and observed that 53.91% of the sample was retained in sieves N° 30, N° 60 (250 цгп) and N° 80 (180 цгп). The remaining 46.09% of flour remained in the sieve end collector.
In this study, higher yields were found in the milling compared to the antecedents published in literature. This situation may be due to the quinoa variety and the grinding equipment.
Conclusions
This study presented information on the conditioning, industrial drying, and milling of quinoa grains of the Hualhuas variety.
The proposed model accurately described the drying kinetics for quinoa grains for all the operating conditions tested. The computational time required to implement the numerical solution was 0.078 s.
The effective diffusivity presented significant differences (P<0.05) concerning the drying air temperature. The mass transfer coefficient increased with increasing temperature and velocity of the drying air and was significantly influenced (P<0.05) by the drying air velocity. The parameters obtained by the model are suitable for designing industrial equipment or converting a batch process into a continuous process.
From the industrial point of view, the drying treatment at 80°C and 0.7 m s-1 required less time and presented higher effective moisture diffusivity and mass transfer coefficients. However, it is necessary to evaluate the costs and final product quality to decide which is the optimum. It is also appropriate to study the bioavailability of the proteins to find out if they are affected by the drying temperature.

