I. INTRODUCTION
AISI 1020 steel is characterized by a combination of high ductility and good strength, as well as by its ability to be easily machined. Due to these properties, it is often used in a variety of engineering applications, which include but are not limited to axles and automotive parts such as cams manufactured by machining.
Turning is a single-point cutting process in which a tool is used to remove material from a rotating cylindrical workpiece. After the machining process, the resulting surface roughness is important due to its role in evaluating the quality of the manufactured component. Irregularities in the workpiece surface, which may form sites for nucleation of corrosion and cracks, can affect its performance. Therefore, selecting optimized cutting parameters is fundamental to achieve the required surface quality.
The effects of turning parameters on the surface roughness were investigated by several authors on different materials: duplex stainless steels [1], AISI 304 stainless steel [2], AISI 1050 steel [3], nickel based Hastelloy [4], red brass [5], and aluminum 6061 [6]. These studies included a variety of experimental values of cutting parameters, but all the processes were carried out in dry conditions. However, recent analyses of the effect of coolant showed that lower surface roughness was achieved on components machined with coolant, as compared to those without a supply of coolant [6,7]; they also reported an improvement in the machinability characteristics of the workpieces.
Further studies are still required to clarify the effect of cutting conditions on surface roughness; moreover, few results have been reported on the optimization of turning process parameters on AISI 1020 steel. Therefore, this work aimed at providing a better understanding of the influence of cutting parameters such as cutting speed (Vc), feed rate f), and depth of cut (d) on the surface roughness induced in annealed AISI 1020 steel, when machined by turning using carbide insert tools. The intent was to develop a regression model useful for predicting an optimal surface finish.
II. EXPERIMENTAL PROCEDURE
In this investigation, the material used was a round bar of commercial AISI 1020 steel (0.18 ± 0.01% C, 0.035 ± 0.001% S, and 0.40 ± 0.01% Mn), cut in cylinders of 31.75 mm in diameter and 170 mm in length. The samples were annealed at 910 °C for one h, followed by slowly cooling inside the furnace, thus achieving a homogenized microstructure.
The work specimens were turned with a cut fixed length of 100 mm in a numerically controlled lathe; all tests were carried out with ISO code DCMT 11T308MU carbide inserts and abundant quantity of water-soluble oil as coolant. A new insert's edge was used for each experiment, to guarantee equal cutting conditions and ensure the absence of changes in the surface properties of the material due to tool wear [8,9].
The experiments were designed using a technique of variables [10]. Three levels were considered for feed rate, three levels of depth of cut, and two levels for cutting speed, for a total of 18 combinations, with two repetitions each run. The maximum and minimum limits (Table 1) were selected based on previous researches with similar steel [11] and restrictions by the lathe.
After turning, the roughness of the machined surface perpendicular to the feed marks. Four measurements (Ra) was measured using a Mitutoyo, Surftest at randomly chosen locations of the surface were made 211 Profilometer by positioning the instrument for each sample to calculate the average value of Ra.
Then, the mean values of surface roughness for each combination of parameters were compared through the statistical Pareto-ANOVA, to identify the importance of each parameter and their percentage influence. In the analysis, the depth of cut (d), feed rate (f) and cutting speed (Vc) were the independent variables, while the surface roughness (Ra) represented the dependent variable. The significance level was based on the P-value [12]:
Insignificant if P > 0.10
Mildly significant if 0.05 < P < 0.10
Significant if P < 0.05
Finally, a statistical mathematical expression was derived for the prediction of the surface roughness, using multiple linear regression methods [12].
III. RESULTS AND DISCUSSION
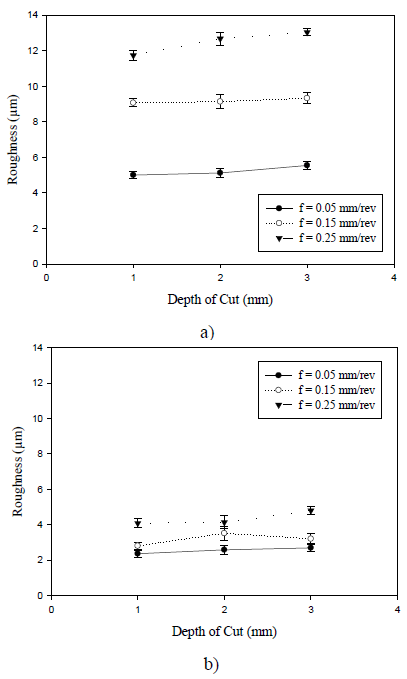
The depth of cut positively influenced surface roughness: roughness increased with increase in depth of cut (Fig. 1). This trend is because higher values of depth of cut produce more thrust force [13], which increases roughness due to a greater deformation of the chip that is more violently pushed against the machined surface, resulting in a worse surface finish. A very small increment in roughness with the depth of cut is indicated by the slopes of the curves, resulting in minimum and maximum differences values of 3% and 18%, respectively, for fixed cutting speed and feed rate.

FIG 1 Roughness plotted against depth of cut for turned annealed AISI 1020 steel, with a cutting speed of (a) 20 m/min; and (b) 70 m/min.
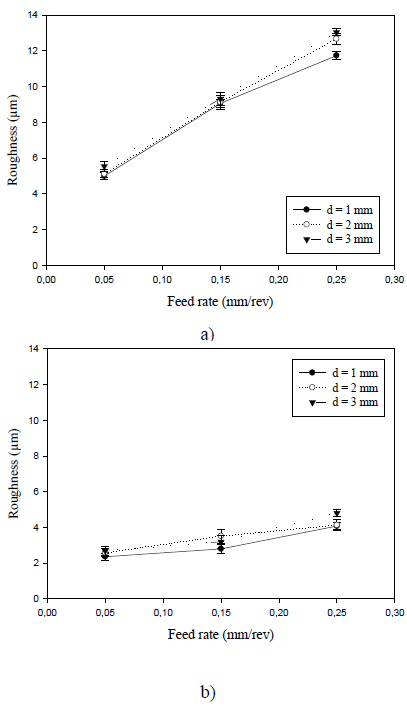
Figure 2 shows the effect of feed rate on surface roughness. Similar to depth of cut, roughness raises constantly with feed rates, but in a much greater slope. This fact is related to the grooves left along the surface of the machined sample as the cutting tool moves, whereby with an increase in feed rate a greater separation between consecutive positions occurs. The experimental results showed that the roughness differences corresponding to a fixed cutting speed and depth of cut have values between 60% and 147%.

FIG 2 Roughness plotted against feed rate for the turned annealed AISI 1020 steel, with a cutting speed of (a) 20 m/min; and (b) 70 m/min.
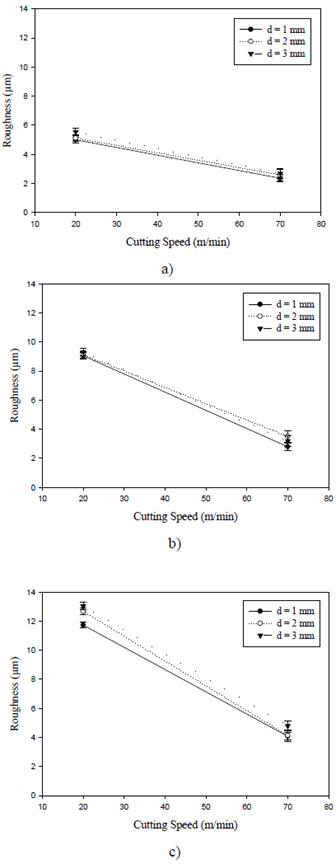
Regarding the effect of cutting speed on surface roughness, the latter decreased with higher values of cutting speed (Fig. 3). The main reason for this can be that at higher cutting speeds the temperature increases because the material removal is more violent, producing the phenomenon of softening that improves the cutting process and thus diminishes superficial roughness [14]. Moreover, when the turning is performed at a low speed, a subsurface material fracture occurs, which contributes to increasing surface roughness; by increasing the cutting speed this effect disappears. The results showed differences in roughness for fixed feed rate and depth of cut, of 99% and 223%, respectively.

FIG 3 Roughness plotted against cutting speed for the turned annealed AISI 1020 steel, with a feed rate of (a) 0.05 mm/rev; (b) 0.15 mm/rev; and (c) 0.25 mm/rev.
The analysis of variance (ANOVA) performed on the experimental data is summarized in Table 2; the results confirmed that cutting speed (Vc) and feed rate (f) are significant factors affecting the surface roughness (P < 0.05), while depth of cut (d) is mildly significant (0.05 < P < 0.10). This analysis was carried out for a confidence level of 95%.
Figure 4 shows the percent contributions of each parameter on surface roughness. The length of each bar is proportional to the absolute value of its associated contribution or estimated effect. According to the performed Pareto chart, cutting speed was found to be the major factor affecting roughness values (69.35%), whereas feed rate was found to be the second-ranking factor (30.13%); the percent contribution of depth of cut plays a negligible role (0.52%).
The regression analysis of the input parameters for predicting surface roughness is expressed in equation (1).
Values for R2 and R2 adj are above 90%, indicating that the obtained model it is on the higher side of the acceptable limit. Finally, the low value for the standard deviation (S) indicates that this expression is adjusted to the experimental data [15].
Figure 5 depicts the normal probability plot for the model; it reveals that the residuals fall in a straight line, implying that the errors are distributed normally, and show that the dependability of the expression is completely proven [12].
IV. CONCLUSIONS
For the range investigated, we can conclude that surface roughness increases when depth of cut (d) and feed rate (f) increase, while decreases with higher cutting speeds (Vc). Furthermore, cutting speed contributes 69.35%, feed rate 30.13% and depth of cut 0.52 % to surface roughness. Finally, the developed mathematical expression can be used to predict optimum cutting parameters for minimum surface roughness.


