I. INTRODUCTION
Recently, nanotechnology has become one of the main transformation technologies; it is useful to develop new products in industries due to the exploration of new processes and theories, thus stimulating the economic growth of each country.
Many of the policies of the Organization for Economic Cooperation and Development (OECD) and it's Sustainable Development Goals (SDGs) require the use of nanotechnology. It has a direct impact on SDG 2 (Zero hunger: achieve food security and improved nutrition and promote sustainable agriculture); SDG 3 (Good health and well-being: ensure healthy lives and promote well-being for all at all ages); SDG 7 (Affordable and clean energy: development of nanomaterials for more sustainable energy); SDG 9 (Industry, innovation, and infrastructure: making contributions in innovation and technological progress for the generation of durable solutions), and SDG 14 (Life below water: whith technologies that reduce pollution and acidification of the oceans are required). However to achieve each goal it is necessary to consider SDG 6 (Clean water and Sanitation: healthy life, food security, protecting and restoring the sustainable use of ecosystems, i.e. ensuring a good quality of life) (OECD) [1].
The different applications of nanotechnology are based on the development of products of the nanometric order (1×10⁻⁹m), between 0.1 and 100 nm, such as Nanomaterials (NMs) and nanoparticles (NPs). Due to their scale, they can present better mechanical, electrical, and magnetic characteristics with more versatile applications than those obtained with macroscale objects. Moreover, their different fields of application are of great interest, for example, in medicine [2]-[6], agricultura [7]-[9], energy [10]-[12], robotics [13]-[16], food alternatives, and environmental protection [17]-[19].
A. Risks to Health and the Environment
The use of nanomaterials in various industries has grown exponentially due to their unique properties and wide-ranging applications. However, it is crucial to analyze the level of exposure to which humans are subjected. Exposure to these nanomaterials can occur through various routes, and they are highly reactive and toxic to both organisms and the environment. This is not only due to their constituent components, such as metallic ions, but also because of their concentration and the size-dependent effects that often make them more reactive and longer-lasting in biological systems [20]. Furthermore, the development of such nanomaterials poses considerable health risks not only to those involved in their production and characterization, due to the inherent manipulative processes, but also to consumers and users who may be exposed to them [1]. This is because particles smaller than 100 nm can be easily transported through the environment, thus reaching living tissues. This is viewed with concern by regulators and consumers, especially in agriculture and medicine. The effect of nanotoxicity generated by this type of NPs should be considered carefully to ensure proper control and management through mandatory policies and regulations [21], [22].
Current research is trying to analyze alternatives that lead these NMs to a controlled development, under regulations from the point of view of the chemical product; its definition, information, and respective evaluation [23]. Under the current economic model of industrial growth, based on product development, innovation, and patent development led by countries such as China, the United States, and India, it is very important to analyze the policies and regulations concerning the design, characterization, and production of materials at the nano level, as well as their assembly, architecture, and ways of diffusion [9, 24-26].
B. Policies and Regulations
In a review of different countries, it becomes necessary to analyze how the generation of policies and regulations on the development of nanotechnology has become an increasingly urgent issue. This urgency is due to industrial growth and the widespread development of products in almost every sector of the industry.
In the case of Mexico, significant efforts have been made in nanotechnology in two key aspects: first, to protect knowledge and provide benefits to inventors without affecting or limiting scientific-technological advancements; second, the development of legal instruments that define regulations, establish responsibilities, and impose sanctions [27].
Foladori [28] highlighted that 50% of nanotechnology companies in Mexico are located in the final phase of the value chain, while only 4% focus on research into instruments and nanotechnological manipulation. It is important to note that Mexico does not have specific resources dedicated to these areas of nanotechnology, and the funds allocated to Research and development (R&D) are primarily dedicated to specific projects with private companies.
The adoption of nanotechnology in Brazil has been an area of great interest, leading to the development of governance regimes aimed at promoting technological innovations and their benefits, while ensuring the responsible development of nanotechnology. Previously, Europe, in its quest for a more sustainable future, implemented a series of research agendas constructed with experts, the public, and the government. These agendas aimed to generate development pathways through various mechanisms, employing an anticipatory governance model [29]. Brazil took these models as a reference.
This country has a well-established research and education system based on four main pillars: science and technology for social development, system consolidation, incentives and innovation, and R&D in strategic areas. However, their resources are primarily directed towards social inclusion initiatives that promote competitiveness, while neglecting to prioritize scientific innovation and contributions to the industrial sector for more comprehensive development. It is worth noting that new investments are being made due to the rise of nanotechnology; nevertheless, discussions regarding environmental and health risks are often sidelined. There is a lack of significant contributions to the development of toxicological testing for nanotechnology products [30].
Public policies on nanotechnology in Latin America have favored a series of research groups integrated with the private sector or that have led to creating start-ups, but resources allocated to this field are still limited [28]. In terms of the impact of nanotechnology on public policies, it is still an emerging area since Feynman's discovery of the importance of studying materials at the nanoscale in 1959; it is interdisciplinary, with contributions from various knowledge domains, and its growth is evident in the development of products for industries [31]. However, a major challenge lies in the lack of public understanding regarding the definition of nanotechnology products, the risks in handling and using them, and the ethical considerations in the development processes. Clarity in these aspects is still lacking, particularly in Latin America, where the concept of nanotechnology is just beginning to take shape, and where laws and regulations are often based on models from the United States or Europe.
The objective of this article is to present, through a bibliometric analysis, the trends in regulatory aspects and policies on nanotechnology internationally. It aims to explore the risks and effects of nanotechnology on human health and the environment and discuss the need for implementing regulations on countries that are starting to consolidate efforts in this area.
II. METHODOLOGY
The analysis related to regulatory aspects and policies on nanotechnology was developed over a period of 23 years (2000-2023), since the first regulations appeared by the year 2000. The analysis was conducted using Scopus, Web of Science (WOS), and Journal Citation Report databases. The data were obtained from keywords such as (regulations OR legislation OR policy) AND (nanotechnology OR nanomaterials OR nanoparticle* OR nano*) AND (risk AND nanotechnology). Initially, 4207 data were found, which were refined down to 1202 scientific papers and 4918 patents.
The analysis methodology was based on studies by other authors [32]. To conduct the bibliometric study, the starting point was a combination of keywords using logical operators AND, OR, NOT. The data were reviewed based on the title, abstract, or keywords. Software such as OpenRefine, VOSviewer, Espacenet, and advanced Excel were used for the analysis and refinement process. The VOSviewer software, developed by [33] was used for the data obtained by Scopus. This software allows the analysis of keywords based on their frequency and co-occurrence among authors or countries, relationships between networks, and cluster analysis [34].
One of the best tools to determine the value of publications is bibliometrics, which allows us to demonstrate the impact of publications in the study of different fields. It not only helps to determine the state-of-the-art, discussions or conclusions, but also shows the growth within a specific field of study. For this research, several indicators were used, e.g., the h-index, which measures productivity and the impact of citations in publications. Similarly, the i10-index indicates publications with more than 10 citations, and those with more than 5 publications are considered productive authors and institutions. It is important to highlight articles with more than 50 citations, referred to as "key articles."
Furthermore, the author's productivity index (PI) was evaluated using Equation (1), where N represents the number of published articles; a value of zero (0) indicates low productivity; a value between 0-1, moderate productivity; and a value greater than 1 (greater than 10 works), high productivity. In general, when analyzing countries, authors, and institutions, the total number of publications (TD), total citations (TC), and h-index are primarily examined [32].
Finally, a brief discussion was conducted regarding the necessary conditions and requirements of the most prolific countries in this research area, taking into account the development of products in this field, the economic contributions to R&D, the public perspective, and the role of governments in controlling these policies and regulations.
III. RESULTS AND DISCUSSION
A. Trends in the Study of Articles and Patents
By the year 2000, the first publications on regulations and norms regarding nanotechnology were evident due to researchers' concern about the impact generated by product development. A total of 3479 documents were found and refined by document type, excluding conference papers, letters, short communications, editorials, and notes. A total of 1202 documents were consolidated during the period from 2001 to 2023. The average publication growth rate was 32%. The analysis included 9952 keywords and an average of 41.6 citations per document, resulting in a total of 41084 citations. There were 4565 authors, 77 countries, and 305 documents with a single author. Regarding regulations and policies on nanotechnology, all areas of interest are relevant; however, Engineering (14%), Medicine (10%), Environmental Sciences (9%), Social Sciences (9%), and Materials Science (8%) account for 50% of the studied documents.
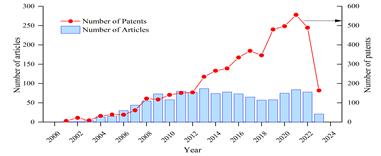
The production of scientific documents such as articles and patents related to normativity and regulations on nanotechnology is shown in Figure 1. As stated in the methodology, the information was obtained from the Scopus database. There was an upward growth trend from 2001 to 2009, with an average of 26 publications per year. However, from 2009 to 2022, there was an average of 72 publications per year.
Source: Scopus.
Fig. 1 Timeline of publications and patents related to normativity and regulations on nanotechnology in the period 2001-2023.
The number of patents generated during this period was 4914, with over 2186 patents generated in the last 5 years (2019-2023), i.e., nearly 45% of the total production. The strong growth in patent generation started in 2008, with over 100 per year. The country with the highest patent production is United States, followed by China. Their generation is closely linked to significant investment in R&D from both the public and private sectors in the United States, as well as the national innovation strategies and incentive policies developed by China [35]. The United States Patent and Trademark Office (USPTO) has filed the highest number (3939).
Additionally, the United States has fostered a dynamic and competitive entrepreneurial ecosystem that has facilitated the upward development of startups. Furthermore, the USPTO, which grants patents to inventors and companies, along with a legal framework for intellectual property rights protection, thus incentivizing the development of these patents.
B. Most Prolific and Influential Countries
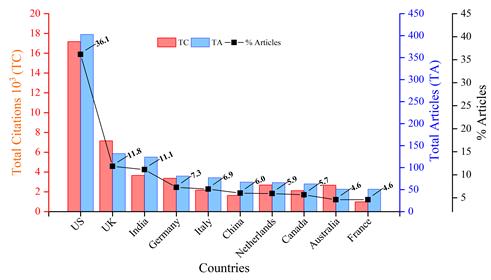
Figure 2 shows the total number of articles (TA) and total citations (TC) by countries on topics related to normativity and regulation in Nanotechnology. Regulatory processes and policies are more evident in countries such as the United States, with 403 publications (36.1% of the total), followed by the United Kingdom (132 publications, 11.8%), India (124 publications, 11.1%), Germany (81 publications, 7.3%), Italy (77 publications, 6.9%), and China (67 publications, 6%).
Source: Scopus.
Fig. 2 Timeline of production by the top 10 countries related to normativity and regulations on nanotechnology in the period 2001-2023.
In the United States, as early as 2003, during the 225th ACS National Meeting (March 23-27, 2003, New Orleans, LA), the impact on the development of nanotubes, product development, and their applications was showcased, along with their associated health risks [36]. Later, the public perception related to risks, benefits, and truths associated with nanotechnology was analyzed. Initially, there was satisfaction with low risks, primarily focused on disease treatment and the development of new technologies, as shown in several studies [37], [38].
In the United Kingdom, in 2006, the effect of carbon nanotubes and their relationship with pulmonary toxicity was analyzed. Donaldson et al. [39] demonstrated health risks associated with these nanotubes, such as oxidative stress, highlighting the need to control their use. In 2008, Chaudhry et al. [40] examined the effect of nanotechnology in the food sector, including materials in contact with food or additives, and the implications for consumer safety, risks, and controls. This raised significant concerns and led to the search for regulations to ensure the safe development of these products.
According to these results, the United States dominated global participation in the development of policies and regulations on nanotechnology. This process is driven by an initiative of the National Nanotechnology Institute (NNI), founded in 2001 with the Nanotechnology Regulatory Science Research Plan, with investments of 31 billion dollars in different research centers and laboratories, and an annual growth investment of 18%. Other countries have made significant contributions, such as China with 228 million dollars during 2001-2006, India with 12 million dollars in 2002, and 130 million in the Nano Mission over a period of 12 years [41].
Other countries, except the US, have spent efforts to establish legislation and policies on nanotechnology. For instance, the United Kingdom has developed safety guidelines on waste disposal, best practice guidelines on product labeling, and specific guidance on nanomaterials. Japan (rank 21) has enacted the Law on the Control and Regulation of Chemical Substances. China has established technical committees for nanotechnology standardization and a bioenvironmental safety laboratory. In the case of India, they are working on establishing a regulatory body for nanotechnology supported by the Nano Mission Council [41].
Regarding regulatory requirements, Malik & Patil [42] presented a comparison of regulatory requirements for nanomaterials in the United States, Europe, and India. The study highlighted initiatives and progress in defining nanomaterials, their applications, product labeling, development of safety testing methods, risk assessment, and availability of safety data. Even though these aspects are important, there is a considerable ambiguity in regulatory aspects. The goal is to continue working towards facilitating the harmonization of evaluation practices to strengthen this field.
Table 1 presents the analysis of the top ten countries with the highest scientific production. It is worth noting that the United States contributed 403 documents, accounting for 33.5% of the total. The average number of citations in the United Kingdom was 60.03, while Australia had an average of 55.4 citations. The top ten countries accounted for 92.7% of the total number of documents
Table 1 Top ten countries related to nanotechnology regulations and standards in the period 2001-2023
| No | Countries | TA | TC | Authors | AC | Citations-AC | h-index | Mean citations |
|---|---|---|---|---|---|---|---|---|
| 1 | United States | 403 | 17170 | 1665 | 79 | 13042 | 61 | 49.06 |
| 2 | United Kingdom | 132 | 7144 | 781 | 29 | 5765 | 37 | 60.03 |
| 3 | India | 124 | 3645 | 521 | 17 | 2857 | 25 | 37.58 |
| 4 | Germany | 81 | 3362 | 636 | 20 | 2652 | 27 | 51.72 |
| 5 | Italy | 77 | 2173 | 651 | 14 | 1456 | 24 | 32.92 |
| 6 | China | 67 | 1624 | 441 | 5 | 1014 | 18 | 32.48 |
| 7 | Netherlands | 66 | 2682 | 522 | 10 | 1959 | 22 | 45.46 |
| 8 | Canada | 63 | 2114 | 412 | 12 | 1497 | 21 | 37.75 |
| 9 | Australia | 51 | 2659 | 227 | 10 | 1909 | 24 | 55.40 |
| 10 | France | 51 | 979 | 455 | 7 | 520 | 18 | 22.77 |
It is worth highlighting the low participation of China in terms of regulatory products and policies on nanotechnology; according to WIPO, China has the highest number of patents in the world (46.6% of the total) with a growth rate of 5.9% between 2020 and 2021 [35]. Furthermore, in the study by [43] on nanoparticles and materials in nanotechnology, China was identified as one of the pioneers in generating articles and developing patents. However, when it comes to regulatory issues or policies, their production is low-3.5 articles per year on average-, which is significantly lower compared to the United States-19.1 articles per year on average. India, a country with similar conditions, publishes 7.75 articles per year on average.
C. Collaboration Networks
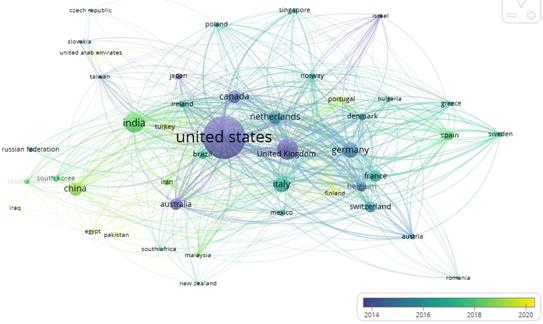
Figure 3 depicts the collaboration networks among 44 countries (out of a total of 122) in Nanotechnology Regulations and Regulatory Issues. Only elements with a minimum of 5 documents and a minimum of 20 citations were included. The size of the spheres represents the number of documents published by each country, and the color indicates the most active period within the last 6 years. The connecting lines between the spheres indicate current collaborations. Figure 3 reveals a strong collaboration between the United States, the United Kingdom, and Germany around 2014. Additionally, there is a notable collaboration between China and India around 2018 and 2019.
Source: VosViewer.
Fig. 3 Collaboration networks of 44 out of 112 countries on topics related to nanotechnology regulations and normativity in the period 2001-2023.
Table 2 presents the number of collaboration networks and the total link strength between countries, from strongest to less strong. The information about the countries is distributed into 5 clusters that group their characteristics, the year represents the most active period. It is worth noting again that, in terms of link strength, China has the lowest value, while the United States and the United Kingdom are the countries with the strongest collaboration.
Table 2 Top-ten countries related to nanotechnology regulations and standards in the period 2001-2023.
| No | Countries | Cluster | Year | Link | Total link strength |
|---|---|---|---|---|---|
| 1 | United States | 3 | 2012 | 39 | 284 |
| 2 | United Kingdom | 3 | 2013 | 35 | 203 |
| 3 | Germany | 2 | 2015 | 30 | 177 |
| 4 | Italy | 2 | 2016 | 34 | 172 |
| 5 | Netherlands | 2 | 2015 | 29 | 152 |
| 6 | France | 5 | 2016 | 31 | 123 |
| 7 | Canada | 3 | 2014 | 31 | 96 |
| 8 | India | 1 | 2018 | 32 | 75 |
| 9 | Australia | 1 | 2013 | 27 | 59 |
| 10 | China | 1 | 2018 | 21 | 56 |
D. Most Influential Institutions
Table 3 displays the analysis of the top ten most representative institutions in nanotechnology regulations and norms during the period 2001-2023. There are approximately 191 institutions, out of which 160 were analyzed, representing 83.7% of the total.
Table 3 Top-ten institutions with the highest number of articles related to normativity and regulations on nanotechnology in the period 2001-2023.
| No. | Institutions | TA | TC | h-index | Countries |
|---|---|---|---|---|---|
| 1 | Arizona State University | 27 | 891 | 13 | United States |
| 2 | European Commission Joint Research Centre | 23 | 1109 | 15 | Belgium |
| 3 | NC State University | 21 | 1007 | 12 | United States |
| 4 | University of Minnesota Twin Cities | 20 | 559 | 13 | United States |
| 5 | University of Wisconsin-Madison | 20 | 962 | 14 | United States |
| 6 | Technical University of Denmark | 17 | 651 | 12 | Denmark |
| 7 | Monash University | 15 | 262 | 10 | Australia |
| 8 | National Institute for Public Health and the Environment | 15 | 1065 | 12 | Netherlands |
| 9 | National Institute for Occupational Safety and Health | 14 | 771 | 9 | United States |
| 10 | United States Environmental Protection Agency | 13 | 819 | 11 | United States |
TA = Total Articles; TC = Total citations; AC = key articles
The top ten institutions with the highest number of documents represent 18.37% of the total documents and 19.7% of the total citations. Additionally, there is a significant dispersion of documents, with 58% of institutions having between 3 and 5 documents each. The maximum number of documents per institution was 27, resulting in a coefficient of variation of 63.1%. Among the ten institutions listed in Table 3, the ones with the highest number of citations are the European Commission Joint Research Centre, NC State University, and the National Institute for Public Health and the Environment. They work in specific areas such as pharmacology and environmental sciences, engineering, and medicine, respectively. Regarding the geographical distribution of the documents, 60% of them come from the United States, followed by Belgium, Denmark, Australia, and the Netherlands.
E. Journal Analysis
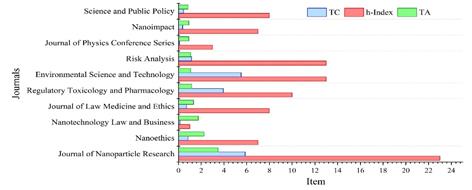
Table 4 presents the top ten most productive journals in Nanotechnology Regulation and Regulatory Topics, based on the number of documents. It includes the total number of articles (TA), total citations (TC), and their relative percentages. In terms of journal quality, it provides the h-index, the topic-based h-index, the Scimago-Journal Rank (SJR) indicator, and the CiteScore (2021). The number of documents published in these journals accounts for 14.8% of the total documents and 19.1% of the citations. The publishing countries of these journals are the United States, the Netherlands, and the United Kingdom, in equal proportions.
Table 4 Analysis of the most influential journals on nanotechnology standards and regulations in the period 2001-2023
| Total | Relative (%) | Journal Quality | Publishing Country | ||||||
|---|---|---|---|---|---|---|---|---|---|
| Journal | TA | TC | TA | TC | h-index | h*-Index | SJR | Cite Score (2021) | |
| Journal of Nanoparticle Research | 42 | 2416 | 3.49 | 5.88 | 23 | 137 | 0.410 | 3.6 | Netherlands |
| Nanoethics | 27 | 344 | 2.25 | 0.84 | 7 | 33 | 0.230 | 1.8 | Netherlands |
| Nanotechnology Law And Business | 21 | 55 | 1.75 | 0.13 | 1 | 15 | 0.102 | 0.5 | Germany |
| Journal of Law Medicine And Ethics | 16 | 296 | 1.33 | 0.72 | 8 | 63 | 0.449 | 2.8 | United States |
| Regulatory Toxicology and Pharmacology | 14 | 1620 | 1.16 | 3.94 | 10 | 119 | 0.696 | 5.8 | United States |
| Environmental Science and Technology | 13 | 2264 | 1.08 | 5.51 | 13 | 86 | 2.635 | 14.8 | United States |
| Risk Analysis | 13 | 474 | 1.08 | 1.15 | 13 | 146 | 0.919 | 7 | United Kingdom |
| Journal of Physics Conference Series | 11 | 40 | 0.92 | 0.10 | 3 | 191 | 0.210 | 0.8 | United Kingdom |
| Nanoimpact | 11 | 154 | 0.92 | 0.37 | 7 | 39 | 0.910 | 8 | Netherlands |
| Science and Public Policy | 10 | 185 | 0.83 | 0.45 | 8 | 75 | 0.714 | 4.5 | United Kingdom |
Figure 4 displays a relationship between journals, h-index, and citations of the top 10 most influential journals. It is worth noting that the journals with the highest h-index in the research field are the Journal of Nanoparticle Research, followed by Environmental Science and Technology and Risk Analysis, with h-index values of 23, 13, and 13, respectively. These journals also have citation percentages of 5.55%, 5.51%, and 1.15%, respectively. This indicates a high level of productivity and citation impact for these journals.
F. Authors
In the author analysis, the top ten authors with the highest number of publications are presented in Table 5. A total of 4565 authors were identified. Kuzma, from NC State University, ranks first with the highest number of publications (20) and has an h-index of 13 in the study area. The author with the most key articles (6) is Linkov, from the U.S. Army Engineer Research and Development Center, with an h-index of 12. Chaudhry, from the University of Chester, is the author with the highest number of citations (1066) and has 9 publications. Among the top ten authors with the most publications, eight are from the United States.
Table 5 Top-ten authors related to normativity and regulatory issues on Nanotechnology in the period 2001-2023
| No. | Authors | Affiliation | TA | TC | AC | CAC | h-index topic | h-index author | IP | Country |
|---|---|---|---|---|---|---|---|---|---|---|
| 1 | Kuzma, J. | NC State University | 20 | 542 | 3 | 183 | 13 | 24 | 1,301 | US |
| 2 | Linkov, I. | U.S. Army Engineer Research and Development Center | 16 | 560 | 6 | 372 | 12 | 55 | 1,204 | US |
| 3 | Bowman, D.M. | Arizona State University | 13 | 152 | 0 | 0 | 8 | 20 | 1,114 | US |
| 4 | Scheufele, D.A. | University of Wisconsin-Madison | 12 | 708 | 5 | 635 | 9 | 61 | 1,079 | US |
| 5 | Corley, E.A. | Arizona State University Downtown Phoenix Campus | 10 | 310 | 4 | 242 | 8 | 27 | 1,000 | US |
| 6 | Bergeson, L.L. | Bergeson and Campbell | 9 | 189 | 1 | 123 | 3 | 9 | 0,954 | US |
| 7 | Chaudhry, Q. | University of Chester | 9 | 1066 | 1 | 983 | 5 | 31 | 0,954 | UK |
| 8 | Marchant, G.E. | Arizona State University | 9 | 305 | 2 | 187 | 7 | 22 | 0,954 | US |
| 9 | Bouwmeester, H. | Wageningen University & Research | 8 | 902 | 2 | 819 | 7 | 39 | 0,903 | Netherlands |
| 10 | Harthorn, B.H. | University of California | 8 | 231 | 1 | 80 | 7 | 20 | 0,903 | US |
Figure 5 illustrates the relationship between the number of authors per publication and the number of citations per year. There are 305 articles with a single author, accounting for 25.33% of the total articles, followed by 250 articles with 2 authors (20.76%), and 187 articles with 3 authors (15.53%). For the cases of 4, 5, and 6 authors, percentages of 11.7%, 8.64%, and 4.98% were found, respectively. Finally, there are 157 articles with 7 or more authors, corresponding to 13.04%. The years 2006, 2009, and 2012 had the highest degree of citation, with 9.34%, 8.54%, and 9.0%, respectively. A positive citation trend was observed starting from 2004, reaching its peak in 2009. However, from 2017 onwards, there has been a declining trend in citations.
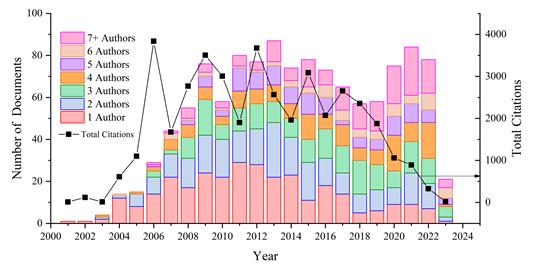
Fig. 5 Number of authors per publication and number of citations per year related to the normativity and regulations on nanotechnology in the period 2001-2023.
The highest percentage of articles was found for publications with one author from 2004 to 2012. From 2013 onwards, the participation of authors per article became more balanced. However, starting in 2018, there has been an increase in articles with 7 or more authors, accounting for 5.4% of the total articles. These articles featured between 10 and 45 authors each. This trend in recent years could be attributed to the integration of teams in the development of reports summarizing the handling of products and drugs related to nanomaterials, their risks, categorization, risk communication, governance, and other topics that require consensus among different groups and entities [44], [45].
G. Keyword Occurrences
To conduct the analysis of keywords, the VOSviewer software was used to evaluate the degree of occurrence. The size of the spheres indicates the number of documents each word appears in, while the color represents the formation of clusters, as shown in Figure 6.
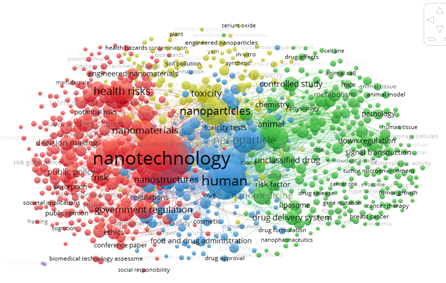
Fig. 6 Keywords and degree of occurrence related to norms and regulations on nanotechnology in the period 2001-2023.
A total of 9952 keywords were identified in the analysis. However, only 898 showed some form of connection and occurred at least 5 times. These keywords were grouped into four clusters. The first one, in red, includes 331 words related to policies, nanotechnology, governance, regulation, and health risks, among others. The second cluster, in green, consists of 275 words referring to human risk factors, drug classification and efficacy, medical nanotechnology, and regulation. The third cluster, in blue, comprises 158 words associated with exposure, ecotoxicity and nanotoxicity, chemical composition, and nanomaterial safety. Finally, the fourth cluster, in yellow, gathers 134 words related to agriculture, packaging, food, cosmetics, quality control, and hazards, among other topics. Among the top 15 words with the highest occurrences are terms such as risk assessment, human, health risks, and regulation.
H. Most Cited Articles
Table 6 presents the top 10 most cited articles on normativity and regulations on nanotechnology. Regarding the most cited articles, these 10 papers accounted for 18.5% of the total citations. They covered topics such as the study of carbon nanotubes and their toxicity levels generated during the manufacturing process of various elements, as well as their adverse effects due to inhalation and the incidence of oxidative stress, which can lead to diseases such as atherosclerosis [39], [46]. Additionally, notable articles focused on the risks involved in the production of nanomaterials, their cytotoxic effects, and their impact on different organs in the body [37], [47]. There were also articles discussing the generation of waste during the production process, as well as its management and disposal [48]. Another highly cited topic revolved around nanotechnology in the food sector, including the production of additives, materials in contact with food, and their implications for consumer safety. These articles included risk assessments and investigations on the kinetics of these materials within the body [40], [49], [50]
Table 6 Top-ten most cited articles related to normativity and regulations on nanotechnology in the period 2001-2023.
| Authors | Title | Year | Source Title | Cited by | TC -Journal | TA-Area |
|---|---|---|---|---|---|---|
| Donaldson K., Aitken R., Tran L., Stone V., et al. | Carbon nanotubes: A review of their properties about pulmonary toxicology and workplace safety | 2006 | Toxicological Sciences | 1000 | 1373 | 6 |
| Wiesner M.R., Lowry G.V., Alvarez P., Dionysiou D., Biswas P. | Assessing the risks of manufactured nanomaterials | 2006 | Environmental Science and Technology | 983 | 2262 | 13 |
| Chaudhry Q., Scotter M., Blackburn J., Ross B., Boxall A., Castle L., Aitken R., Watkins R. | Applications and implications of nanotechnologies for the food sector | 2008 | Food Additives and Contaminants - Part A | 982 | 1127 | 3 |
| Vasan R.S. | Biomarkers of cardiovascular disease: Molecular basis and practical considerations | 2006 | Circulation | 939 | 939 | 1 |
| Oberdorster G. | Safety assessment for nanotechnology and nanomedicine: Concepts of nanotoxicology | 2010 | Journal of Internal Medicine | 773 | 773 | 1 |
| Kattoor A.J., Pothineni N.V.K., Palagiri D., Mehta J.L. | Oxidative Stress in Atherosclerosis | 2017 | Current Atherosclerosis Reports | 626 | 626 | 1 |
| Kahru A., Dubourguier H.-C. | From ecotoxicology to nanoecotoxicology | 2010 | Toxicology | 622 | 622 | 1 |
| Elsaesser A., Howard C.V. | Toxicology of nanoparticles | 2012 | Advanced Drug Delivery Reviews | 622 | 730 | 4 |
| Bouwmeester H., Dekkers S., Noordam M.Y., Hagens W.I., Bulder A.S., de Heer C., et.al | Review of health safety aspects of nanotechnologies in food production | 2009 | Regulatory Toxicology and Pharmacology | 577 | 1614 | 14 |
| Bystrzejewska-Piotrowska G., Golimowski J., Urban P.L. | Nanoparticles: Their potential toxicity, waste, and environmental management | 2009 | Waste Management | 489 | 489 | 1 |
TC-Journal: Total journal citations in the field; TA-Area: Number of articles in the area
Furthermore, starting from the early years of 2004 and 2006, researchers such [37], [38] began investigating the public perception of nanotechnology. Their aim was to understand how people perceived this new technology and how it was viewed within different contexts. Initially, the response was one of satisfaction and low perceived risk, with a primary focus on the potential for disease solutions and treatment.
However, 18 years later, a study conducted by [51] revealed the current state of affairs. This independent analysis explored the perception of nanotechnology across different countries, revealing the absence of a unified international policy governing various aspects of its use. This lack of cohesion is not only evident in the conceptualization and definition of terms but also extends to aspects such as risk management, knowledge biases, demographic considerations, and the influence of different technologies on individuals.
IV. CONCLUSION
The bibliometric study analyzed various aspects related to the behavior of countries, institutions, journals, authors, and more, regarding regulations and policies on nanotechnology. The highest contribution in terms of scientific papers came from the United States and China, followed by the United Kingdom, India, and Germany, which are making significant investments in research and development. The growth of the nanotechnology industry has been exponential in the last 20 years, thus demonstrating a significant contribution to solving industry problems across various fields and driving economic growth.
However, this industry's growth and production processes have also generated a series of risks related to exposure and handling that are not yet fully regulated. The regulation processes are affected by factors such as the limited knowledge of nanomaterials due to their size and behavior in the environment, the level of technology required for analysis, geographical conditions, and social aspects, among others. These factors need to be evaluated and widely discussed.
The most prominent topics of interest in the study analysis include nanotoxicity due to inhalation effects, cytotoxicity in manufacturing processes and waste management, as well as the production of additives and their contact effects on food.


