


 English (pdf)
 Article in xml format
 Article references
 Send this article by e-mail
 Cited by SciELO
  Cited by Google
  Similars in
SciELO
Similars in
SciELO  Similars in Google
 Permalink
I. Introduction
Visual impairment refers to any kind of vision loss, total or partial. This refers to individuals who have lost enough vision to require approaching objects closely to see them clearly, while others are completely blind [1]. According to the SNIES (Sistema Nacional de Información de la Educación Superior), in 2016, higher education institutions enrolled approximately 1,000 visually impaired students, while the SENA enrolled over 1,600 students in the same conditions [2]. In Colombian educational institutions, visually impaired students can navigate independently. They achieve this by using a white cane or a guide dog. The white cane is a mobility aid that allows visually impaired persons to detect obstacles and move within their environment. It provides tactile feedback and helps them identify potential risks in their path [3]. On the other hand, a guide dog is a trained canine attendant that assists persons with visual impairment by guiding them through different environments, ensuring their safety and helping them navigate with ease [3]. However, the nonexistence of braille signage represents an important challenge for visually impaired students in orienting themselves within the space of educational institutions.
Braille is a raised dots system used by individuals who are blind or visually impaired to read and write [4]. Consequently, visually impaired students face a negative experience during their time in higher institutions. The lack of signage not only impedes their ability to move around freely but also limits their participation in diverse activities. This circumstance violates their rights to equal access to education and inclusion [5].
The World Health Organization (WHO) establishes the importance of supporting the independence and mobility of people with visual impairment to reduce the effect of inadequate adaptations in higher education institutions [6]. Moreover, it highlights the importance of using technical tools, such as smartphones, to improve the Quality of Life (QoL) of this group. Smartphones are mobile devices that offer apps distinct to traditional calls and text messages and provide users with a more interactive and integrated user experience, such as Augmented Reality (AR).
To integrate visually impaired individuals into academic spaces, it is necessary to create useful and user-friendly apps that present easy access and enhance various aspects of their daily lives [7]. Thus, AR can be highly valuable for this group of people [8] since it has the potential to enhance their experience by providing additional information and assistance in navigating and accessing information in their environments. AR technology, when utilized effectively, bridges the accessibility gap and empowers visually impaired individuals in academic environments.
Augmented reality is a technology that overlaps virtual elements in real life using a technological device. It incorporates three main characteristics: a) a combination of digital and physical worlds, b) real-time interactions, and c) precise 3D identification of virtual and real objects [9].
The use of AR represents an important solution to the obstacles faced by society, and its demand has significantly increased in the global market. In 2021, the AR market reached a value of 22.6 billion dollars [10]. However, AR is frequently overlooked in its capability to assist marginalized groups and foster social inclusion despite the significant technological innovations experienced by society.
There are tools for the mentioned group. For example, the ARIANNA system is an app designed for visually impaired persons that uses QR codes and physical pathways for localization and navigation in indoor and outdoor spaces. The system eliminates the need for physical support with the help of the ARKit library [11] and includes modules for navigation and tracking services. The implementation of ARIANNA requires square-shaped QR codes.
[12] introduces an interactive tool based on an augmented reality mobile application for Android devices. This app assists visually impaired individuals in navigating potentially risky or hard-to-reach locations. It includes modules for spatial orientation using smartphones and AR, merging real-time images with device location data.
Finally, in [13], an augmented reality system helps visually impaired individuals in Tunisia read Arabic traffic signs while driving. It uses three modules for text detection, visualization, and text-to-speech conversion.
II. Material and Methods
This section presents the fundamental stages of the research process, which involve software development, implementation, and evaluation by the target group of users.
A. Phase 1: Navigation System Design
The design of the navigation system underwent development, considering the following:
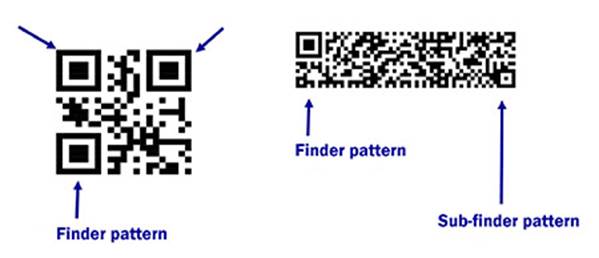
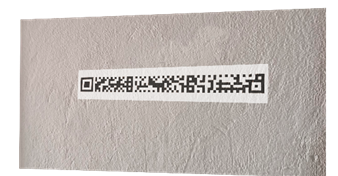
Assignment of unique rMQR codes: A unique rMQR code was assigned to each point of interest, facilitating effortless detection and connection with the AR app. An rMQR code was strategically positioned in a visible area within each described space, ensuring prompt recognition by the program. The rMQR code is a two-dimensional matrix-type code that is easy to read and can store substantial amounts of information. The rectangular shape facilitates printing on walls and narrow spaces [14], creating a path that guides visually impaired individuals. Furthermore, it resolves the issue of conventional QR code placement, as their square shape makes it difficult to print them in various spaces, especially those with curved geometry. Finally, the remarkable storage capacity of the rMQR codes allows them to replace Micro QR codes efficiently.
Figure 1 shows how the rMQR Code saves space by reducing the number of eye-shaped "finder patterns" from three to one and a half. This reduction in finder patterns contributes to a more compact design.
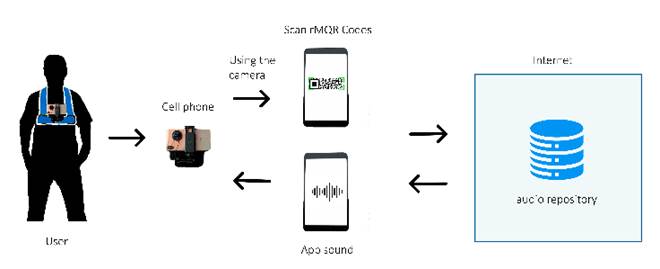
System architecture: The auditive navigation system is based on a client-server architecture [15]. The app installed on the smartphone represents the client, while a server is responsible for storing and managing the rMQR code data and corresponding audio files for each location.
Figure 2 shows a user utilizing their mobile phone to read a code stored in a repository through the internet. Afterward, it plays an audio description of the location. As the user navigates, they point the phone's camera at the code, and the application scans and interprets it.
Technologies used: The system implementation was done using tools such as Vuforia and Unity. These technologies enable the detection and reading of rMQR codes, as well as the playback of audio files associated with each point of interest. The Vuforia SDK includes tools to create image targets, which are specific visual markers used for tracking and identifying objects in the real world [16]. These image targets recognize and track rMQR codes, allowing the AR application to overlay virtual content or trigger specific actions based on the detected codes. On the other hand, Unity provides a robust development environment for creating the visual and interactive elements of the AR experience [17].
B. Phase 2: Software Development
For the software development, we used Unity and Vuforia. Unity is a development environment recognized for its accessibility and ability to integrate with various tools. Vuforia is a cross-platform development platform for augmented reality and Mixed Reality (MR) applications, offering robust tracking and performance on a variety of devices [18]. It was used to enhance the project's functionalities using the C# programming language.
The marker-based tracking (Image Targets) provided by Vuforia was employed to detect the rMQR codes. When an Image Target detects one of these codes, the function "On Target Found()" is triggered, following a set of instructions to play a specific audio.
The rMQR codes were generated using an online code generator tool. Each code includes the name of the space for which audio descriptions are provided. Additionally, NaturalReader, an application capable of reading texts in Spanish and generating audio files [19], was used to generate the audio descriptions, which were then stored in these files and archived in a repository. These descriptions include the most relevant features of the spaces and their surrounding environment. This process aims to provide users with useful and accurate information about each space, enhancing their understanding and experience.
C. Phase 3: Implementation and Testing
We placed the rMQR codes in spaces such as bathrooms, the library, and the university welfare building, among others. Each space description includes its own information and information about its surroundings. Furthermore, we conducted functionality, accuracy, stability, and performance tests.
Tests were conducted to evaluate the accuracy and reliability of the application in reading the QR codes under various conditions. The purpose of these tests was to determine if the application could read the codes precisely and dependably, regardless of the angle from which the reading was performed.
1) Frontal Angle. The rMQR code was positioned at a 90-degree angle. The test results confirmed that the program instantly scans the code and plays the sound accurately.

2) Upward Tilt Angle. The program quickly read the rMQR code at a 120-degree angle and reproduced the audio accurately. This test aimed to simulate the situation when the code is in a higher position than the reading device.
3) Downward Tilt Angle. The rMQR code was positioned at a lower-than-expected angle of 60 degrees. The program quickly read the code and reproduced the audio accurately. This test simulated the situation when the code is in a lower position than the reading device.
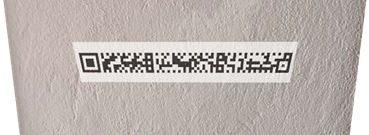
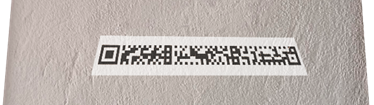
4) Side Angle. In this test, the code was adhered to a curved object. The program rapidly read the code and played the audio accurately. This test aimed to evaluate the code reading behavior under non-flat conditions.
Finally, it was discovered through various tests that the program encounters difficulties when scanning rMQR codes at angles exceeding 160 degrees or below 20 degrees. In such situations, it has been observed that the application struggles to differentiate the codes accurately and reproduce the corresponding audio.
A test was conducted to evaluate the accuracy and stability of reading rMQR codes. Following the scanning of each code, a comparison was made between the description provided by the application and the expected audio description. This process validated the application's capability to read rMQR codes accurately.
This test evaluated the performance of the application at different distances through multiple readings of rMQR codes. The aim was to find an optimal distance for effective reading. The tests determined that the optimal reading distance for rMQR codes was 1-2 meters, and good performance was observed within this range. However, issues arose beyond 3 meters, affecting code recognition and audio reproduction. Moreover, the code size (2x15 cm) is a factor to consider. The average device resource consumption during operation was approximately 1530 mAh per hour.
D. Phase 4: Participants and Validation
Thirty-six (36) students validated the software. Each participant took a tour inside the university while wearing a harness to ensure unrestricted mobility by the mobile phone. During the tests, the students wore sleep masks to replicate the experience of visually impaired students and assess the effectiveness and accessibility of the app for this group. The students answered a questionnaire of ten (10) questions using the 5-Likert scale to validate the app. The 5-Likert scale is a response method used in questionnaires to measure the degree of agreement or disagreement of a person with a statement [20]. This scale allows users to express their level of agreement or disagreement with each statement presented in the survey and helps gather valuable information about the users' experience and perception of the software. The response options used were: (a) Strongly agree, (b) Agree, (c) Neutral, (d) Disagree, and (e) Strongly disagree. It focused on various criteria such as accessible and user-friendly interface, autonomy, and safety through detailed descriptions of places. These criteria aimed to evaluate the software's ability to allow and assist human beings with visual impairment in their universities.
III. Results
Visually impaired persons depend on assistive apps to navigate the features of their smartphones. These applications, such as TalkBack (Android) [21] or VoiceOver (iOS) [22], access and open the app to provide audio feedback and screen descriptions, enabling them to locate and interact with applications on their mobile devices.
The information provided in the questionnaires was of vital importance in understanding their experience and perspective, as well as evaluating the effectiveness and usefulness of the software concerning the needs of individuals with visual impairment.
This study begins by focusing on the accessibility of the application's interface for users with visual impairment. Numerical values were assigned to each response option in the 5-point Likert scale as follows: (a) Strongly agree = 5, (b) Agree = 4, (c) Neutral = 3, (d) Disagree = 2, (e) Strongly disagree = 1. These values correspond to the level of agreement or disagreement associated with each response option.
The standard deviation is a statistical measure that quantifies the amount of variation or dispersion in a set of data [23], and it was used to measure the dispersion of responses for each question on the Likert scale. It evaluates how much individual responses deviate from the mean of the responses. Mathematically, the standard deviation calculates the square root of the variance, which computes the average of the squared differences between each data point and the mean.
The formula to calculate the standard deviation for a set of data is as follows:
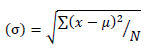 (1)
(1)
Where σ represents the standard deviation, Σ denotes the sum of the values, x represents each value in the data set, μ represents the mean (average) of the data set, and N represents the total number of data points.
Table 1 shows that most of the questions obtained high mean scores, which indicates good experiences with the app's functionalities.
Table 1 Application functionality answers
| Question | Mean | Squared Deviations | Standard Deviation |
|---|---|---|---|
| Does the application have an accessible and easy-to-navigate interface designed specifically for users with visual impairment? | 4.778 | 0.1728 | 0.0693 |
| Does the app provide useful information about the spaces in which a visually-impaired person moves? | 4.861 | 0.1196 | 0.0573 |
| Does the mobile application improve the autonomy and safety of people with visual impairment by describing the spaces? | 4.722 | 0.2006 | 0.0748 |
| Does the app provide any type of assistance through voice functions or auditory notifications to help people with visual impairment use it effectively? | 4.833 | 0.1388 | 0.0624 |
| Is the app fast and efficient when scanning rMQR codes? | 4.778 | 0.1728 | 0.0693 |
| Is the application reliable and accurate in identifying and describing rMQR codes? | 4.833 | 0.1388 | 0.0624 |
| Does the app provide clear and understandable information about the features and objects present in the scanned spaces? | 4.750 | 0.1736 | 0.0693 |
| Does the app promote the independence and confidence of people with visual impairment when moving around separate places? | 4.722 | 0.4228 | 0.1081 |
| Does the app meet the expectations and needs of people with visual impairment when describing the spaces? | 4.667 | 0.2222 | 0.0787 |
| Does the use of the harness interfere with the mobility or restrict the movements of the person with visual impairment? | 4.778 | 0.1728 | 0.0693 |
IV. Discussion and Conclusions
In the context of this study, the standard deviation helps us understand the variability of opinions and attitudes among the participants for each question. A higher standard deviation indicates greater dispersion in the responses, implying a wider range of opinions or levels of agreement/disagreement among the participants. On the other hand, a lower standard deviation indicates lower variability and greater consistency in the responses.
By analyzing the results of the Likert scale, the standard deviation allows us to identify questions where responses tend to be more uniform and those where there is more divergence of opinions. This helps in understanding the consistency and distribution of responses, and it can also provide valuable insights into the extent to which participants agree or disagree with each statement in the questions.
Overall, most participants agree or strongly agree that the application has an accessible and easy-to-navigate interface for users with visual impairment. The mean of all responses is 4.778, indicating an important level of agreement in this area. Additionally, participants expressed a high level of agreement that the application provides useful information about the spaces where a person with visual impairment moves. The mean of all responses is 4.861, reaffirming the effectiveness of the application in providing relevant information. Regarding the improvement in the autonomy and safety of people with visual impairment by describing the spaces, participants showed a positive inclination with a mean of 4.722, indicating a favorable perception towards this functionality of the application.
It is worth noting that the application received a high score in terms of helping through voice functions or auditory notifications to help people with visual impairment use it effectively. The mean of all responses is 4.833, suggesting overall satisfaction with these features. Participants also perceived the application as fast and efficient when scanning QR codes, with a mean of 4.778, indicating a positive experience in the speed and effectiveness of the scanning functionality. Regarding the reliability and accuracy of the application in identifying and describing QR codes, participants expressed an elevated level of agreement, with a mean of 4.833, suggesting general confidence in the application's ability to provide accurate descriptions.
In terms of providing clear and understandable information about the features and objects in the scanned spaces, the application received a positive score with a mean of 4.750, indicating that participants believe the application fulfills its goal of providing clear and useful descriptions.
Concerning promoting the independence and confidence of people with visual impairment when moving in various places, the results show a positive inclination, but there is a slight standard deviation of 4.722, which could indicate variability in the participants' opinions on this aspect. This variability may indicate that individuals have a more positive experience and feel more independent and secure when using the application in various places, while others may have more diverse or even less favorable opinions.
The research presents opportunities for improvement in terms of better understanding the individual needs and expectations of people with visual impairment regarding the promotion of their independence and confidence when moving in distinct locations. Conducting additional surveys or in-depth interviews could be considered to gather more detailed information about specific areas that could enhance the users' experience in this aspect. Participants showed a significant level of agreement that the application meets the expectations and needs of people with visual impairment when describing the spaces, with a mean of 4.667, suggesting that the application successfully meets the users' expectations in terms of providing relevant and useful information.
Regarding the use of the harness, participants expressed a high degree of agreement that it does not interfere with mobility or restrict the movements of people with visual impairment.
The results indicate a positive perception of the application's accessibility, provision of useful information, improvement in autonomy and safety, assistance features, speed and efficiency in scanning QR codes, reliability and accuracy in identifying and describing QR codes, clarity of information provided, meeting expectations and needs, and minimal interference from the harness. These findings highlight the effectiveness of the application in catering to the needs of users with visual impairment and promoting their independence and confidence in various spaces.
Finally, the results obtained during the application testing are outstanding and promising for assisting this population group. Therefore, a second phase will be conducted with visually impaired individuals. In this context, we will establish communication with relevant entities such as the INCI (National Institute for the Blind), FOAL (ONCE Foundation for Latin America), and CRAC (Rehabilitation Center for Blind Adults) to carry out these tests. However, it is important to note that the mention of these institutions in this paper does not imply an obligation on their part to accept such tests.

