Introduction
Mercury is found in the environment as a result of natural and human activities. Most mercury in the atmosphere is elemental mercury vapor, while the mercury in water, soil, sediments, or plants and animals is in the form of inorganic mercury salts and organic forms of mercury, like methylmercury. Mercury accumulates most efficiently in the aquatic food web. Nearly all mercury that accumulates in fish tissue is methylmercury. Inorganic mercury does not tend to bioaccumulate (1-4).
Dietary methylmercury is very efficiently absorbed in the blood and readily distributed to all tissues, including the brain; it crosses the placental barrier, affecting fetuses’ neurological development. Mercury exposure has been linked to low birth weight and limitations related to the motor function, visual processing, verbal ability, memory, behavior, and intelligence quotient (IQ) alterations, as well as to attention disorders, among others (5-10).
A reference dose has been established to protect human health that, when ingested daily over a lifetime, and has nois anticipated to be without adverse health effects to humans, including sensitive population groups. Since the developing fetus is susceptible very sensitive to methylmercury neurotoxic effects, women of childbearing age are considered a priority population group (5-10).
Fish and shellfish intake is the most important source for of mercury exposure in humans. The mercury bioaccumulation in tissues of these those organisms is caused by the biomagnification, a process in which means a mercury concentration increases as it moves up through the aquatic trophic chain. Accordingly, the mercury concentration is lowest in sedimentary microorganisms and higher in the predator species of large size (1-4).
Measurement of mercury concentrations in fishery products has been carried out since years ago in worldwide, allowing the availability of average mercury concentrations for different species. On the other hand, scientific literature has described that mercury toxicity can be counteracted by selenium content found in fish and shellfish tissues. This raises the need to establish the selenium concentration in fishery products, its molar relationship to mercury, and the extent of its potential protective effects against mercury toxicity (11-16).
In this research, total mercury and selenium concentration was were determined in fishery products eaten eating by women of childbearing age from Bogota, Colombia. Moreover, the risk exposure to total mercury link to fishery products intake in this population group was characterized. Currently, no information on in this regard is available, although these data are key parameters for public health policy implementation.
Materials and methods
Fishery products
Fishery products included in this investigation were tuna (Thunnus thynnus), catfish (Pseudoplatystoma tigrinum), tilapia (Oreochromis sp), bocachico (Prochilodus magdalenae), nicuro (Pimelodus blochii), sardine (Sardinops sagax), salmon (Salmo salar), pangasius (Pangasius bocourti), mota (Calophysus macropterus) and trout (Oncorhynchus mykiss). These were selected considering consumption frequency, ingested portion size, purchasing, and consumption place, among other factors based on the results of a previous study in which the consumption of fishery products in women of childbearing age from Bogotá, Colombia was assessed (17).
Sample size calculation
Open Epi version 3.01 was used to calculate the sample size. Parameters considered for the calculation were a finite population of 1,.000,.000, a design effect of 1.0, a prevalence of total mercury in fishery products equal to 0.20, an accuracy of 3 %, and a reliability coefficient of 95 %.
The estimated sample consisted of 700 specimens. The number of individuals samples per fishery product was 120 for tuna, 110 for catfish, 90 for tilapia and bocachico, 70 for nicuro, 60 for sardine, 50 for salmon and pangasius, 40 for mota, and 20 for trout. This was determined through a stratified procedure, in which a 1 to 10 score was assigned based on consumption frequency, and another 1 to 2 according to intake risk. In the latter case, the assigned score was done considering scientific evidence related (Table S1).
Fishery products collection, storage, and transport
Samples were obtained at fish stores and supermarkets located in Bogota, Colombia. The minimum quantity collected for each fishery product was 250 g. Canned products, tuna, and sardines, were collected as the number of commercial marketable units equivalent to the same sample mass. Commercial units of canned products were kept away from sunlight, heat, and hitting.
Fresh and frozen product samples were packed, hermetically sealed, and labeled within polyethylene bags. These were stored in portable fridges that are equipped with cooling gels to maintain a maximum temperature of 8 °C. Marketable units of canned products were kept away from sunlight, heat, and hitting.
Finally, samples were transported to facilities of the Public Health Laboratory in Bogota District Health Department. In this place, samples were stored in portable fridges and were frozen until further analysis.
Preparation of fishery products samples
Non-canned samples were defrosted, bone parts were removed, and the remaining material was put into a mixer to obtain a homogeneous material after 10 minutes of treatment. Canned samples were taken out of their packaging and homogenized for 5 minutes. The resulting material was poured into plastic bags that were properly labeled and stored, for no more than 3 days, at a temperature range of 2 to 4 ° C.
Mercury determination
Measuring of total mercury content was conducted without previous sample digestion, but through thermal decomposition, amalgamation, and atomic absorption spectrophotometry (US EPA method 7473), using a Direct Mercury Analyzer (DMA-80 Milestone). 100 mg of homogenized sample weighted in a clean and dry quartz cell were introduced into the analyzer and processed through a drying phase at 160 °C for 30 s; a decomposition stage at 160 °C for 70 s; a catalytic step at 650 °C for 45 s, and the amalgam breakdown at 650 °C for 150 s. All sample analysis analyses were duplicated. The estimated test detection limit was 0.0001 mg/kg, and the established quantification limit was 0.001 mg/kg.
Selenium determination
Selenium measurement was performed by Zeeman graphite furnace atomic absorption spectroscopy, using the ICE 3400 equipment (Thermo Fisher). The analysis procedure included mixing 1 g of homogenized sample with 5 ml nitric acid in a 50 ml conical tube that was kept overnight at ambient temperature. Further, the tube was heated at 70 °C for 75 minutes in a thermostatic bath, then it was allowed to cool at ambient temperature, and its volume was completed with deionized water.
Eventually, the resultant material was poured into a 10 ml volumetric flask containing 500 μL of 2 % nickel nitrate solution used as a matrix modifier. After that, 20 μL of the mixture were injected into the ICE 3400 equipment for analysis. First, a drying stage was conducted at 100 °C for 40 s, followed by calcination at 1,000 °C for 170 s, atomization at 2,200 °C for 3 s, and cleaning at 2,500 °C during 3 s.
The analysis was conducted using duplicate samples. The estimated test detection limit was 0.005 mg/kg, and the established quantification limit was 0.01 mg/kg.
Se:Hg molar ratio and molar excess of selenium
Selenium and mercury concentrations were used to calculate moles for each element. Selenium to mercury molar ratio (Se:Hg) was obtained, calculating a simple molar proportion corresponding to each sample and fishery product analyzed. The Molar molar excess of selenium was estimated by subtracting the number of mercury moles from those of selenium found on each sample and fishery product analyzed.
Exposure assessment and risk characterization
Exposure assessment was conducted using @RISK program version 5, developed by Palisade Corporation. The mathematical expression used considers food intake, mercury concentration in food, individuals body weight (bw), absorption (Fabs), and exposure (Fexp) factors. The abovementioned aforementioned factors were considered constants, assuming the maximum possible value for the worst-case scenario (Equation (1)).
Intake and body weight data were obtained from a previous study (17). Fishery products intake was established from a sample of 1,015 women of childbearing age surveyed in Bogota, Colombia (16). The food intake data for each fishery product was normalized to a gram per day unity (g/d), considering portion size (Table S2), number of ingested portions, and frequency factor (Table S3) as shown in Equation (2).
Single point and probabilistic estimations were obtained, according to data availability. The probabilistic ones considered a minimum of 20 data points. The best fit model for food intake data, total mercury content in food, and body weight were selected based on Akaike Information Criterion (AIC). Probabilistic estimations required 10,000 Monte Carlo iterations.
The hazard coefficient calculation (Equation (3)) assessed risk characterization to total mercury, which divides exposure extent by the toxicological reference dose (RfD) for a specific substance. The RfD corresponds to the provisional tolerable weekly intake (PTWI) to total mercury (4 µg/kg bw) recommended by the Joint FAO/WHO Expert Committee on Food Additives (JECFA), which was expressed as a daily intake value (5,7 x 10⁻⁴ mg/kg bw) (18).
Statistical analysis
Statistical analysis for mercury and selenium content, and Se:Hg molar ratio and molar excess of selenium was performed using SPSS, version 22 (IBM) statistical package. In all cases, statistical significance was selected at α = 0.05 with a confidence interval of 95 %. Data distribution normality was assessed using Shapiro-Wilk or Kolmogorov-Smirnov tests, depending on sample size in the groups. Homoscedasticity was determined employing the Levene test since samples of the groups did not follow the normal distribution. The Welch test estimated the contrast between, as variances were not equal on samples of the groups. Finally, Games-Howell post-hoc test was used to identify the groups in which statistically significant differences occurred.
Results
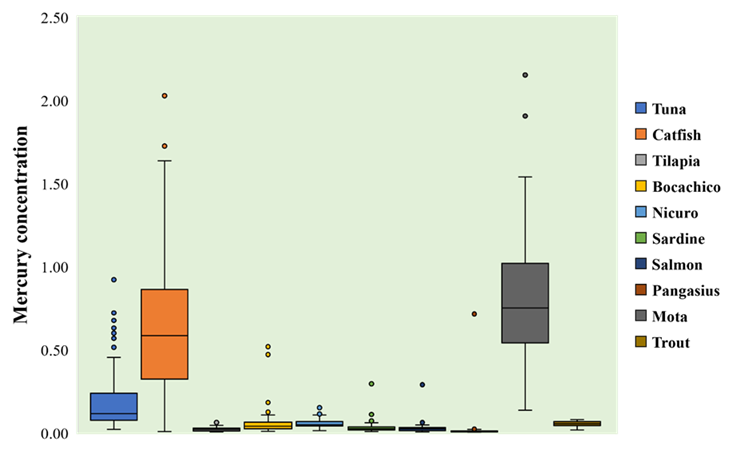
Mean total mercury concentration for mota (0.8166 mg/kg, CI95% [0.6864 to 0.9469]) and catfish (0.6275 mg/kg, CI95% [0.5512 to 0.7038]) was high, while its lowest values corresponded to pangasius (0.0207 mg/kg, CI95% [-0.0071 a 0.0485]) and tilapia (0.0194 mg/kg, CI95% [0.0168 to 0.0220]). In general, there were statistically significant differences among total mercury mean contents for all fishery products (F = 66.8, p <0.05), being especially noticeable when comparing mota and catfish to other species (Figure 1, Table S4).

Figure 1 Total mercury concentrations in fishery products. The total mercury levels are expressed as milligram of element over kilogram of product (mg/kg).
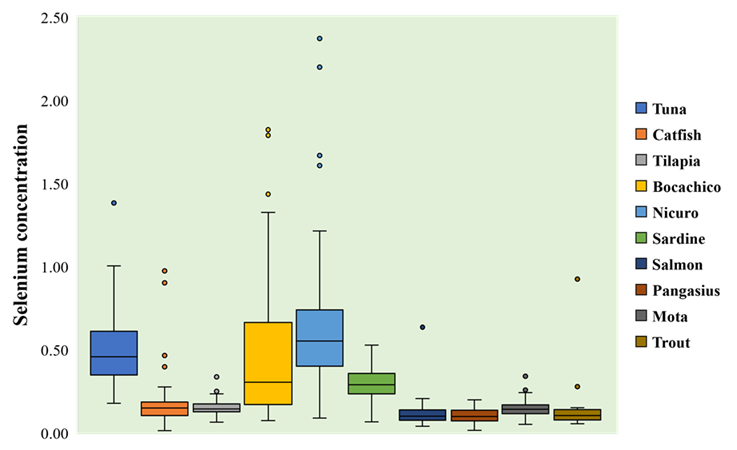
Regarding selenium, the highest mean concentration was observed for nicuro (0.6471 mg/kg, CI95% [0.5500 to 0.7442]), whereas the lowest mean selenium contents corresponded to salmon (0.1121 mg/kg, CI95% [0.0888 to 0.1354]) and pangasius (0.1003 mg/kg, CI95% [0.0884 to 0.1122]). There were statistically significant differences among mean selenium contents for all fishery products (F=78.8, p<0.05). The highest extent for these differences was observed for nicuro compared to other species (Figure 2, Table S5).

Figure 2 Selenium concentrations in fishery products. Selenium levels are expressed as milligram of element over kilogram of product (mg/kg).
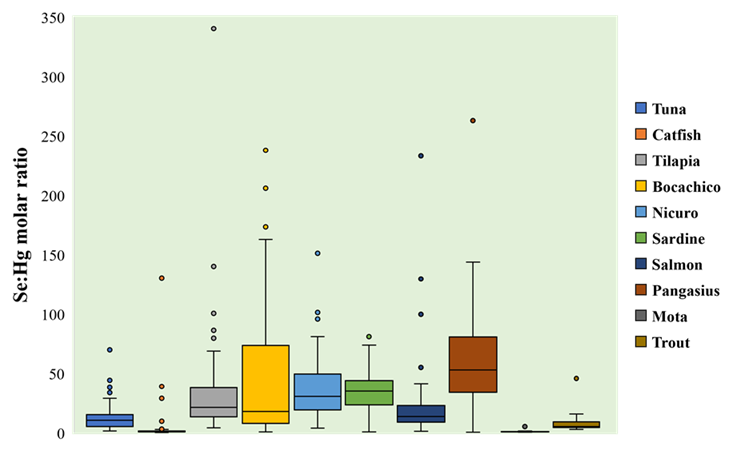
The highest Se:Hg molar ratio was found for pangasius (60.16, CI95% [48.25 to 72.07]), and the lowest corresponded to catfish (2.91, CI95% [0.46 to 5.37]) and mota (0.63, CI95% [0.40 to 0.86]). There were statistically significant differences for Se:Hg molar ratios’ mean for all fishery products (F=83.5, p<0.05). The highest extent for these differences was observed for pangasius and mota compared to other species (Figure 3, Table S6).

Figure 3 Se:Hg molar ratio in fishery products. Molar ratio is expressed as the fraction of selenium moles over mercury moles.
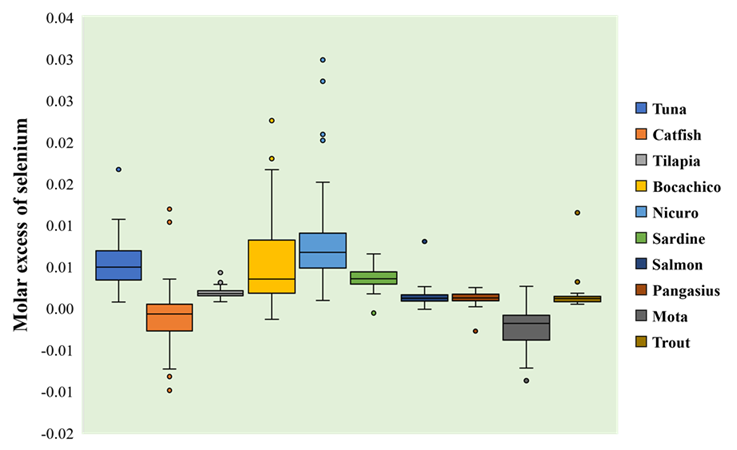
Considering the molar excess of selenium in fishery products sampled, the highest positive balances were found for nicuro (0.0079 mol/kg, CI95% [0.0067 to 0.0091]), bocachico (0,0055 mol/kg, CI95% [0,0045 to 0,0066]) and tuna (0.0053 mol/kg, CI95% [0.0048 to 0.0057]), whereas the most negative balances were registered for catfish (-0.0011 mol/kg, CI95% [-0.0017 to -0.0066]) and mota (-0.0023 mol/kg, CI95% [-0.0029 to -0.0016]). There were statistically significant differences among mean molar excess of selenium for all fishery products (F = 84.9, p <0.05). The highest extent of these differences corresponded to nicuro and mota when compared to the rest of species (Figure 4, Table S7).

Figure 4 Molar excess of selenium in fishery products. Molar excess of selenium is expressed as mol of element over kilogram of product (mol/kg).
Finally, the risk characterization showed that dietary exposure to total mercury in women of childbearing age was lower than the reference dose in most of the samples of the fishery products analyzed. In the mota case, dietary exposure risk to total mercury was considerably highest than the reference dose (Table 1).
Table 1 Exposure assessment and risk characterization to total mercury in fishery products
| Fishery product | Exposition P95 (mg/kg bw/day) | Risk P95 |
|---|---|---|
| Tuna | 1.20 x 10⁻⁴ | 0.224 |
| Catfish | 4.90 x 10⁻⁴ | 0.870 |
| Tilapia | 2.11 x 10⁻⁵ | 0.037 |
| Bocachico | 8.25 x 10⁻⁵ | 0.145 |
| Nicuro | 2.72 x 10⁻⁵ | 0.047 |
| Sardines | 8.98 x 10⁻⁶ | 0.016 |
| Salmon | 1.00 x 10⁻⁴ | 0.186 |
| Pangasius | 5.07 x 10⁻⁶ | 0.009 |
| Mota | 4.88 x 10⁻³ | 8.566 |
| Trout | 1.41 x 10⁻⁴ | 0.247 |
Note. The exposure was established considering food intake, mercury concentration in food, individual's body weight, absorption factor, and exposure factor. On the other hand, the risk was estimated through the calculation of the hazard coefficient.
Discussion
The mean total mercury concentration for the fishery products sampled in this research ranged from 0.0194 to 0.8166 mg/kg. The upper limit lies below the interval 0.02 to 2.45 mg/kg reported in a previous review on mercury contents for different fish species from 12 departments of Colombia (19). Considering selenium, its mean concentration in the fishery products sampled varied around 0.10 to 0.65 mg/kg; these values are alike to those registered in fishes from Brazil (0.02 - 0.44) (20) and Croatia (0.18 - 1.12) (21) and lower than those determined in fish from Turkey (0.96 - 1.86) (22), United States (0.96 - 11.45) (23) and Argentina (0.47 - 4.57) (24).
There were statistically significant differences between total mercury and selenium mean concentrations. However, no exploration of these difference’s conditioning factors was conducted. It has been described in the scientific literature that mercury and selenium concentrations in fish tissues depend on its environmental bioavailability, bioaccumulation capacity of aquatic microorganisms, age, sex, size, and species location within the trophic chain, among others (25-29).
According to Colombian regulations, the maximum total mercury concentration allowed in fish and shellfish is 0.5 - 1.0 mg/kg, depending on the species type assessed (30). It was evidenced that the total mercury means concentration in catfish and mota exceeded the allowed level of 0.5 mg/kg. Further, 66.0 % and 77.0 % of the samples collected from these species, respectively, surpassed this legal threshold value.
For selenium, a threshold value in fish and shellfish has not been established in Colombia. However, in the scientific literature has been described that a selenium excess content in fish tissues could have a protective effect against mercury toxicity. The high affinity between both elements and the selenium properties to reduce mercury gastrointestinal absorption, transform organic mercury into inorganic forms, produce stable and inert complexes, and redistribute mercury to less sensitive organs, are some mechanisms stated to explain this protective aspect effect (15-16).
Se:Hg molar ratio and molar excess of selenium have been suggested as indicative parameters of selenium’s protective effect against mercury toxicity (13-14). However, whether these parameters are sufficiently robust to represent the potential protective effect of this chemical element is still under discussion, so its role on mercury exposure risk assessment is not completely accepted yet (31-32). Therefore, results obtained for both parameters in this research showed that a protective effect against mercury toxicity could be offered by intake of the fishery products assessed, except for catfish and mota. No additional analysis on the protective effect of selenium was intended.
It was found that women of childbearing age risk exposure to total mercury by intake of the fishery products analyzed was lower than the daily reference dose (5.7 x 10⁻⁴ mg/kg bw) (18). However, the dietary exposure risk estimated for mota exceeded this threshold by 8.56-fold. In this regard, a previous study found that bocachico (Prochilodus magdalenae) and corroncho (Chaetostoma spp.) intake, in two Valle del Cauca department townships, represented a relatively high dietary exposure risk to total mercury for the lactating women population since the reference dose value was also exceeded (33).
Additionally, in a recently published research, mercury concentrations in blood, urine, and hair samples from a women group in the Mojana region were higher than the allowed maximum value in 62.8 % of the cases. The study also pointed out that mercury concentration was higher for women who reported a relatively high fish consumption frequency than those who did not. Further, multiple regression models described that those women with daily fish intake had 33-fold higher mercury concentration in hair samples than those who did not report the daily intake of this food (34).
Finally, a continuous mercury concentration monitoring program in fisheries marketed for consumption in Bogota, Colombia, is required. This will allow permanent data updating, aiming to conduct an appropriate dietary exposure risk assessment for Bogota’s women of childbearing age and the general population since some fishery products available are captured from water bodies contaminated with mercury.
Conclusions
Mota intake considerably increases exposure risk to total mercury in women of childbearing age from Bogota, Colombia. The selenium levels established in the fishery products assessed, except for catfish and mota, are theoretically suggestive of a protective effect of selenium against mercury toxicity. Consequently, continuous total mercury concentrations monitoring is required to protect the health of the women of childbearing age and the general population from Bogota, Colombia.


