Introduction
Chalcones are precursors of flavonoids and isoflavonoids present in edible plants. Their derivatives have attracted increasing attention due to their numerous potential pharmacological applications. They have displayed a broad spectrum of pharmacological activities that derive from the changes introduced in their structure by adding different substituents in their aromatic rings. These variations proved to be helpful for developing new medicinal agents, having improved potency and lesser toxicity1-3.
Chalcones are important structural units, most of which exhibit significant biological activity. The wide range of biological activity associated with many Chalcone derivatives isolated from natural products has stimulated interest in developing synthetic strategies to synthesize heterocyclic systems based on the chalcone core. Along with efficient methodologies implemented for their preparation, investigations have also focused on studying their reactivity and assessing their possible biological activities4-6. Particularly in the pharmaceutical field, chalcones and their derivatives have been used in different applications for treating cancer6-12.
Chalcones can be used as a fluorescent probe because of their pi-conjugated propenone core13-15. Therefore, the potential use of luminescent chalcones in biological and medical fields depends on the knowledge of their mode of action.
Up to date, luminescent biomarker properties of chalcones were almost unknown. Therefore, to promote the use of chalcones as biomarkers in biological and medical fields, more studies concerning their cellular uptake, subcellular localization, and cytotoxicity3,6-8,10,11,14 should be undertaken.
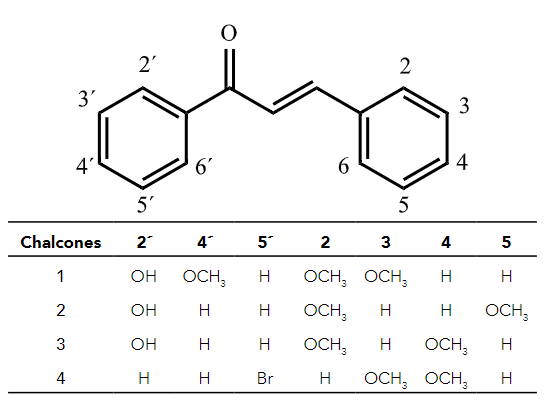
In this study, we evaluated both the antitumoral activity and the luminescent properties of a set of synthetic chalcone derivatives (Figure 1) to assess their potential as biomarker agents.
Materials and Methods
Synthesis of Chalcones
The synthesis of the compounds 1, 2, 3, 4 has been previously described as follows:
Chalcones were prepared following a previously described methodology8,11,16 by adding, in a dropwise manner, a solution of the corresponding substituted benzaldehyde, (7.34 mmol in 98 ethanol, 20 mL) to a stirred mixture of 2´-hydroxyacetophenone solution (7.34 99 mmol, in ethanol, 20 mL) and potassium hydroxide solution (2g in 10 mL distilled water). The mixture was allowed to react overnight at room temperature. Then, it was diluted with distilled water (200 mL), neutralized with hydrochloric acid, and extracted four times with ethyl acetate (50 mL). The compounds were crystallized from ethanol. All these compounds have been described before8,11,16.
Cell culture
The HepG2 hepatocellular carcinoma cell line (HB 8065; American Type Culture Collection, ATCC), derived from a human hepatoblastoma 17, was maintained in Dulbecco´s modified Eagle´s (DMEM)-high glucose (GIBCO) with 10% heat-inactivated fetal bovine serum (FBS), and 50 U mL-1 penicillin-streptomycin (Sigma). HUVEC-derived endothelial cell line (EA.hy926) was kindly provided by C-J Edgell. It was grown in DMEM-low glucose (GIBCO) supplemented with 10% heat-inactivated FBS, 2 mmol L-1, and 50 U mL-1 penicillin-streptomycin (Sigma). All cell cultures were grown at 37 ºC in a 5%: 95% CO2: air atmosphere.
Cell viability assay
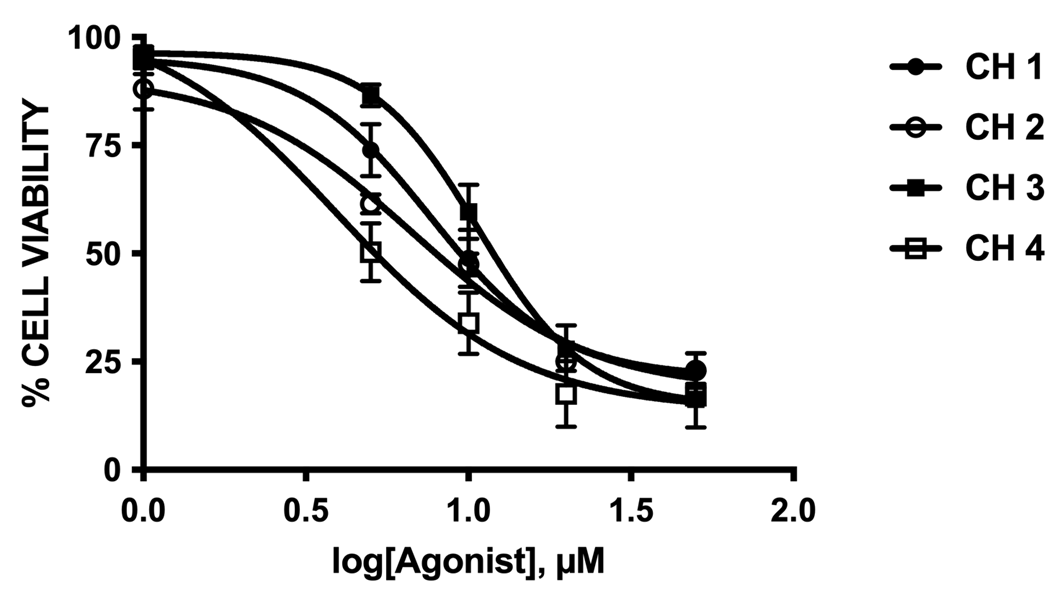
Cell viability was evaluated using the 3-(4,5-dimethylthiazol-2-yl)-2,5-diphenyltetrazolium bromide (MTT) colorimetric assay (Invitrogen, Eugene, Oregon, USA). Cell viability was quantified by the amount of MTT reduction assay 18 HepG2 and EA.hy926 were exposed to different concentrations of chalcones for 48 hours. After treatment cells were co-incubated with MTT (0.5 mg/mL) for 4 hours, and then solubilized with an acidified (0.04 N HCl) isopropanol/dimethyl sulfoxide (DMSO) solution in equal proportions. Optical density was measured at 540 nm. All experiments were performed as triplicates. Cell survival (%) data were plotted and adjusted to a sigmoidal best-fit curve, where: EC50 is the chalcone concentration to reach the half-maximal cell survival.
Epifluorescence microscope in live cells
HepG2 and EA.hy926 cells cultured in 6-well plates were exposed to different concentrations of chalcones for 24 hours. The cells were washed twice using phosphate-buffered saline (PBS) and visualized using a FLOID® Cell Imaging Station (N = 3-5).
UV-Vis absorption measurements
Electronic spectroscopic data were collected at room temperature on a MeOH solution using a Jasco V-630 UV-vis spectrophotometer. Measurements were recorded between 1000-190 nm with a data interval of 0.1 nm.
Fluorescence measurements
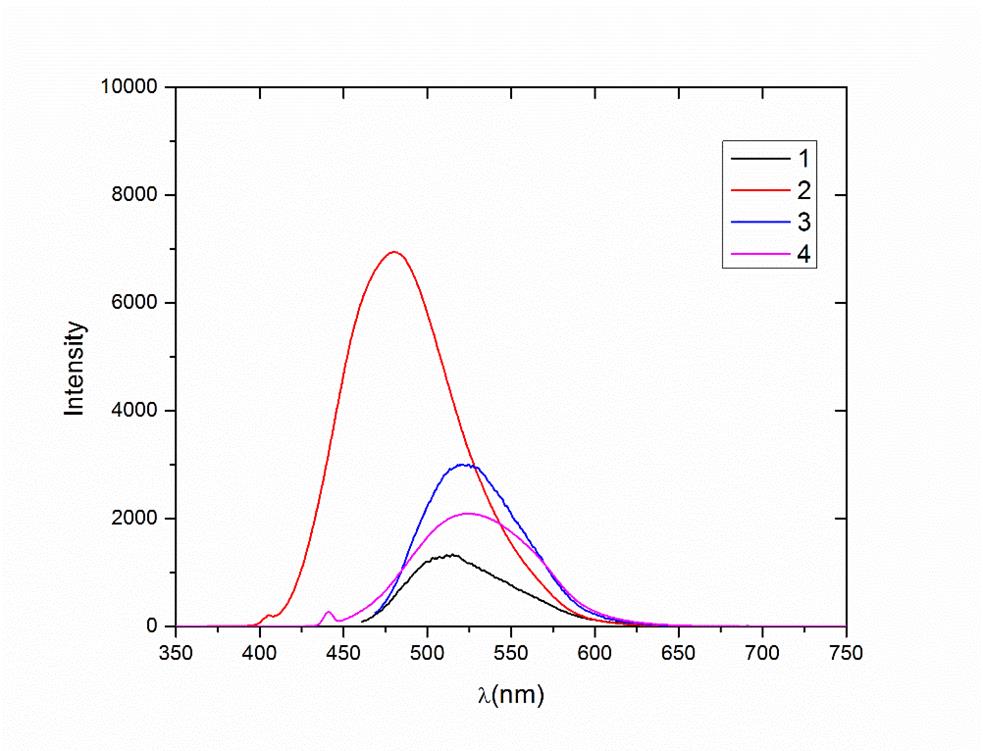
Emission and excitation spectra were recorded on a JASCO spectrofluorometer (FP-6200) using a 1 cm path length JASCO spectrofluorometer (FP6200) using a quartz cuvette of 1 cm path length. Excitation wavelengths for all complexes were set to 347, 405, 460, and 362 nm. Those wavelengths correspond to the maximum absorption in the UV-Vis spectra. The fluorometric characterization was carried out at room temperature. All emission spectra measurements were recorded between 250 and 750 nm.
Computational Details
The geometry optimizations and computational properties of the Chalcone family were performed using density functional theory (DFT) implemented in the Amsterdam density functional package (ADF2012)19.
The computations of the ground and excited states were carried out using the ZORA Hamiltonian incorporating scalar relativistic corrections20. Triple-ӡ slater basis set plus two polarization functions (TZ2P)21 and the nonlocal correction for the exchange and correlation (XC) incorporated via the general gradient approximation (GGA) within the functional BLYP were employed. The molecular structures were fully optimized without symmetry constriction. The excitation energies were estimated by Time-Dependent Density Functional Theory (TDDFT)22. This methodology is based on the linear response formalism within the iterative Davison procedure implemented in the ADF code. The calculations performed by the first-principles method let to obtain accurate excitation energies and oscillator strengths for the calculated complexes. Solvation effects were simulated by a ‘‘Conductor-like Screening Model’’ (COSMO)23 using methanol as solvent.
Results and Discussions
A luminescent biomarker is a possible indicator of the biological state of the disease. It is characteristic of a specific state and, therefore, can be used as a marker for a target disease. These biomarkers are usually appropriated to study cellular processes and monitor or recognize disruption or alterations in the cellular processes of cancer cells. Luminescent biomarkers, specifically cancer biomarkers, indicate cancer presence, and detecting them can verify the existence of that specific disease24,25.
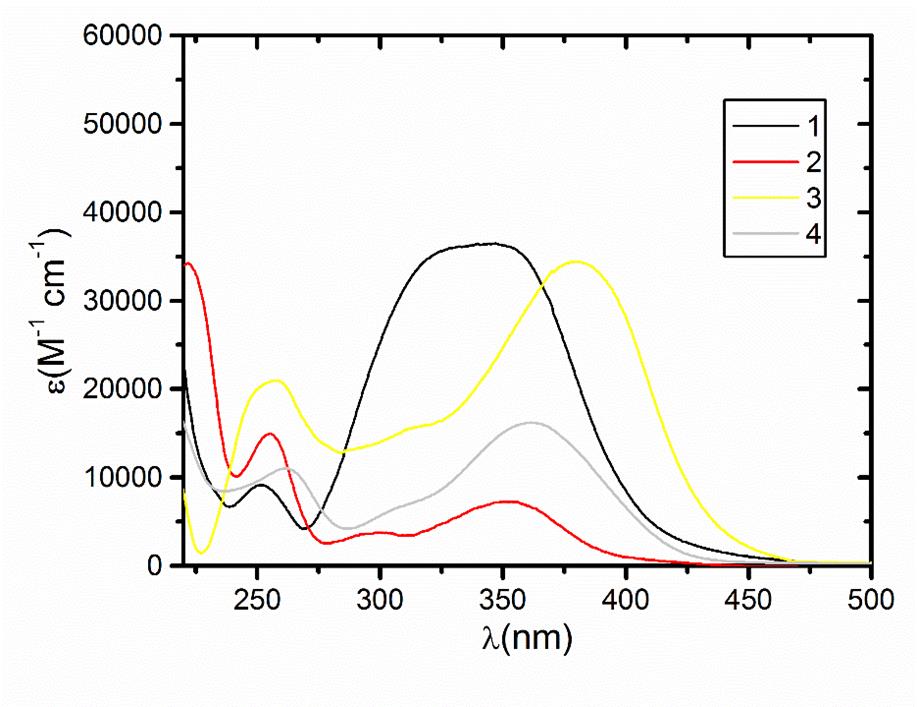
The optical properties of the compounds indicate that all the structures allow σ → σ* or π → π* transitions in the UV-Vis region with high extinction coefficients (Figures 2 and 3). The frontier orbitals are the highest occupied MO (HOMO) and the lowest unoccupied MO (LUMO). We focused on these two orbitals because they are the closest in energy. These orbitals are intimately involved in chemical reactivity because they are the most available to electrophiles and nucleophiles, respectively. Another key change has to do with the frontier orbitals, the π (HOMO) and π* (LUMO) orbitals.
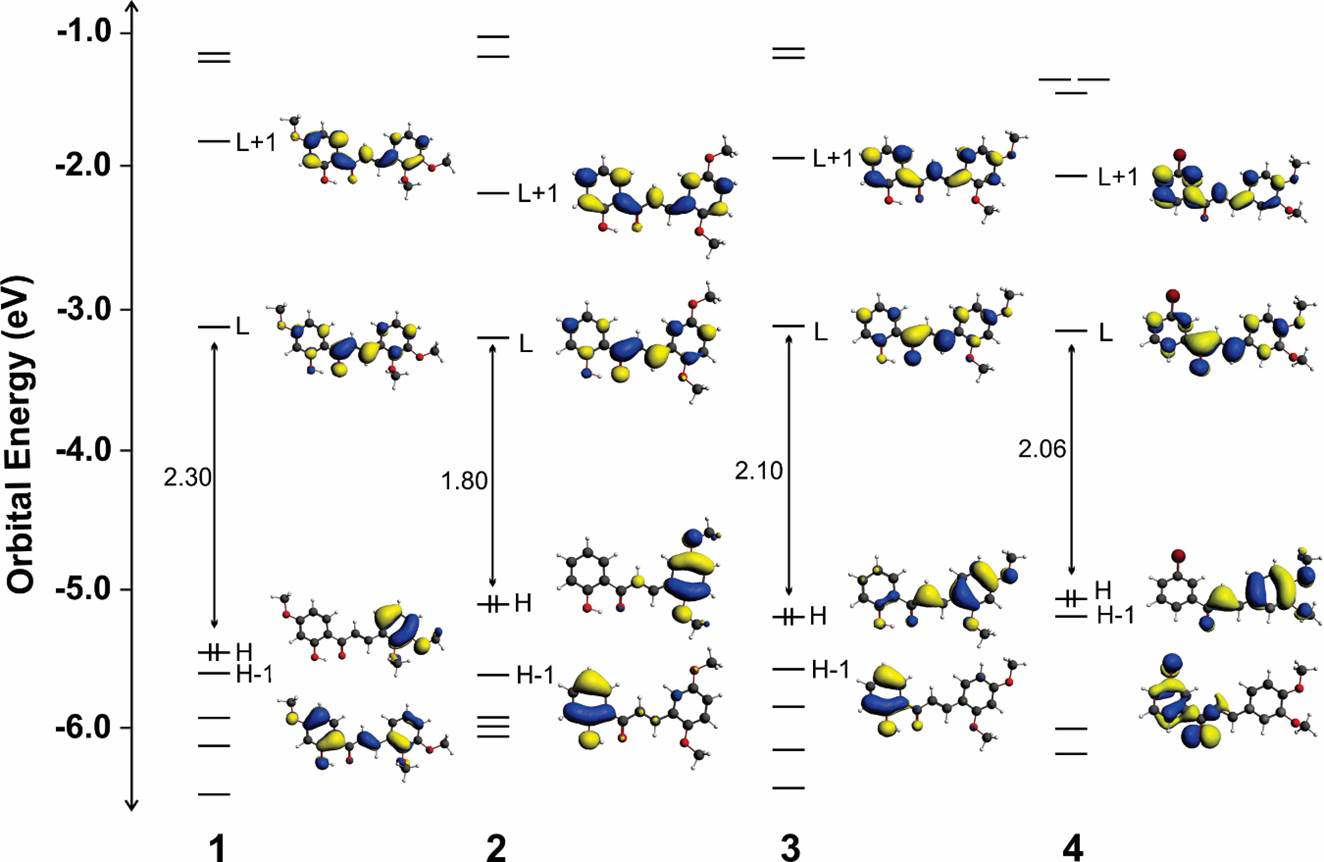
The HOMO represents the ability to donate an electron, and LUMO as an electron acceptor represents the ability to get an electron. This electronic absorption corresponds to the transition from the ground to the first excited state. This is mainly described by one electron excitation from the highest occupied molecular or orbital (LUMO) the highest occupied molecular orbital (HOMO) and lowest unoccupied molecular orbital (LUMO) are the main orbitals taking part in chemical stability. Also, 3D plots of HOMOs and LUMOs for the title compounds are shown in Figure 4 and considered all occupied and unoccupied energy levels in a diagram that shows how the energy changed among the levels.
Figure 4 shows the orbital energy levels of the frontier Kohn-Sham molecular orbitals (MOs) and the isosurfaces plots of the lowest unoccupied molecular orbital (LUMO+1 and LUMO) and the highest occupied molecular orbitals (HOMO and HOMO-1). In the case of the LUMO energy of the studied chalcones, these lie at approximately -3.1 eV. In chalcones 3 and 4, the HOMO energy is approximately -5.2 eV. Chalcone 1 displays the most stable HOMO showing the largest HOMO-LUMO gap, and chalcone 2 displays the less stable HOMO showing the shortest HOMO-LUMO gap. In all compounds, the HOMOs are confined to the p-orbitals of the same ring, but 3 and 4 show significance of the bridge orbitals. HOMO-1 orbitals are confined to the p-orbitals over the other ring. On the contrary, the LUMO orbitals are extended over the whole molecules with few compositions of the substituents.
The biological properties of chalcones and the potential use of luminescent chalcones depends on the investigation of their cellular uptake, subcellular localization, and cytotoxicity.
Considering that EA.hy926 and HepG2 cells showed a cytotoxic response to the chalcones, we exposed these cells to a value close to IC50 for 24 hours and observed by a FLOID® Cell Imaging Station the intrinsic fluorescence. Cell membrane penetration of the EA.hy926 and HepG2 cells for 24 hours showed chalcones inside the cells, localized mainly in the cytoplasm. The HepG2 and EA.hy926 cells showed similar intracellular accumulation of chalcones, whereas cells treated with the vehicle did not exhibit green fluorescence (Figures 5a and 6a). Cells treated with chalcones for 24 hours showed intracellular green marks that were attributed to the presence of the chalcones (Figures 5b,c,d,e, and 6b,c,d,e ). These results demonstrated that chalcones entered to the cells.

Figure 5 Incorporation and morphologic changes in EA.hy926 cells exposed to chalcones. EA.hy926 cells were grown por 24 h, then treated with chalcones for 24 h. Figures show representative phase-contrast images from at least three separated experiments of EA exposed to vehicle (control) (A), 10 μM of compound 1(B), 10 μM of compound 2 (C), 10 μM of compound 3 (D), 5 μM of compound 4 (E).

Figure 6 Incorporation and morphologic changes in HepG2 cells exposed to chalcones. HepG2 cells were grown for 24 h, then treated with chalcones for 24 h. Figures show representative phase-contrast images from at least three separates experiments of HepG2 exposed to vehicle (control) (A), 15 μM of compound 1(B), 30 μM of compound 2 (C), 30 μM of compound 3(D), 10 μM of compound 4 (E).
The current report describes for the first time the use of chalcones as a specific luminescent biomarker agent against tumor cells. We studied the cytotoxicity of chalcones in different cell cultures from tumoral cell lines (table 1 and figure 7) to assess its antitumor activities. We also report the cellular uptake of luminescent chalcones and their subcellular distribution (Figures 5 and 6).
Table 1 The IC50 value on EA.hy926 and HepG2 incubated with different chalcones for 48 hours. Cell viability was measured using the MTT assay. Data area expressed as mean +/- SEM from the three independent experiment, each performed in triplicate.
| Chalcone | EA.hy926 IC50/μM | HepG2 IC50/μM |
| 1 | 7.66 ± 0.46 | 10.65 ± 0.98 |
| 2 | 6.76 ± 1.89 | 27.61 ± 2.51 |
| 3 | 10.73 ± 0.11 | 31.26 ± 2.42 |
| 4 | 3.92 ± 1.34 | 8.27 ± 0.19 |
Conclusion
Based on their fluorescent properties, the chalcones may be helpful for cancer diagnostics, tumor localization, and may enable the observation through the fluorescence of tumor regression during treatment. The findings reported here represent the first attempts to use chalcones as biomarkers in cancer disease. We are currently planning new experiments to shed light on the complex mechanisms involved.


