


 English (pdf)
 Article in xml format
 Article references
 Send this article by e-mail
 Cited by SciELO
  Cited by Google
  Similars in
SciELO
Similars in
SciELO  Similars in Google
 Permalink
Introduction
Information systems have had a fast development in last decades, so their integration into supply systems became a key task to implement different strategies, with the purpose of obtaining better overall results. For companies that mainly use roads to distribute products, appropriate management of goods and availability have become an important factor to satisfy customer requirements or demands.
Thus, companies should perfom two tasks factors within the distribution process: (i) satisfying customer requirements and (ii) managing inventory levels. It is desirable to have a balance among inventory levels, costs, service levels, and speed of response, since lower inventory levels could mean lower inventory costs, but also shortages and/or lower service levels.
Correct coordination between different echelons of a supply chain can ensure an improvement in its global performance, and there is evidence of how linking internal processes or decisions to suppliers and customers lead to improvements due to integration and cooperation [1]. Thus, that which leads to distribute goods through a central depot or agency also leads to the implementation of vendor-managed inventory strategies [2]. This kind of logistic systems also shares resources with different echelons of the supply chain, which allows improving its overall performance. These resources can be used by a central depot to be delivered to other echelons with higher shortage risk or to reduce service levels.
This paper is then focused in a supply chain model with a central depot that shares resources with different echelons through coordinated decisions. The paper is organized as follows: section 2 consists of a literature review; in section 3, the proposed mathematical model is presented; section 4 comprises the analysis and results; and finally, conclusions are explained in detail.
Literature review
Several approaches have addressed the problem of distributing goods to a set of customers. For instance, Attiaa, Ghaithanb, and Duffuaa [3] develop a model for an oil and gas supply chain. They proposed a mathematical model that considers different echelons of the oil and gas supply chain from the production fields to final demand terminals using two objective functions: i) minimization of total costs and ii) maximization of revenue. It also solved a three-period example with a sensitivity analysis to finally determine the final price of the oil distributed through the network. A similar study was done by Huanga et al. [4], where jet fuel distribution in accordance with production decisions was modeled using a multi-objective four-stage supply chain optimization model which considers total production costs and green emissions (a gas supply chain problem was also solved by Zarei and Amin-Naseri [5]).
Other studies aim to optimize distribution processes without considering special conditions such as the specific type of goods/products (those general problems can be solved using classic inventory routing problem models and their extensions). The problem addressed here consists to make distribution decisions over a planning horizon, a set of customers, vehicle capacity constraints, and customer inventory capacities. Furthermore, customers have their own demand that changes over time, as well as varying inventory capabilities. This problem has been previously studied in the literature with different extensions and variations. Some authors have developed some exact methods for analyzing different sizes of network instances in a deterministic environment [6] -[9]. Other authors consider uncertainty mostly over the demand and travel times [10] -[12] and other extensions [7], [13] -[15]. Fuzzy uncertainty was considered by López, Méndez, and Franco [16] for a design/distribution problem over supply chain networks with fuzzy demands (represented as fuzzy numbers) as an uncertainty source whose solution was provided as a three-stage linear optimization model.
Reverse logistic supply chain problems involving recycling products under uncertainty were solved by Kim, Chung, Kang, and Jeong, who proposed [17] the use of robust representation of uncertainty in two stages: i) a deterministic model and ii) adaptation of robust constraints. Some simulation-aided experiments were performed to emulate uncertain conditions and determine how robust variables work.
Nowadays, the global economy and highly competitive markets force companies to develop innovative strategies to achieve a high level of services to customers, so cooperation and collaboration between different echelons becomes an important strategy to improve performance at different levels of the supply chain. For example, the work by Quintero-Araujo, Gruler, Ángel, and Faulin [18] is based on the concept of vertical/horizontal cooperation, where metaheuristics were used for analyzing collaboration strategies in a distribution network with shared resources for three different scenarios: i) non-cooperative, ii) semi-cooperative, and iii) fully cooperative. In their study, iii) showed lower costs as a result of less depots being opened and reduced routing costs.
A backhaul-based horizontal cooperation analyzing the effects of the cooperation and the environmental impact of road transportation was developed by Ángel, Faulin, Perez-Bernabeu, and Josewoiez [19]. Additionally, Caballini, Sacone, and Saeednia [20] used cooperation for drayage operations, where time windows, trip deadliness, and fleet size were considered over several experiments focused to analyze the number of trips, carrier profit, and others over an Italian real dataset.
This paper proposes a cooperation-inclusion model, where goods are delivered from a depot to a set of customers who can share them with the depot in order to satisfy requirements coming from customers in the network. Some healthcare, food, and humanitarian operations problems use a similar approach [21] -[25].
Proposed mathematical model
Demands are one of the main uncertainty sources in time horizon planning-based supply chains, so, in this paper, we considered them as stochastic variables. In this model, central depot determines replenishment/sharing decisions (similar to those strategies considered in VMI models [26]. In this sense, the main idea of the model is to determine when the product on inventory of a customer can be shared with the central depot for redistribution, aiming to minimize the stock outs of the network. The proposed mathematical model works with a planning horizon T, where a set of customers N or distribution points that belong to the network and the node n = 0 correspond to the central depot. All customers have their own initial inventory levels II n , and the central depot has its own, represented by II 0 . For each time period, there is an amount of product Q t available at the central depot that can be distributed along the network. Also, each node of the network must guarantee a minimum percentage of safety stock R sn given stochastic demands d nt . Key notations, set definitions, parameters and decision variables are defined as follows:
Sets:
Parameters:
II n = Initial inventory levels at customer n ∈ N
II 0 = Initial inventory levels at customer at central depot
Q t = Amount of product available that can be used by the central depot at period t ∈ T
Rs n = Risk index of safety stock of customer n ∈ N
d nt = Stochastic demand at customer n ∈ N at time period t ∈ T
r n = Risk aversion of customer n ∈ N of delivering product to the central depot
Decision variables:
x nt = Amount of product delivered by the central depot to customer n ∈ N at period t ∈ T
y nt = Amount of product shared by customer to the central depot n ∈ N at period t ∈ T
z nt = Amount of product available that can be used to satisfy the demand by customer n ∈ N at period t ∈ T
I nt = Final inventory levels of customer n ∈ N at period t ∈ T
SS n = Safety stock of customer n ∈ N
The mathematical model proposed is as follows:

Subject to:


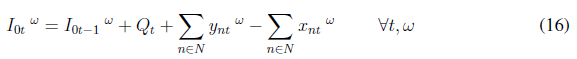
The objective function (1) aims to minimize expected shortages over the network for all periods of time. Constraint (2) represents customer inventory levels represented by the amount of product that comes from the central depot and the amount of product shared with the central depot in order to support other distribution points. The same idea goes to (3), where inventory levels are modeled for the central depot considering the amount of available product, the distributed product, and returns coming from other nodes of the network. Constraint (4) ensures the central depot to receive the amount of delivered product only if safety stocks are greater than inventory levels.
Constraint (5) sets the minimum inventory levels for each customer, given predefined safety stock levels. Those safety stocks are determined by Eq. (6) as the amount of product that customers are unable to share with the central depot due to uncertain demands. Constraint (7) ensures that the amount of product delivered from the central depot cannot exceed its availability. Eq. (8) guarantees that the amount of product sent to satisfy demands cannot exceed the customer demands. Finally, Eq. (9) defines the codomain of all decision variables.
Note that both the objective function (1) and constraint (4) are nonlinear. To linearize the objective function, we have added the new variable ω nt and the following constraint:

Eq. (4) is also modified by adding a new binary variable g nt as follows:


As the demand is assumed to be stochastic, uncertain demands are modeled by using possible scenarios. Therefore, we added a set of S scenarios indexed by the superscript ω. Finally, the complete mathematical model is as follows:


Experimentation
To test the proposed model, we used the instances presented by Coelho, Cordeau, and G. Laporte [9]. Three sets of probabilities were used to define and analyze scenarios:
Average: scenarios with the same probability of occurrence
Extreme values with lower probability: scenarios with probabilities higher than 0,25
Extreme values with higher probability: scenarios with probabilities higher than 0,75
Then, for each customer, different demand values were generated using different scenarios over different periods of time. In this sense, we generated the random variable
 using the instances proposed by Coelho, Cordeau, and G. Laporte [9] and the demand values to generate the different scenarios as previously shown with the aforementioned probabilities. Three performance measures were implemented to analyze the obtained results:
Shortage: it is the shortage amount per customer, measured as the maximum and expected values of shortage.
Product share: it is the amount of product shared to the central depot. Maximum values for the planning horizon and expected values are presented.
Product delivered to the customers: it is defined as the expected value delivered to each customer per period.
An instance composed by 5 customers, 3 time periods, and a safety stock risk index and risk aversion of 0,2 per customer was implemented. Results are shown in Table I. To solve the proposed model, we used the Xpress-MP optimization software.
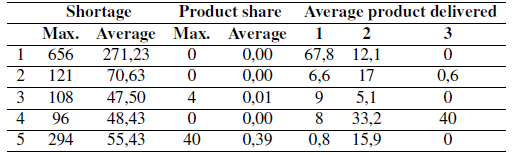
Table I shows that, given the risk aversion and safety stock levels, the amount of shared product to the central depot is low with higher shortage levels. Fig. 1 shows the average amount of shortage inventory and demands of all customers.

It is clear that customers do not share product to the central depot when they have short demands, which implies higher shortage levels. Only customer 5 reports inventory levels greater than shortage/ demand levels.
The second probability scenario is presented in Table II. When comparing this scenario to Table I, lower demand levels are more probable, as well as, consequently, higher shortage average evels, whose maximum values remain the same regardless of average levels, so the amount of delivered product to customers from the central depot increases.

Finally, Table III shows the probability scenario. Again, both shortage levels for most customers and the amount of product delivered from the central depot increase.

One of the main goals of this model is to evaluate the impact of sharing risks (or the desire of sharing products coming from custromers’ own depots) with the central depot. To analyze the impact of this risk, an additional experiment was performed, whose results show that, given some demand levels, sharing risks decrease total system shortage (see Fig. 2). This leads us to think that integration is key in improving system performance.

Conclusions
In this paper, we presented a mathematical model for a supply network composed of a central depot and a set of customers with stochastic demands. The idea of collaboration among supply chain echelons consists of sharing resources to a central depot, which are then redistributed to other customers with stockout or demand peaks. This sharing strategy was implemented as a parameter of the model.
Experiments showed that, if the customers’ resource sharing willingness desire increased (understood as customer risk), the total system shortage could be reduced, which implies collaboration among all supply chain echelons. The proposed model can be used as a tool for planning resources in a distribution network with high demand variability so their resources can be managed by a central depot.
Future work could include multi-product management problems and larger supply chain networks. This model does not require the implementation of different algorithms to solve large scale instances.

