Services on Demand
Journal
Article
Indicators
-
 Cited by SciELO
 -
 Access statistics
Related links
-
 Cited by Google
 -
 Similars in
SciELO
 -
 Similars in Google
Share
CT&F - Ciencia, Tecnología y Futuro
Print version ISSN 0122-5383On-line version ISSN 2382-4581
C.T.F Cienc. Tecnol. Futuro vol.2 no.1 Bucaramanga Jan./Dec. 2000
ABSTRACT
One of the purposes of reservoir engineering is to quantify the volumetric sweep efficiency for optimizing reservoir management decisions. The estimation of this parameter has always been a difficult task. Until now, sweep efficiency correlations and calculations have been limited to mostly homogeneous 2-D cases. Calculating volumetric sweep efficiency in a 3-D heterogeneous reservoir becomes difficult due to inherent complexity of multiple layers and arbitrary well configurations- In this paper, a new method for computing volumetric sweep efficiency for any arbitrary heterogeneity and well configuration is presented. The proposed method is based on Datta-Gupta and King's formulation of streamline time-of-flight (1995). Given the fact that the time-of-flight reflects the fluid front propagation at various times, then the connectivity in the time-of-flight represents a direct measure of the volumetric sweep efficiency. The proposed approach has been applied to synthetic as well as field examples. Synthetic examples are used to validate the volumetric sweep efficiency calculations using the streamline time-of-flight connectivity criterion by comparison with analytic solutions and published correlations. The field example, which illustrates the feasibility of the approach for large-scale field applications, is from the North Robertson Unit, a low permeability carbonate reservoir in West Texas.
Keywords: volumetric sweep efficiency, streamline simulation, dynamic connectivity, time-of-flight.
RESUMEN
Uno de los propositos de la ingenieria de yacimientos es cuantificar la eficiencia volumétrica de barrido para optimizar las decisiones de manejo del yacimiento. Hasta ahora los calculos y correlaciones de la eficiencia de barrido se han limitado principalmente a casos homogeneos en dos dimensiones. El calculo de la eficiencia volumetrica de barrido en yacimientos heterogeneos es una tarea dificil debido a la complejidad asociada por la existencia de capas multiples y configuraciones arbitrarias de pozos. En este articulo, se presenta un metodo de calculo de la eficiencia volumetrica de barrido para cualquier tipo de heterogeneidad y configuracion de pozos. El metodo propuesto se basa en la formulacion de Datta-Gupta y King (1995) del tiempo-de-vuelo streamline (1995). Dado que el tiempo-de-vuelo refleja la propagacion del frente de los fluidos a cualquier tiempo, por lo tanto la conectividad del tiempo-de-vuelo representa una medida directa de la eficiencia volumetrica de barrido. La aplicacion propuesta ha sido aplicada tanto a casos sinteticos como a ejemplos de campo. Los ejemplos sinteticos son usados para validar los calculos de la eficiencia de barrido usando el criterio de conectividad de tiempo-de-vuelo streamline mediante comparacion con soluciones analiticas y correlaciones publicadas. El ejemplo de campo, que ilustra el potencial del metodo para una aplicacion de campo a gran escala, es la North Robertson Unit, un yacimiento de carbonatos de baja permeabilidad localizada al Occidente del estado de Texas en USA.
Palabras clave: eficiencia volumétrica de barrido, simplificar la simulación, conectividad dinámica, tiempo-de-vuelo.
INTRODUCTION
The increment of recovery from the large amount of remaining oil in the reservoirs requires better reservoir management practices. Therefore, implementation of robust reservoir management technologies has a profound effect on the recovery efficiency. The task can be summarized as maximizing the volumetric sweep efficiency early in the life of the project to squeeze as much oil as possible. From the reservoir engineering point of view is extremely important to have a method to calculate this parameter along to the expected project life. Unfortunately, the volumetric sweep efficiency estimation is not an easy task. Until now, sweep efficiency correlations and calculations have been limited to mostly homogeneous 2-D cases (Dyes, et al., 1954, Higgins and Leighton, 1962, Morel-Seytoux, 1965, Wang et al., 1999). Calculating volumetric sweep efficiency in a 3-D heterogeneous reservoir becomes difficult due to inherent complexity of multiple layers and arbitrary well configurations.
The proposed approach provides a method for computing volumetric sweep efficiency for a heterogeneous 3-D model for any arbitrary well configuration and operation conditions. The corner stone of the proposed method is the Datta-Gupta and King formulation of time-of-flight for streamline simulation (1995). Their formulation of time-of-flight allows the solution of the 3-D conservation equation in a set of one-dimensional solutions on the streamlines. The streamline method provides a simple and straight.forward approach for computing swept volumes for arbitrary heterogeneity and well configuration for incompressible fluid flow.
The organization of this paper is as follows. First, the underlying theory of the streamline simulation, time-of-flight, and volumetric sweep efficiency calculation is discussed. Second, the validation of the approach and a 3-D synthetic example is shown to illustrate the power of the proposed method. Finally, a field case from West Texas involving multiple patterns consisting of 27 producing wells and 15 injection wells is used to demonstrate the application of the approach.
APPROACH
A brief description of the streamline model based on Datta-Gupta and King (1995) and (Peddibhotla et al., 1996) is given below. The theoretical basis of the streamline time-of-flight is also discussed. In this section, it is shown how time-of-flight connectivity can be a measure of swept volume and how it can be applied to heterogeneous reservoir models with arbitrary well configuration.
Streamline Simulation and Time-of-Flight.
The streamline approach (Datta-Gupta and King, 1995, Peddibhotla et al., 1996) for modeling multidimensional, multiphase flow basically comprises of two steps: generating streamlines in 3-D space and then solving the 1D governing equations analytically or numerically along the streamlines. Streamlines can be generated from an underlying velocity (and consequently, pressure) field using the time-of-flight algorithm as outlined by Datta-Gupta and King (1995). Multiphase flow equations can then be solved in time-of-flight coordinates that greatly facilitate analytical as well as numerical calculations.
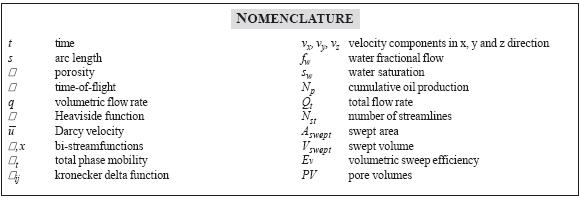
Time-of-flight is defined as the time at which a neutral tracer will appear at a specific location (x,y,z) (Datta-Gupta and King, 1995). It is mathematically defined by equation (1). Hence, each grid block in a reservoir model will have the time-of-flight value corresponding to its x, y, z locations.

The first step is to determine the streamline trajectories in space along which particles will travel. A block-centered finite-difference scheme is used to solve the governing equation for incompressible fluid flow in a non-deformable porous medium:

Where, t is the total phase mobility and q is the source (injector) or sink (producer). is a gradient operator, is a divergence operator, and d ij is a kronecker delta that determines the well block. Once pressure distributions are calculated, velocities at the grid block interfaces are computed using Darcy's law. By using the approximation that the x, y and z-velocity components vary linearly in the respective directions only within a grid block, particle trajectories can be derived based on the velocities at the block interfaces.
The particle time-of-flight t within a given gridblock can be computed by integration of the following equation:

Where vx , vy , and nz are velocity components in x, y and z direction. Considering that a particle must exit only through one of the block faces, it can be demonstrated that the actual time-of-flight is the minimum of all calculated times to different block faces (Datta-Gupta and King, 1995).
The particle total transit time-of-flight t to a producer is just the sum of block travel times determined by starting the particle trajectory at the producer and tracing the streamline backwards until reaching an injector.
Once the particle time-of-flight is computed, the next step is to calculate multiphase flow along streamlines. It has been demonstrated (Datta-Gupta and King, 1995) that by using the Buckley-Leverett theory for immiscible two-phase displacement, the relationship between particle transit time t and fractional flow of water ƒw (Sw) can be expressed as

Where, t is the time of interest. Finally, the cumulative oil production from individual streamlines will be given by:

Where, Q = Qt/Nst and Qt is the total flow rate and Nst is the number of streamlines used.
Swept Volume Calculation based on Time-of-Flight Connectivity.
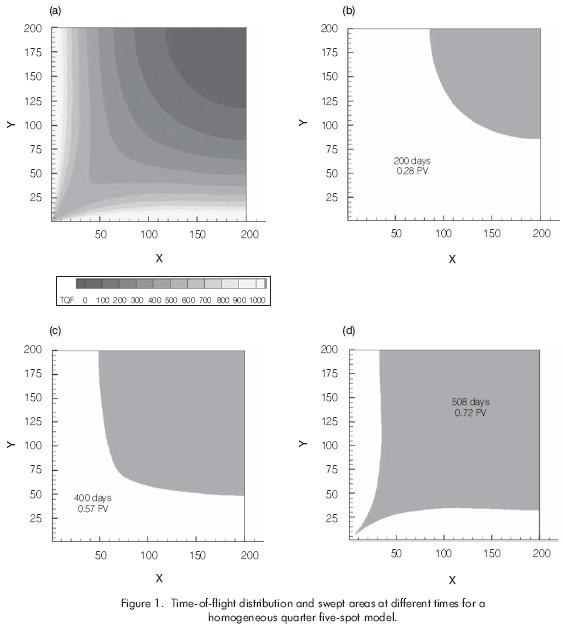
The streamline approach allows us to calculate the volumetric sweep from the distribution of travel times. For illustration purposes, Figure 1a shows the time-of-flight distribution for a homogenous quarter five.spot model. Figures 1b, 1c, and 1d display the time-of-flight contour at three different times for the same model. These time-of-flight contours are nothing but the fluid front at that particular time. Figure 1d shows the time-of-flight distribution corresponding to the tracer breakthrough time.
At any particular time, the swept area can be calculated as
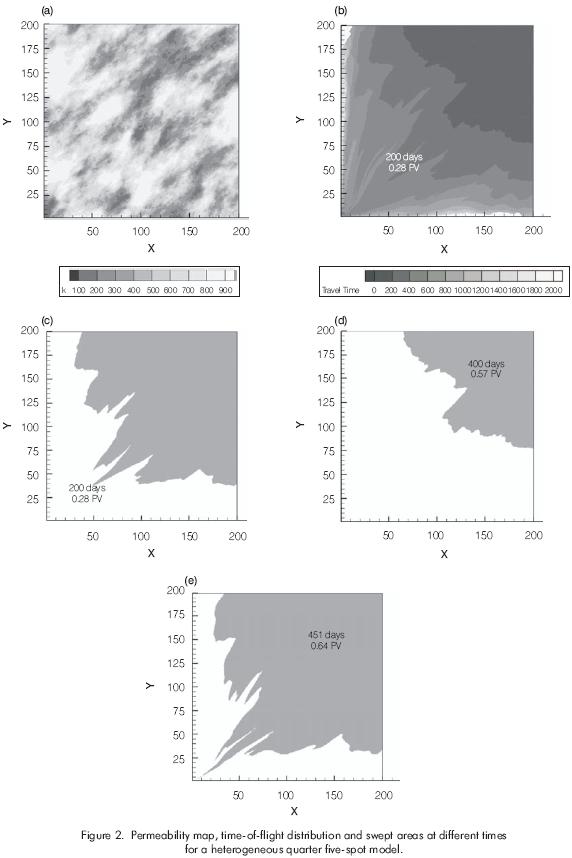
Where, is the Heaviside function and the integral represents the times of flight that are less than the time of interest as shown in Figures 1b,c,d. The concept for any arbitrary heterogeneous medium can be easily generalized, as shown in Figure 2.
After Bear (1973), the velocity field for a general three-dimensional medium can be expressed in terms of bi. stream functions and x as follows

A streamline is defined by the intersection of a constant value for with a constant value for x. In two-dimensional applications, the simplified functional forms, = (x,y), x = z are used. This leads to the more familiar expressions:

Where, is recognized to be the streamfunction.
For the two dimensional example, changing from (x, y) to ( , ) coordinates Equation (6) reduces to
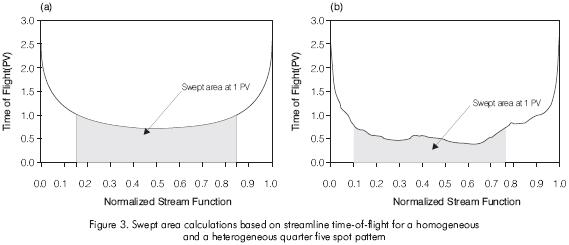
Equation (8) indicates that the swept area at any given time can be computed by simply integrating the time-of-flight at the producer against normalized stream-function. In Figure 3, these integrals for the homogeneous and heterogeneous quarter five-spot examples are illustrated.
In three-dimensional flow, analogous expressions for swept volumes can be derived (Idrobo 1999, Idrobo et al., 2000):
Rather than evaluating such complex integrals in 3-D, the swept volume can be obtained simply by examining the connectivity in the streamline time-of-flight as discussed below. From these plots it is evident that the time-of-flight isochrones fully represent the fluid front.
Equations (8) and (9) can be interpreted simply as connected volumes for a given time-of-flight. In fact, Equation (9) can be approximated as:

Where, is the Heaviside function and q( i) is the volumetric flow rate assigned to the streamline i.
Considering 3-D Cartesian arrays of face connected cells, an indicator variable can be defined at each cell based on some minimum criteria for connectivity (Idrobo 1999, Idrobo et al., 2000). For calculation purposes, a cell is coded as unswept if the time-of flight at the analyzed cell is greater than the time of interest and as swept if it is less than or equal to the time of interest. Thus the accuracy of the swept volume calculations will deteriorate if the cell size becomes too large. Scanning through the 3-D array and adding the net cells hydrocarbon pore volume will give us the swept volume at that time of interest, which after dividing by the total hydrocarbon pore volume gives the volumetric sweep efficiency.
VALIDATION OF THE APPROACH
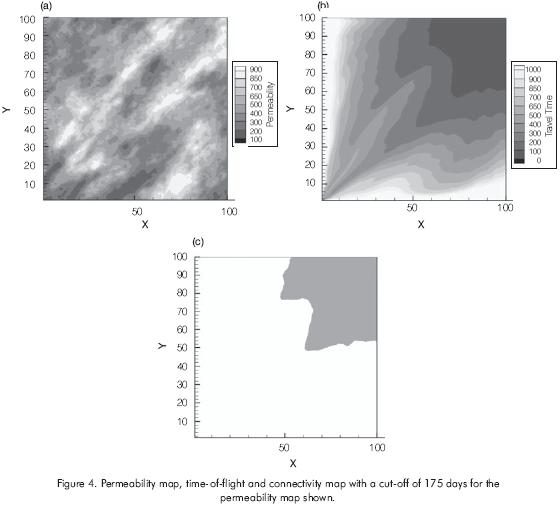
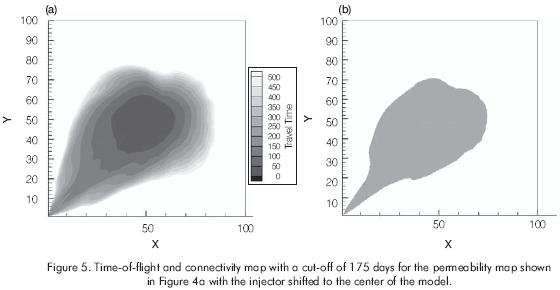
Figure 4 shows an arbitrary permeability map, its corresponding time-of-flight distribution, and the connectivity map for a cut-off of 175 days. To show the effect of change in well configuration, for the same permeability field shown in Figure 4, the injection well was shifted from the upper right corner to the center. Figure 5 shows the corresponding time-of-flight and the connectivity map for the same cut-off of 175 days. It can be seen that for the same permeability field, the connectivity in the time-of-flight has changed with the change in well pattern. Hence, it can be stated that the connectivity in time-of flight takes into account the changes in well pattern geometry.
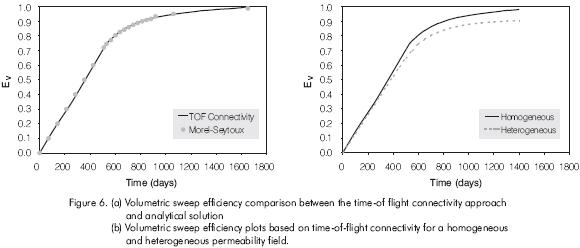
To validate the proposed approach, the results were compared with the analytical solution of Morel-Seytoux (1965) for a homogeneous quarter five-spot pattern. Figure 6a shows the comparison of the results from the proposed approach and that from the analytical solution of Morel-Seytoux (1965). The results are in excellent agreement, which proves the accuracy of volumetric sweep calculations based on the time-of-flight connectivity. Figure 6b shows a comparison of volumetric sweep efficiency for the homogeneous case and a heterogeneous realization, shown in Figure 2.
Synthetic Example
In this section, a three dimensional synthetic example of volumetric sweep efficiency calculations based on time-of-flight connectivity is discussed. The purpose is to validate the proposed approach for a 3-D heterogeneous reservoir model. This example consists of generating 50 realizations using sequential Gaussian simulation of a fine-scale reservoir model (50 ·25 ·12). The well configuration is a repeated nine-spot pattern with two central injectors and thirteen producers. In Figure 7, a XY view of the synthetic example illustrating the well configuration is displayed. From a ranking process based on recovery evaluated at breakthrough (Idrobo et al., 2000), the most probable permeability realization is shown in Figure 8a. Figure 8b shows the time-of-flight distribution for this realization and Figure 9 displays the time-of-flight connectivity or swept volume at 500 and 1,500 days.
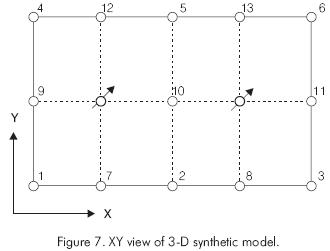
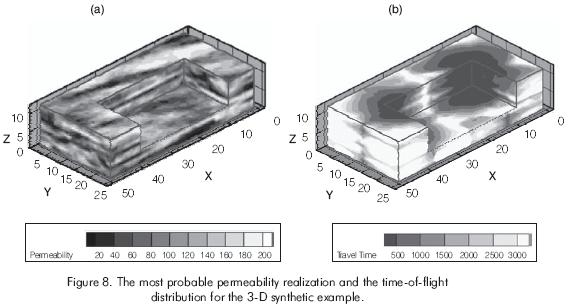
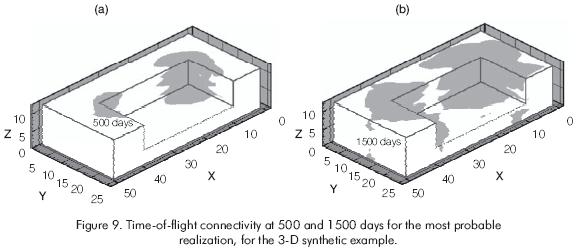
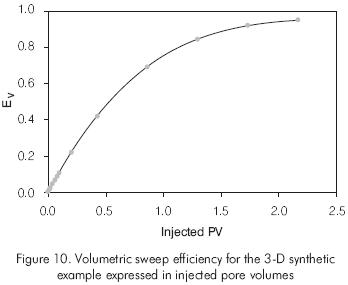
Figure 10, displays the volumetric sweep efficiency curve based on time-of-flight connectivity in terms of injected pore volumes.
FIELD CASE: NORTH ROBERTSON UNIT, WEST TEXAS
North Robertson (Clearfork) Unit (NRU) is a heterogeneous, low permeability carbonate reservoir located in the Permian Basin of West Texas. The oil is produced from the Glorieta and Clearfork Formations in the depth between approximately 1,789 - 2,268 m (5,870-7,440 feet). 41.3-44.5 MMm3 (260-280 MMSTB) of original oil in place in a total area of 22.8 MMm2 (5,633 acres) have been estimated. This area has 144 active producing wells, 109 injection wells, and 6 water supply wells. NRU has been divided into 12 hydraulic flow units, according to Davies et al., (1996), for reservoir characterization purposes.
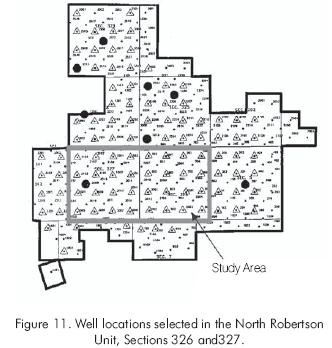
The field was on primary production stage from 1954 to 1987 at 161.8-Mm2 (40-acre) well spacing. Water-flood infill drilling program initiated in 1987 finally brought the well spacing down to 80.9 Mm2 (20 acres). Current unit oil, gas, and water production rates are approximately 0.006 m3/s (3,200 STB/D), 0.572 m3/s (1,400 MCF/D), and 0.020 m3/s (11,000 BW/D), respectively. The average unit injection rate is about 0.039 m3/s (20,000 BW/D). The reservoirs in NRU are typically characterized by high degree of vertical and lateral heterogeneity with low porosity (7.5% limestone matrix), low permeability (0.1-10 md), poor waterflood sweep efficiency, and low oil recovery factor. Sections 326 and 327 were selected as the study area. See Figure 11.
Reservoir Model
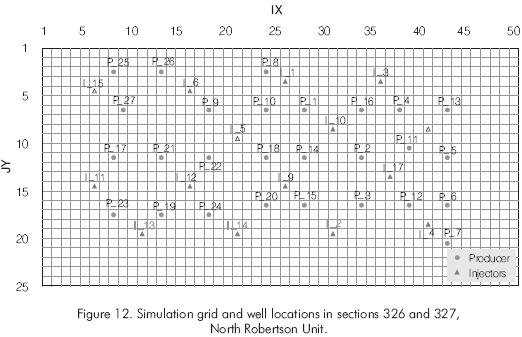
A total of 42 wells including 27 producing wells and 15 injection wells are used in the model. Figure 12 shows the areal view of the model grid dimensions of 50 · 25 with a cell size of 80 m (262.5 ft) by 80 m (262.5 ft). For simulation purposes twelve hydraulic units are defined. Since the detailed reservoir model is not available, the data at 30 well locations are used as conditional data to generate the initial porosity and permeability models to be used in the study. Mixed front conditions were used.
Results
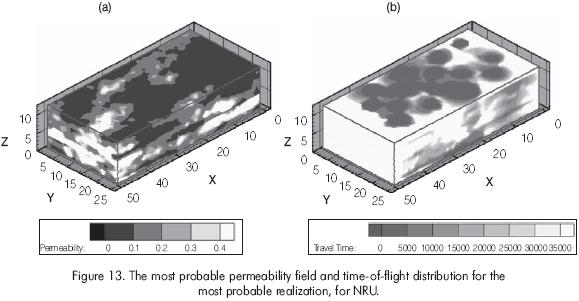
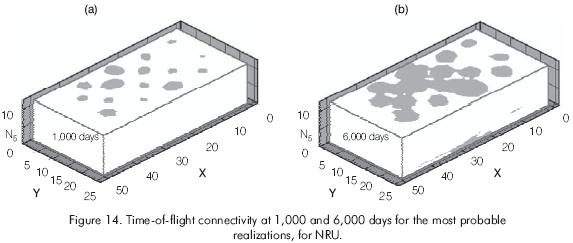
Figure 13a shows the most probable permeability field out of 50 realizations generated by using sequential Gaussian simulation. In Figure 13b, the time-of-flight distribution for this realization is displayed and Figure 14 shows the time-of-flight connectivity or swept volume at 1,000 and 6,000 days.
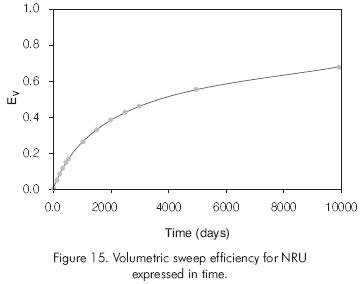
The volumetric sweep efficiency curve based on time-of-flight connectivity is shown in Figure 15. In this figure, the volumetric sweep efficiency is expressed in terms of time in days.
CONCLUSIONS
-
Streamline "time-of-flight" connectivity has been proved to be a measure of volumetric sweep efficiency for a particular time of interest.
-
The method proposed for computing volumetric sweep efficiency works for any arbitrary heterogeneity and well configuration.
-
The accuracy of proposed approach was tested with a theoretically predicted solution finding excellent agreement.
-
A synthetic example was used to validate the proposed approach for a 3-D heterogeneous reservoir model. Field data from the North Robertson Unit, West Texas, was used to illustrate the power and versatility of the approach.
-
The proposed time-of-flight connectivity criterion exhibits strong correlation with waterflood recovery, therefore can be used for ranking stochastic reservoir models.
-
It was found that the accuracy of the swept volume calculations will deteriorate if the cell size becomes too large.
REFERENCES
Bear, J., 1973. "Dynamics of Fluid in Porous Media", Dover Publications, New York. [ Links ]
Datta-Gupta, A., King, M. J., 1995. "A Semianalytic Approach to Tracer Flow Modeling in Heterogeneous Permeable Media", Advances in Water Resources, Vol. 18: 9 - 45. [ Links ]
Davies, D. K., Vessel, R. K., 1996. "Flow Units Characterization of a Shallow Shelf Carbonate Reservoir: North Robertson Unit, West Texas", SPE/DOE 35433 presented at the 1996 Tenth SPE/DOE Symposium on Improved Oil Recovery, Tulsa, Oklahoma (April.): 36 - 45. [ Links ]
Dyes, A. B., Caudle, B. H. and Erickson, R. A., 1954. "Oil Production after Breakthrough - As Influenced by Mobility Ratio", Trans. AIME, Vol. 201: 27 - 49. [ Links ]
Higgins, R. V., Leighton, A. J., 1962. "Computer Prediction of Water Drive of Oil and Gas Mixtures Through Irregularly Bounded Porous Media - Three Phase Flow", Jour. Pet. Tech. (Sep.): 1048 - 1060. [ Links ]
Idrobo, E. A., 1999. "Characterization and Ranking of Reservoir Models Using Geostatistics and Streamline Simulation", Ph.D. Dissertation, Texas A&M University. [ Links ]
Idrobo, E. A., Choudhary, M.K. and Datta-Gupta, A., 2000. "Swept Volume Calculations and Ranking of Reservoir Models Using Streamline Simulation", SPE 62557 presented at the SPE/AAPG Western Regional meeting held in Long Beach, California (June): 812 - 823. [ Links ]
Morel-Seytoux H. J., 1965. "Analytical-Numerical Method in Waterflooding Predictions", SPEJ (Sep.): 247 - 258. [ Links ]
Peddibhotla, S., Cubillos, H., Datta-Gupta. A. and Wu, C. H., 1996. "Rapid Simulation of Multiphase Flow Through Fine-Scale Geostatistical Realizations using a New 3-D Streamline Model: A Field Example", SPE 36008 presented at the SPE Petroleum Conference, Dallas, Texas (June): 514 - 525. [ Links ]
Wang, Y., Kovscek, A. R. and Brigham, W. E., 1999. "Effect of Mobility Ratio on Pattern Behavior of a Homogeneous Porous Medium", Stanford University. [ Links ]


