1. INTRODUCTION
The seismic migrated images in reverse time migration (RTM) have been conventionally obtained by the zero lag cross-correlation [1,2] by examining the double summation of products with seismic amplitudes between source and receiver wavefields. One of them, summed in time domain and the other one, summed in the shot domain (zero-lag cross-correlation imaging condition). This imaging condition is kinematically accurate at the reflectors as incidental and reflected wavefields coincide in space and time [3], but migrated amplitudes no longer have physical significance. It produces kinematically correct images of the subsurface structure geometry [4].
Several implementations of RTM using the cross-correlation imaging condition have been reported [5], [6], [7], [8], however, this imaging condition often produces a significant number of strong amplitudes and low-frequency noise that contaminates the model. This low-frequency noise (artifacts) results from singularities in the velocity field (strong velocity contrasts) and unwanted cross-correlation of source and receiver wavefields in non-reflective points along the ray-paths.
In the presence of singularities in the velocity field, strong amplitude changes occur and the appearance of artifacts is greater than in smooth velocity changes [9]. Correlation of diving, head, and backscattered waves appears as low-frequency noise (artifacts), which can hide relevant details in the model.
These low-frequency artifacts are not present in one-way equation-based migration models built with the same cross-correlation imaging condition. Several works have been developed around to attenuate these low-frequency artifacts, preserving reflections, and improving model quality, implementing other strategies such as modifications of the wave equation [9], [10], proposing other imaging conditions [3], [11]- [15], and using image filtering techniques [6], [8].
Wavefield decomposition is a strategy to avoid low-frequency noise in RTM. This method is based on the decomposition of source and receiver wavefields in their one-way components along a certain specific direction to correlate the appropriate combinations of some of these decomposed wavefields. The propagated components of source and receiver wavefields in opposite directions produce a migrated image of subsurface structures when these are correlated. However, the correlation between the propagated source and receiver wavefields in parallel directions does not generate a migrated image because one of them is zero. Fei & Luo [16] proposed the RTM deblending technique that separates upgoing and downgoing source and receiver wavefields and used them to construct the final RTM migrated image. The deblending RTM provides high fidelity migrated models for complex salt structures without artifacts, while preserving steeply dipping reflectors and overturned structures.
Liu et al. [3] developed an imaging condition using wavefield decomposition in their unidirectional components along some specific direction and applying it to the combinations of opposite direction to the decomposed wavefields. Upgoing and downgoing wavefields are decomposed and calculated using the spatial 2D Fourier transform [17].
Ren, Song, & Tian [18] proposed a new imaging condition following the steps developed by Liu et al. [3] and Yoon & Marfurt [19]. They combined the Pointing vector imaging condition and the wavefield decomposition imaging condition. This imaging condition can effectively remove artifacts by muting these correlations based on the directions of incident and reflected wave propagation.
Wang & Liu [20] used the one-step low-rank extrapolation method and the wavefield decomposition imaging condition [3], [21]. The one-step extrapolation method allows for the use of a very large time step. In addition, due to the fact that the wavefield is analytical, wavefield decomposition can be performed at each time level, avoiding Fourier transformation in frequency domain. The final migration result was nearly noise-free and the salt structure was well imaged.
In this paper we propose a new way to extract directional data from source and receiver wavefields based on the analysis of time-scale or time-frequency characteristics. The aim of this method, which is based on the continuous wavelet transform, is reducing low-frequency noise in images obtained through RTM and the zero-lag cross-correlation imaging condition. The migrated image is improved by reducing low-frequency artifacts and it leads to a better approach for enhancement of subsurface structures vis-à-vis other methods.
First, we describe the foundations of the continuous wavelet transform and the wavefield decomposition. Then, we describe the methodology of the proposed method. Next, the method is applied to different synthetic datasets to show results by removing low-frequency spatial artifacts. Finally, results are post-processed using a method proposed by Paniagua, Sierra-Sosa, & Quintero [22] to improve final migrated images.
2. THEORETICAL FRAME
CONTINUOUS WAVELET TRANSFORM (CWT)
A wavelet is a function ψ/EL2 ( ) with finite energy [23], that is,
It is normalized ||ψ||=1 and satisfies the condition that is rapidly decreasing
With zero average and centered near t=0
ψ̂(ω) is the Fourier transform of ψ(t) given by
and Cψ is called the admissibility condition.
A family of wavelets is obtained by scaling ψ by s and translating it by u and is defined by equation
where s is called a scaling parameter that measures the degree of compression or scale, u is a translation parameter that determines the time location of the wavelet, and ψ is called mother wavelet. If ψ∈ L
2 ( ), then ψ
s,u (t)∈ L2 (
 ) for all s, u and ||ψ
s,u|| =1.
The integral transformation W of a function f∈L
2 ( ) at time u and scale s is
and it is called a continuous wavelet transform of f(t), where ψ * (t-u/s) is the complex conjugated of ψ(t-u/s).
The continuous wavelet transform can be expressed as a convolution product.
where
In this work, a Gaussian wavelet is used and it is given by
The use of the Gaussian family allows to maximize the information retrieval due to their properties as heat equation solution.
WAVEFIELD DECOMPOSITION
The zero-lag cross-correlation imaging condition for one shot is given by [2]
where S(x,z) and R(x,t) are source and receiver wavefields, respectively, x=(x,z) is the location in the Cartesian coordinate system, t max is the total time, and l α is the migrated RTM image for one shot.
Based on the mathematical foundations given by Liu et al. [3] and Fei et al. [16], source and receiver wavefields can be decomposed into the appropriate components to be correlated. Thus, source and receiver wavefields can be expressed as follows:
where S u (x,z), S d (x,z) are called downgoing and upgoing source wavefields, and R u(x,z), R d(x,z) are called downgoing and upgoing receiver wavefields, respectively.
From Equation 10 and replacing Equation 11 and 12 we obtain
Then,
Cross-correlation of the two wavefields l dd(x,z) and l uu(x,z) that propagate in the same direction downgoing (l dd) or upgoing (l uu) generate low frequency artifacts in the RTM scalar field [3].
Then, the wavefield decomposition cross-correlation imaging condition can be formulated by keeping only the first two terms as follows:
Taking into account Equation 15, we have
which is the cross-correlation of downgoing source and upgoing receiver wavefields, that is, exactly what one will get in one-way wave-equation migration. In this work, Equation 16 is used to obtain the migrated image.
3. EXPERIMENTAL DEVELOPMENT
From the source and the receiver wavefield, (x,z,t) , R(x,z,t), we take a fixed value in x-axis, and select the respective wavefields, that is, we use the subsets S(x,z,t) and R(x xi ,z,t), which will be expressed as S xi(z,t) and R xi(z,t). For each value in x-axis, we found a similar structure in subsets of the source wavefield, S xi(z,t), and in subsets of the receiver wavefield, R xi(z,t). Therefore, a time-scale analysis was performed of the wavefields S xi(z,t) and R x {z,t) by applying the 1D CWT, having found some common characteristics of the coefficients obtained by CWT and the wavefield components.
Now, the scheme used for the time-scale analysis of each wavefield is described as follows.
ANALYSIS OF THE SOURCE WAVEFIELD
The methodology used to perform the time-scale analysis of the source wavefield S(x,z,t) is the following:
From the source wavefield S(x,z,t), select for each x=x i the wavefield S xi (z,t)=S(x i,z,t).
Then, select a fixed value of z=z i and obtain the wavefielc S xi,zi (t)=S(x i ,z i, t).
For each wavefield S xi,zi (t) the ID CWT is applied, that is Ŝ xi,zi(u,s)=W(S xi,zi (t)) and the scalogram of the signal is obtained.
The minimum value of all coefficients for all scales in Ŝ xi,zi(u,s) is selected, located in S xi,zi(t), and saved in a new wavefield S d(x,z,t) that represents the information of the downgoing component of the source wavefield. For improving accuracy, two more points are taken before and after this point.
This process is carried out for all values of x=x ¡ and z=z ¡ .
ANALYSIS OF THE RECEIVER WAVEFIELD
The methodology used to perform the time-scale analysis of the receiver wavefield R(x,z,t) is the following:
From the receiver wavefield R(x,z,t), select for each x=x i the wavefield R xi(z,t)=R(x i ,z,t).
Then, select a fixed value of t=t i and obtain the wavefield R xi,ti (z)=R(x i,z,t i).
For each wavefield R xi,ti (z) the ID CWT is applied, that is
 xixi (u,s)=W (R
xi,ti (z)) and the scalogram of the signal is obtained.
xixi (u,s)=W (R
xi,ti (z)) and the scalogram of the signal is obtained.The maximum absolute value of coefficients that correspond to a coefficient with negative value for all scales in
 ̂xi,ti (u,s) is selected, located in R
xi,ti (z), and saved in a new wavefield R
u (x,z,t) represents the information of the upgoing component of the receiver wavefield. Two more points are taken before and after this point to improve accuracy.
This process is followed for all values of x=x ¡ and t=t ¡ .
With the obtained wavefield S d(x,z,t) and R u(x,z,t), the migrated image s obtained by using Equation 16.
RESULTS
To illustrate how we extract relevant data of source and receiver wavefields, via continuous wavelet transform, we apply the RTM algorithm using a two-layer velocity field depicted in Figure 1. We use only one source point located at x = 1.5 km (middle of the model) and depth z=0 (surface). There are 400 receivers equally distributed along the surface and the receiver interval is 7.5 m.
Source and receiver wavefields are obtained using a reverse time migration (RTM) algorithm, with a second and eighth order finite difference scheme in time and space, respectively.
Figure 2 shows i some snapshots of the source and receiver wavefields, S(x,z,t) and R(x,z,t), respectively, at t = 0.2 s and t= 0.36 s. It should be noted that some parts of the wavefields are correlated spatially at the same time.
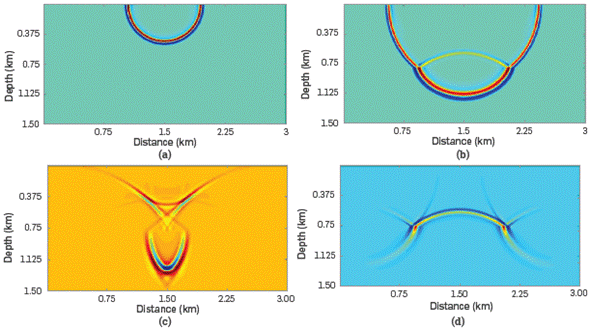
Figure 2 Snapshots of the source wavefield (a) at t= 0.2 s and (b) at t= 0.36 s, and the receiver wavefield (c) at t= 0.2 s.
With the extrapolated source and receiver wavefields, the migrated image, shown in Figure 3, is obtained using the conventional zero-lac cross-correlation imaging condition given by Equation 10.
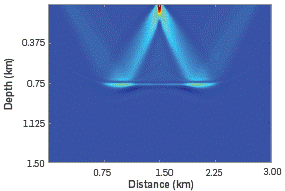
Figure 3 Migrated image obtained by RTM and the zero-lag cross-correlation imaging condition. Notice the low-frequency artifacts generated using this imaging condition.
Note that the model is contaminated with Low-frequency artifacts that are stronger above and near the reflective event, as well as in the shallow parts. A strong energy, a wide frequency band, a Low apparent frequency, and a specific distribution along the propagation oath of the seismic wave are observed.
The source and the receiver wavefields are processed by applying the methodology proposed above. Figure 4 shows source and receiver wavefields at t= 0.36 s and source and receiver wavefields with the extracted information using the time-scale analysis. Figure 4b shows the downgoing component of the source wavefield. Note that the reflected wave is not present (upgoing component of source wavefield). Figure 4d shows the upgoing component of the receiver wavefield. Note that some parts of the wavefield are not present (downgoing component of receiver wavefield).
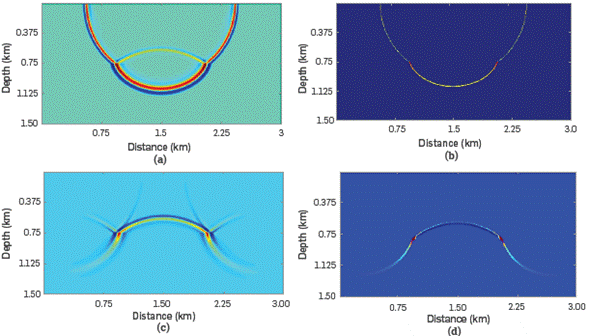
Figure 4 Snapshots of the wavefields at t= 0.36 s: (a) The complete source wavefield, (b) the downgoing component of the source wavefield, (c) the complete receiver wavefield, and (d) the upgoing component of the receiver wavefield.
The obtained source and receiver wavefields, that is, the downgoing component of the source wavefield and the upgoing component of the receiver wavefield are correlated using the proposed imaging condition given by Equation 16. The obtained seismic migration field s shown in Figure 5b.

Figure 5 Migrated model obtained by: (a) RTM and conventional zero-lag cross-correlation imaging condition, (b) the proposed method. It may be observed that artifacts present in the model in Figure 5b are removed and the seismic model is improved.
The proposed method was applied to others synthetic datasets, When applied to more complex models, the downgoing component of the source wavefield can be extracted adequately. The extraction of data related to the upgoing component of the receiver wavefield was not achieved completely, and it is being studied and features obtained by CWT are being analyzed.
However, we use only the data extracted from the source wavefield, that is, the downgoing component of the source wavefield, and it s correlated with the complete receiver wavefield. The seismic migrated field is improved in comparison with the conventional seismic migrated field obtained with the conventional zero-Lac cross-correlation imaging condition.
This methodology is applied on a three-Layer synthetic dataset, with Horizontal distance of 3.0 km and vertical distance of 1.5 km. We used 3 source points. The first source is Located at x=0.75 km and the Last one at x=2.25 km from the beginning of the model; source interval is 750 m; each source point contains 400 receivers and receiver interval is 7.5 m.
The velocity field and the migrated image obtained by RTM with the conventional zero-lag cross-correlation are shown in Figure 6, Mote that the migrated model is contaminated with artifacts being stronger in shallow parts and reflective events.
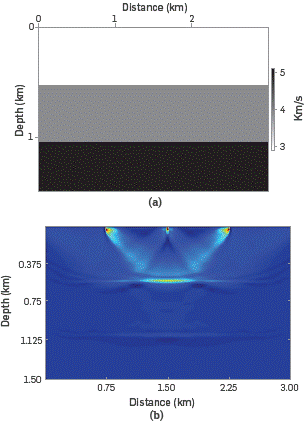
Figure 6 (a) Three-layer velocity field, (b) Migrated image with conventional zero-lag cross-correlation imaging condition.
Figure 7a shows a snapshot of the source wavefield that corresponds to the source located at x=1.50 km and t=0.984 s. The downgoing component of the source wavefield obtained by the proposed method s depicted in Figure 7b. We can see that the reflections are removed from the complete source wavefield.
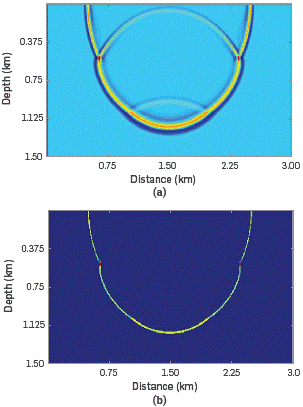
Figure 7 Snapshots of the source wavefield of the three-layer model at t= 0.384 s: (a) The complete source wavefield, and (b) the downgoing extracted information of the source wavefield.
The down going component of the source wavefield and the complete receiver wavefield are correlated by using Equation 16. The result is shown in Figure 8b.

Figure 8 Comparison of migration results of the three-layer model using a) the conventional cross-correlation imaging condition, and b) the proposed method using only the downgoing extracted information of the source wavefield.
Low-frequency artifacts are reduced in different parts of the migrated model and the image is improved.
The proposed scheme is also applied to the small salt velocity field shown in Figure 10a. This dataset has a horizontal distance of 1.27 km and a vertical distance of 0.79 km. We used 3 source points. The first source is located at x=0.32 km and the last one at x=0.95 km from the beginning of the model; source interval is 315 m; each source point contains 400 receivers and receiver interval is 3.75 m
Figure 9 shows the velocity field and the migrated model using the conventional zero-lag cross-correlation.
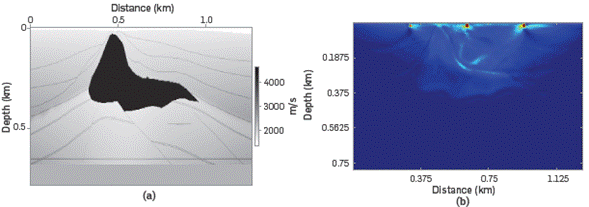
Figure 9 (a) Small salt velocity field, and (b) migrated image with the conventional zero-lag cross-correlation imaging condition.
Figure 10 shows a snapshot of the source wavefield and the downgoing component of the source wavefield obtained by the proposed method.

Figure 10 Snapshots of the source wavefield of the small salt model at t= 0.15 s: (a) The complete source wavefield, and (b) the downgoing component of the source wavefield.
Figure 11 shows a comparison between seismic images obtained by using the conventional cross-correlation imaging condition (Figure 11a), and the proposed method correlating the downgoing component of the source wavefield S d(x,z,t) and the complete receiver wavefield R(x,z,t) (Figure 11b).

Figure 11 Comparison of migration results of the small salt model using a) the conventional cross-correlation imaging condition, and b) the proposed method using only the downgoing component of the source wavefield.
It is evident that artifacts are removed in some regions and the seismic model is improved. Low-frequency noise was reduced in shallow zones and close to the salt body.
Although the results obtained are promising, we apply the postprocessing technique proposed by Paniagua, Sierra-Sosa, & Quintero [22], Paniagua & Quintero [24] and Paniagua & Sierra-Sosa [25] on seismic migrated models obtained by the proposed method which were shown in Figure 8b and Figure 10b).
Both models are post-processed by applying Laguerre-Gauss filtering. Results are shown in Figure 12. Figure 12a corresponds to the RTM model obtained by the modified cross-correlation imaging condition plus Laguerre-Gauss filtering of the three-layer synthetic dataset, and Figure 12b corresponds to the RTM image obtained by the same procedure of the small salt synthetic dataset.

Figure 12 Post-processed images by using Laguerre-Gauss filtering after the proposed method: (a) Three-layer model, and (b) small salt model.
Note that low-frequency artifacts are reduced in the shallow parts of both models and near reflective events and flanks of the salt body. Further, structures are more defined and enhanced, and the seismic image is improved. This technique allows to preserve reflective events, enhance any small change in the seismic image, and preserve the true location of reflections.
CONCLUSIONS
We proposed the use of the continuous wavelet transform to extract relevant directional data on source and receiver wavefields to separate their components. The aim of this separation is to avoid low-frequency artifacts obtained by reverse time migration with the conventional zero-lag cross-correlation imaging condition. We proved that the method works well and reduces artifacts significantly in the resulting seismic images.
A modification of the zero-lag cross-correlation imaging condition was used. Such modified imaging condition is the same used in one-way wave equation methods.
The proposed method was applied in simple and complex velocity fields and the results were promising. We achieved the improvement of the scalar field by using only the minimum coefficient source wavefield, and the complete receiver wavefield, considerably reducing low-frequency artifacts induced by undesired correlation of some components of source and receiver wavefields. The information about the downgoing component of the source wavefield and the upgoing component of the receiver wavefield were extracted adequately. In future works, the full extraction of data from this component of the receiver and source wavefield will be studied and the characteristics obtained through the continuous wavelet transform will be analyzed. In addition, we will explore the use of the curvelet transform to achieve a full directional decomposition of wavefields.
This paper takes up the work conducted by Mallat [23] and Daubechies [26] in terms of considering the signal in the continuous world, taking advantage of the fact that the algorithm can be implemented and computed, providing detailed and relevant information of the signals.
In addition, we used a post-processing technique, called Laguerre-Gauss filtering to improve results. The reduction of low-frequency artifacts was significant and subsurface structures were better defined and enhanced.


