


 English (pdf)
 Article in xml format
 Article references
 Send this article by e-mail
 Cited by SciELO
  Cited by Google
  Similars in
SciELO
Similars in
SciELO  Similars in Google
 Permalink
1. INTRODUCTION
Increased awareness about oil adsorption processes onto mineral surfaces can effectively help us understand oil production profiles and improve our understanding of complex waterflooding processes intended to increase oil recovery beyond standard waterflooding processes [1]-[3]. Strong evidence shows that mineralogy sets the chemical pathways for crude oil adsorption-desorption processes and reservoir wettability [2],[4]-[6]. Therefore, to evaluate reservoir wettability appropriately, it is imperative to differentiate reservoir systems from a chemical standpoint into two main categories, that is, sandstones and carbonates.
Crude oil, brine, and rock interaction (COBR) influences several parameters and processes associated with the wetting phenomena during waterflooding, such as interfacial tension (IFT), reversible crude oil adsorption-desorption processes, or non-reversible asphaltenes precipitation [7]. Thus, COBR interactions have a significant say in the adsorption processes and on how the initial wettability occurs in the reservoir [8]-[11]. To master the science behind these interrelations, it is essential to explain how the wettability is established initially.
For analytical and chemical purposes, a useful grouping of crude oil components is used by the SARA analyses [12],[13]. This experimental routine of analyses involves four main categories: hydrocarbons, saturates, aromatics, resins and asphaltenes. SARA analyses became quite popular as it divides the groups based on their polarity. Saturates are non-polar, and aromatics have aromatic rings that make them slightly polarizable. On the other hand, resins and asphaltenes contain NSO (Nitrogen, Sulphur, and Oxygen) compounds, which are polar and are also known as polar organic components (POC). The difference between resins and asphaltenes is their solubility in heptane or pentane. Asphaltenes are not soluble in them, while resins are [13].
When crude oil POC comes into play with mineral surfaces in a reservoir, fractions of acidic or basic POC can undergo reversible or non-reversible adsorption [6],[7], [14],[15]. How strongly crude oil adheres on mineral surfaces is highly influenced by the chemical ionic composition of the brine present in the reservoir system and reservoir lithology. Once the first crude oil invades a reservoir, the initial reservoir wettability is established [16]. However, the formation is still susceptible to further geochemical changes if abrupt conditions are activated during geological reservoir maturation. Furthermore, wettability reversal can take place during crude oil production by waterflooding [1],[2],[14],[17]-[19].
Wettability controls significant fluid flow attributes in porous media, such as fluid distribution, capillary pressure (Pc), magnitude of capillary forces in specific pore throats, and relative permeabilities of oil, kro , and water, krw. By influencing all these parameters, wettability sets boundaries for crude oil recovery and impacts the economics of oil recovery [20].
As mentioned above, the polar organic materials present in crude oil can be acidic or basic, and these are quantified by the acid and base numbers, AN and BN, respectively. These components are measured by potentiometric titrations, and their concentration is expressed in units of mgKOH/g [10],[21]. The most representative and active components present in the acidic crude oil fraction are carboxylic acids, with basic components being dominated by nitrogen-based components, R3N:, they are present in crude oil in the form of heterocyclic and aromatic compounds; both acidic and basic POC are found mostly in the resins or asphaltenes fractions [13],[14].
POCs are highly polar, and they can directly influence the IFT between crude oil and water. They have the ability of being present at the oil-water interface and participate in acid-base reactions. Acid-base reactions involve uptake and release of protons, H+, as described in Eq. (1) and (2) [1]:
Basic material

Acidic material

The literature has shown that POC can effectively adsorb onto minerals, thereby altering their surface wettability [8,18,19,22-30]. Solid evidence has shown that the AN is a major wetting parameter in carbonates [9],[31],[32] and that BN appears to have a higher impact on sandstone surfaces [33].
The quartz point of zero charge is located at ~pH 2; therefore, sandstone minerals are regarded as negatively charged surfaces at pH values above 2. Under such circumstances, positive charged nitrogenous bases are highly likely to adsorb onto sandstones [8]. Calcium carbonate surfaces have a higher point of zero charge ~pH 9.5, and due to reservoir conditions and buffer effects, they are regarded as positively charged surfaces, with increasing adsorption probability for negatively charged carboxylates [34],[35].
CARBONATES WETTABILITY
Carbonate material used in this work comes from the Stevns Klint quarry in Denmark. It is considered a very pure calcium carbonate with low amounts of silica impurities; SK chalk is also considered a suitable analog for north sea chalk reservoirs [36]. To capture the effect of POC and AN in carbonates, several spontaneous imbibition (SI) experiments were carried out in pure chalk cores. These cores were equally restored with real crude oils, Figure 1.

Figure 1 Effect of AN on-chalk wettability. SI test at 90°C on restored chalk cores, with increasing AN values and FW as imbibing fluid, re-drawn after Standnes and Austad (2000a) [16].
A similar test using model crude oils is shown in Figure 2. The crude oils used had different AN values. The imbibing brine for all tests was synthetic formation water (FW), and the results showed a lower water-wetness degree as the AN increased [16,37].

Figure 2 Effect of AN on chalk wettability. SI tests at 90°C on chalk cores imbibed with FW. Cores restored with FW as initial water saturation, Swi=10%, and model crude oils with increasing AN values [16].
From Figures 1-2, a significant drop in the water-wetness degree was observed as the AN increased. It is noteworthy that there was no correlation with the crude oil asphaltene content, Figure 1[30]. Other researchers have highlighted the influence of acidic polar components in relation with carbonates wettability [27]-[29], [32],[38]. It has been generally agreed that in carbonate reservoirs, negatively charged carboxylates have a higher affinity towards positively charged calcium carbonate surfaces as compared with non-charged basic polar components, Equations 1-2.
It was also reported that adsorption was a rather fast process in carbonates [28], which is apparently dominated by acidic components over basic components [27],[39]. The amount of crude oil injected had a significant effect on wettability, with greater crude oil exposure being correlated to lower water-wetness [38].
SANDSTONES WETTABILITY
As previously mentioned, sandstones and most silicates surfaces are negatively charged. In sandstone reservoirs, characteristic pH values are slightly acidic, with predominant values below 7.0, contrary to the values observed in carbonates, which are more likely to be found in the alkaline region. Deviations from these main trends can be usually explained by mixed mineralogies. It is also confirmed that polar organic components can be adsorbed on sandstones. The highest affinity for the acidic material is linked to the non-dissociated carboxylates, R-COOH, whereas for basic material, POC with high affinity corresponds to their protonated species, R3NH+, see Equations 1-2. On the other hand, desorption can occur when pH increases, and the carboxylates become dissociated, R-COO-, and bases undergo deprotonation, R3N: [1],[6].
Even though both acidic and basic polar organic components can adsorb onto silicates, basic material adheres with more intensity onto sandstones than the acidic material [40]. Static adsorption studies of the model basic compound quinoline onto silicates showed that the quinoline adsorption process was pH-dependent [15],[41]; in these studies, acidic pH values in the aqueous phase increased the adsorption of positively charged quinoline, while a pH increase reduced the quinoline adsorption. Such a drop in adsorption levels stems from the reduction in the concentration of quinoline protonated species. The shift from protonated to non-protonated species in quinoline occurs as the pH increases, reducing its affinity to sandstones surfaces, hence reducing adsorption, Figure 3[15].

Figure 3 Adsorption tests on sandstone surfaces vs. pH. Quinoline adsorption against pH onto Illite clay and protonated quinoline fractions as a function of pH [15]. LS, low salinity brine, HS, high salinity brine, QH+, Protonated quinoline (redrawn by Strand).
Other researchers have also observed pH dependence on the adsorption trends using crude oil onto clay coated glass slides [42],Figure 4.

Figure 4 Crude oil adsorption against pH onto kaolinite coated slides at low salinity (1 g/l) and high salinity (50 g/l) [42].
Studies with quinoline as a model basic component showed that the process was controlled by pH, regardless of their salinity, Figure 5[6].

Figure 5 Quinoline adsorption onto kaolinite at room temperature as a function of salinity and pH [6].
It was also proved that the process was reversible as pH varied from steps 1 to 3, Figure 6. However, in step 4, with a lower pH, a reduction in adsorption was observed due to higher competition for adsorption from protons, [H+], vs quinoline [6].

Figure 6 Quinoline adsorption onto kaolinite as a function of pH, two sample sets were tested at 1,000 ppm, and 25,000 ppm brines with pH adjustment [6].
A greater affinity of basic over acidic material has also been reported by dynamic adsorption tests performed by Mamonov et al. (2019). His studies confirmed that the acidic material in sandstones does not have the same affinity as in carbonates, and the basic material appears to have greater influence on the rock surface wettability than the acidic material [43].
2. EXPERIMENTAL
CORE MATERIAL
Stevns Klint (SK) chalk was used in this work. The material was retrieved from an open pit quarry in Denmark. The mineralogy is shown in Table 1. The reproducibility of this material in wettability studies has been confirmed by several authors [27,44,45]. The permeability of the material ranged between 1-10 mg.
Table 1 Mineralogical composition (wt.%) of SK chalk outcrop material.
| Material | Calcite (At%) | Silica (At%) | Others (At%) |
| Stevns Klint (SK) | 99 | 1 | - |
The sandstone outcrop used in this experimental work was given by Total E&P. It has a 10 wt.% of clay minerals and a high content of feldspar minerals with -30 wt.%, albite being the predominant feldspar. The mineralogy was measured by X-ray powder diffraction and it is presented in Table 2. The material has an adequate reproducibility record in wettability studies [4,46,47], Typical permeabilities for the material ranged from 20 to 100 md.
Table 2 Mineralogical composition of the sandstone material.
| Core | Mineralogical composition (wt.%) | ||||||
| Quartz | Albite | Illite | Chlorite | Calcite | Others | Sum | |
| T15 | 56.7 | 31.9 | 8.4 | 1.9 | 0.3 | 0.8 | 100 |
The pore size distribution of the chalk outcrop material is shown in Figure 7. The pores range from ~0.01 to 0.7 μm. Most of the pores are located in the micro pore region close to 0.3-0.4 μm.

The pore size distribution of the sandstone outcrop material is also provided, and it shows that pores range from ~0.01 to 100 μm with most of them located in the macro pore region close to of 10 μm,Figure 8.

Physical core plugs properties of the material used are listed in Table 3. The description includes sandstones and carbonates.
CRUDE OIL
Model oils were derived from mixtures of stock tank crude oils. A fraction of the oil was treated to lower the AN and BN values to 0 mg KOH/g oil [32]. No asphaltenes precipitation was observed during the preparation of crude oils. The content of acids and bases in the crude oils was targeted to low values to detect POC adsorption and minimize uncertainties. Crude oil properties are shown in Table 4.
BRINES
All brines were prepared in the laboratory with reagent grade compounds purchased from Merck laboratories. The brines were filtered through a 0.22 μm Millipore filter. FWS was used in the carbonate chalk system, and it was prepared with a ionic composition similar to that of a given formation water of a North Sea chalk reservoir. However, this brine was depleted in sulfate to avoid induced wettability alteration processes in the rock [5,48] FWS was used for establishing initial water saturation, Swi, and as imbibing fluid in the SI tests. In the sandstone core material, FWT and FWLS were used for both establishment Smi and as imbibing fluid for the SI tests. FWT is a synthetic formation water composition containing only calcium as a divalent cation, FWLS is a synthetic low salinity brine used as formation water. Brines ionic compositions and measured properties are listed in Table 5.
Table 5 Brine compositions
| Ions | FWS mM | FWT mM | FWLS mM |
| Na+ | 997.0 | 817.6 | 17.1 |
| Li+ | 0.0 | - | |
| K+ | 5.0 | - | |
| Ca2+ | 29.0 | 20.0 | |
| Mg2+ | 8.0 | - | |
| SO 4 2− | 0.0 | - | |
| SCN- | 0.0 | - | |
| HCO 3 2− | 9.0 | - | |
| Cl- | 1066.0 | 857.6 | 17.1 |
| Density (g/cm3) | 1.041 | 1.035 | 0.999 |
| TDS (g/L) | 62.83 | 50.00 | 1.00 |
| Bulk pH | 6.7 | 5.8 | 5.7 |
| Ionic strength (mol/L) | 1.112 | 0.877 | 0.017 |
Bulk pH values were measured in freshly prepared synthetic brines with no previous contact with the core material. The measured values were on the slightly acidic region with values between 5.7 and 6.7.
3. METHODS
CORE CLEANING.
The outcrop chalk cores were mounted into a Hassler core holder and flooded with 5 PV of de-ionized water (DI) at 23°C. This step is essential to remove dissolvable salts bearing sulfate [48]. Then, the cores were dried at 90 °C until achieving constant weight.
The sandstone core T15 was used in a previous test with oil. Therefore, the core underwent a mild solvent cleaning with kerosene and heptane. The mild cleaning is a process aimed at not changing the wettability of the core substantially by removing residual oil but not removing polar components from the pore network. Subsequently, a 1000 ppm NaCl brine was injected to remove the heptane and avoid clay swelling. The core T29 was not previously exposed to oil; thus, it was only cleaned with 1,000 ppm NaCl brine. Lastly, the cores were dried at 90°C, as mentioned above.
ESTABLISHING Swi.
After drying, Swi was established at 10 or 20 % by using the desiccator technique [49]. After reaching the target weight by evaporation and Swi, the core was stored for a minimum of 3 days to obtain an even ionic distribution.
OIL EXPOSURE
Once Swi was established in each core, the plug was mounted on a Hassler core holder with a back pressure of 20 bar and a confining pressure of 10 bar. Crude oil was injected core at 50°C at an injection rate of 0.1 ml/min. Effluent samples were collected to measure the AN and BN values.
OIL RECOVERY BY SPONTANEOUS IMBIBITION (SI)
All SI oil recovery tests were conducted in glass Amott cells. The oil production during the SI tests was logged against time. The sandstone core material was not subjected to aging after crude oil exposure, and the SI test was performed at 60 °C. After oil saturation, the chalk core was wrapped in Teflon tape to avoid non-representative POC adsorption during the aging process. The core was then stored in a steel aging cell surrounded by crude oil for 14 days at 50°C before running the recovery tests at 50°C.
4. CHEMICAL ANALYSIS
ACID NUMBER AND BASE NUMBER MEASUREMENTS
The auto titrator Mettler Toledo DL55 was used to quantify the AN and BN effluent values by potentiometric titration. The implemented methods are versions of the ASTM 664 for AN titrations and ASTM 2896 for BN analyses [21]. The accuracy of the measurements was ±0.01 mg KOH/g.
BET SPECIFIC SURFACE AREA MEASUREMENTS
Surface area measurements (BET) were carried out in a TriStar II PLUS from Metromeritics®. The samples were not crushed down to powder to obtain representative surface area values of the porous media.
SEM /EDAX
Small pieces of the material were analyzed in the Scanning Electron Microscopy (SEM). The instrument was a Zeiss Supra 35VP microscope. It counted with an Energy Dispersive Spectroscopy (EDS) device for mineralogical analyses and quantification.
5. RESULTS AND DISCUSSION
Before the first oil migration into a reservoir, there are multiple reactions taking place between the rock and the brine; due to the high ratio of minerals in relation with the aqueous phase, the minerals appear to dominate the rock-brine interaction. Typical geochemical interactions include processes such as diagenesis of minerals, dissolution, precipitation, and ionic exchange. Prior to oil invasion, specific pH values of resident brines will influence the speciation chemistry of the POC components present in the invading crude oil, Equations 1-2.
Broadly speaking, reservoirs dominated by CaCO3 minerals will predominantly have alkaline values, whereas sandstones will display acidic pH values. However, there are cases that may differ from these trends, and such deviations can be caused by the presence of reactive minerals or impurities [4,50-54]. Furthermore, the differences in pH can induce changes in the relative concentration of the POC species, shifting the POC affinities towards mineral surfaces.
The role of acidic components, summarized in the AN number, has drawn substantial attention in the literature and it is often assumed that the AN has a similar impact on sandstones. Thus, a comparison study of the affinity of the acidic polar components in a pure calcium carbonate and sandstone surfaces was necessary to properly address the role of the acidic components.
CARBONATES AND DYNAMIC POC ADSORPTION.
The carbonate core plugs are retrieved from a Stevns Klint quarry. The CaCO3 constitutes more than 99 wt.% of the material. SK chalk is characteristic for having a rather low permeability, ranging from 1 to 10 md, and a high porosity with typical values of 45 to 50 %; the main constituents of the rock matrix are fragments of coccolith fossils, with some coccolithic rings being well preserved as shown in Figure 9. SK is chalk and it originates in the uppermost Maastrichtian period. Therefore, it has been considered a valid analog for chalk reservoirs of the North Sea [36].

Pure chalk has positive CaCO3 surfaces. The point of zero charge of chalk with similar characteristics is in the range of pH~8-9 [35]. Researchers have reported positive surface charges in SK chalk in contact with brines, with a large amount of Ca2+ and Mg2+ ions [2]. Injecting FWS brine into SK chalk results in an effluent with a slightly alkaline pH [55].
After establishing, Swi= 10% with FWS, the crude oil S was injected to evaluate the adsorption of POC. Effluent samples were taken and then analyzed Figure 10.

Figure 10 Development of the AN and BN in the crude oil effluent, the test temperature was set at 50°C. The crude oil injected had original values of AN = 0.40 and BN = 0.35 mgKOH/g oil. During the test, the Swi = 10 % FWS.
The first observation from this figure is that the AN drops to nearly -0 mgKOH/g oil, confirming the high affinity of acidic polar components towards positive carbonate surfaces. This is a drastic drop from the original AN value of 0.4 mgKOH/g oil. As the oil flood progresses, the adsorption continues, and the equilibrium is met at 9 PV. BN values followed a similar adsorption trend, in line with experimental evidence signaling to co-adsorption of polar components [29]. However, the first BN effluent value is not as low as that of the AN. It is noticeable that adsorption occurs instantaneously. Such behavior has been previously reported by Hopkins et al. [27,28,38, 56]. Another important remark from Hopkins is that instantaneous adsorption induces mix-wet behavior in chalk cores.
ADSORPTION QUANTIFICATION OF CRUDE OIL POLAR COMPONENTS
Quantification of adsorbed POC can be done by estimating the area between injected and eluted values. By using a trapezoidal method, the adsorbed AN POC can be defined as Anas, and the targeted area can be calculated with the following equation:
Where PVn is the number of PV of crude oil injected until reaching equilibrium or the original crude oil AN value, AN¡. The terms PVX and PVX+1 represent the PV for the integration steps x and x+1; similarly, ANX and ANX+1 represent the AN values at PVX and PVX+1.
Likewise, adsorption of basic material is defined by the term, BNads: where, PVn is the number of PV of crude oil injected until reaching equilibrium or the original crude oil BN value, BNi. The terms PVx and PVx+1 represent the PV for the integration steps x and x+1; likewise, BNx and BNx+1 represent the BN values at PVx and PVx+1.
The summary results of this section are shown in Table 6.
Table 6 Quantified adsorption of POC in core SK1.
| Core | SK1 |
| Swi (%) | 10 |
| ANads (ml*mg KOH/g) | 1.33 |
| BNads (ml*mg KOH/g) | 0.93 |
The acid adsorption, ANads, was 43 % higher than the base adsorption on pure SK chalk, confirming the higher affinity of acidic polar components towards carbonate surfaces. On the other hand, the results indicated that the bases also underwent significant adsorption, but the intensity of the process is lower. This could be driven by strong co-adsorption of POC to correctly address the role of the basic material, so further experimentation is recommended. The core not subjected to oil injection was restored with Swi= 10 % using FWS, and then it was flooded with mineral oil (heptane), Figure 11. The core SK3 showed a strong water-wet behaviour after spontaneous imbibition with FWs. The production plateau of 75 %00IP was rapidly attained after 1 hour.

Figure 11 Oil recovery test by SI with FWS as the imbibing fluid at 23°C on the water-wet core SK3. Core restored with Swi= 10 % (FWS) and saturated with mineral oil (heptane).
On the other hand, the core SK1 used in the adsorption test was aged for 14 days and then subjected to a similar SI test using FWS as imbibing fluid. The temperature test was 50°C, and its ultimate oil recovery was 6% OOIP, Figure 12.
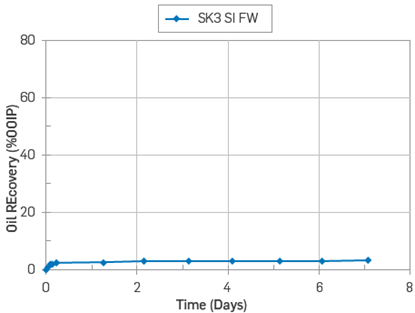
Figure 12 Oil recovery test by SI with FWS at 50°C on core SK1. Core restored with Swi =0.1(FWS) and flooded with 15 PV with Oil S.
The core SK1 had shown a mixed-wet behaviour after oil exposure. The results confirmed the capacity of reducing the water-wetness degree on a carbonate core after oil flooding.
SANDSTONES AND DYNAMIC POC ADSORPTION.
The sandstone outcrop mineralogy includes several types of silicates, such as quartz with 56.7 wt.%, Illite clay with 8.4 wt.%, and albite with 31.9 wt.%. Additional mineralogical details are found in Table 2. A SEM photo of the material is shown in Figure 13; the image shows the presence of various silicates. Pore throat sizes range from ~0.01 to 100 μm, with most pores being close to 10 urn, Figure 8. Typical pH brine effluent values in the presence of crude oil for this material have been reported to be slightly acidic ~6.5 [4],[6],[46].

Figure 13 SEM photo taken from the sandstone material used. Silicates such as clay, quartz, and feldspars were identified magnification 1000X.
The core T15 was restored by establishing Swi = 20% with FWT, followed by crude oil injection (10 PV) at 50° C, crude oil T had an AN=0.17 and BN=0.23 [43]. The development of the adsorption profiles is shown in Figures 14-15.
UJ
Equilibrium was reached after 8 PV for the AN, Figure 14, which means that the available centers of adsorption for the acids were rapidly saturated. The total amount of acidic polar components adsorbed during the oil flooding test was estimated to be 0.10 [ml. mgKOH/g].

Figure 14 Adsorption profile, AN vs. PV injected on core T15. The core was restored with Swi = 20% FWT and flooded 10 PV with crude oil T. Crude oil T had a AN = 0.17 and BN = 0.23, T=50°C [43].
The adsorption development for the basic material was utterly different. After 10 PV of injection, the BN values stabilized at around 0.15 mgKOH/g. Therefore, bases were constantly being deposited or adsorbed onto the outcrop surfaces. The experiment was ended after 10 PV without reaching saturation of the available centers of adsorption for the basic POC, Figure 15. The fact that BN did not reach equilibrium, which means that the rock surface had a larger proportion of centers of adsorption available for the basic material compared to that of the acidic material. The estimated number of bases adsorbed was 0.66 [ml. mgKOH/g]

Figure 15 Adsorption profile, BN vs. PV injected on core T15. The core was restored with Swl = 20% FWT and flooded 10 PV with crude oil T. Crude oil T had a AN = 0.17 and BN = 0.23, T=50°C [43].
By performing a mass balance calculation, it was concluded that a 6.6 % of the acidic material got adsorbed onto the sandstone surface, whereas a staggering difference in basic material adsorption was observed, with a total 31.9 % being adsorbed during crude oil injection.
Another sandstone core plug termed T29, retrieved from the same block as T15, was used as a strongly water-wet reference. This core was not exposed to crude oil; instead, a mineral oil (heptane) free of POC was used, and the core was restored with the same, Sw¡ = 20% using a brine termed, FWLS.
Although the FW composition was not the same for both cores, core T29 still acts as a strongly water wet reference as there was no wettability alteration previously induced by crude oil adsorption in the virgin sandstone outcrop plug T29, Figure 16.

Figure 16 SI test of core T29 at 50'C using FWLS as imbibing brine. The core was restored at Swi = 20% with FWLS and saturated with mineral oil (Heptane).
After conducting the dynamic adsorption test, core T15 was directly subjected to a SI test at 50°C, with FWT as imbibing fluid. The results are shown in Figure 17.

Figure 17 SI test carried out at 60'C by SI using FWT as imbibing brine. Core restored with Swi = 20% using FWT and exposed to 10 PV of Oil T without the aging process.
Core T29 was only exposed to mineral oil (heptane) without POC. It reached 30 % 00IP in less than 30 minutes and ultimate oil recovery of 34 % 00IP after 2 days, thus confirming the expected strongly water-wet conditions, Figure 16.
The core exposed to crude oil, T15, was not aged prior to the SI test at 60 °C. The SI results confirmed a reduction in water-wetness. The core reached a production plateau after 12 days, with a recovery factor of 12 %00IP, Figure 17. These results suggest that Instantaneous POC adsorption leads to rapid changes in wettability Such changes are not a consequence of the aging process; this observation is in line with Mjos et al. work (2008).
ADSORPTION TRENDS ON CARBONATES AND SANDSTONES SURFACES
Dynamic adsorption tests of both acidic and basic POC were carried out in pure SK chalk and sandstone outcrop material. Larger adsorption of acidic POC was observed in CaC03 surfaces in relation with basic POC. A different adsorption behaviour was observed on sandstones, where acidic POC was adsorbed in a lower proportion than the basic material. A summary of the adsorption tests is presented in Table 7.
Table 7 Summary of dynamic adsorption tests.
| Outcrop | SK Chalk SK1 | Sandstone T15 |
| Lithology | Carbonates | Sandstones |
| BET, m2/g | 2.2 | 1.8 |
| Anas | 1.33 | 0.102 |
| BNads | 0.93 | 0.66 |
| BNads/ANads | 0.70 | 6.5 |
The ratio termed BNads/ANads, is dramatically lower for the SK chalk with a value of 0.7. This means that the acidic POC had a higher affinity towards CaC03 surfaces, and the consequence was higher adsorption of acidic components. On the contrary, in sandstones, the adsorption of acidic components was lower as compared to basic adsorption. The ratio BNads/ANads was 6.5 for the sandstone material,
GENERAL OBSERVATIONS
Ih carbonates, strong buffer effects create steady pH values and, therefore, stable positive surface charges. Thus, direct adsorption of negatively charged acidic components onto positively charged carbonates appear to be the dominant adsorption process.
For sandstone surfaces, the pH is the main parameter affecting the crude oil-rock-brine interaction. Even though silicates are negatively charged in a wide range of natural conditions, specific crude oil-rock-brine equilibriums will induce different pH values for each reservoir system. Such ionization processes will affect the relative abundance of positive basic material in crude oil that will be readily available for adsorption at negatively charged sandstone surfaces, as stated in equations 1-2.
Cations present in the brine and polar organic components available in crude oil appear to compete to balance the adsorption centers of sandstone surfaces. Therefore, they should be seen as competitors during the adsorption and desorption processes.
The system's specific pH value, combined with cation exchange capacities (CEC) of the mineral phase, will determine relative probabilities of adsorption for cations and POCs onto negatively charged sandstones. The polar components with a higher likelihood of adsorption onto negatively charged sandstone surfaces are protonated bases, contrary to non-protonated bases.
The adsorption trends observed in both sandstones and carbonates indicate that adsorption processes are triggered by attractive interactions of ionic charges present in mineral surfaces and polar components in crude oil. These interactions appearto be direct ionic interactions between POCs and charged mineral surfaces,
WHY DO WE OBSERVE THESE DIFFERENCES IN AFFINITIES AND ADSORPTION INTENSITY?
As mentioned before, the brines' pH can influence the POCs protonation state in the oil phase. Strong buffer effects in carbonates lead to slightly alkaline pH values. In such conditions, carboxylic acids are more prone to remain as negatively charged carboxylates, R-COO~, having an increased affinity to the positively charged carbonate surface; such interaction is stronger than that of the deprotonated and neutral basic material, R3N: at similar pH conditions [34],[35].
Conversely, the pH of sandstones is slightly acidic, and their surface charge is negative. In such circumstances, the POC species with higher affinity are the non-dissociated and neutral carboxylic acids, R-COOH, and protonated bases, R3NH+. Therefore, the negative sandstones surfaces will have a higher affinity for the positively charged bases than the neutral non-dissociated carboxylic acids [1],[6].
However, it is risky to simplify the adsorption trends observed as a function of electrostatic interactions between POC and mineral surfaces. From a general perspective, this idea can facilitate our understanding, but polar organic components are complex. Additionally, the nature and compositions of each crude oil has numerous types of POC, with different dissociation and protonation constants, pKa, and pKb values. Thus, experimental work is the only way to shed light on specific adsorption phenomena associated with mineralogical heterogeneous reservoirs.
Another important observation is that the SI tests showed mixed-wet behaviour and a drastic drop in capillary forces in the cores exposed to crude oil, including core T15, which was not subjected to an aging process at all. A summary of the tests included in this work is included in Table 8.
CONCLUSIONS
In this work, crude oil POCs dynamic adsorption tests have been compared between pure chalk and sandstone outcrop material. The main conclusions derived from this work are:
The adsorption of acidic polar components was larger than that observed for the basic polar components in carbonates. This confirms that the AN of crude oil is one of the main parameters influencing carbonates' wettability.
In sandstones, the adsorption of basic polar components was more significant than the acid adsorption, suggesting that the BN of a crude oil is a more relevant wetting parameter than the AN for silicate surfaces.
Instantaneous adsorption of POC was observed for both sandstones and carbonates.
The studied adsorption processes appeared to occur under direct ionic interaction between POCs and charged mineralsurfaces in both sandstones and carbonates.
POC adsorption induced mix-wet conditions on both sandstones and carbonates surfaces. In the case of sandstone core, T15, mix-wet conditions were reported without undergoing an aging process after crude oil exposure.
The results can be used to improve reservoir characterization routines by weighing the relative effects of acid or basic polar organic components on the wettability of sandstone and carbonate reservoirs.

