


 English (pdf)
 Article in xml format
 Article references
 Send this article by e-mail
 Cited by SciELO
  Cited by Google
  Similars in
SciELO
Similars in
SciELO  Similars in Google
 Permalink
1. INTRODUCTION
Enhanced oil recovery processes could render strong benefits when the reservoir has produced large volumes of crude oil, and water cuts are very high. Chemical Enhanced Oil Recovery (cEOR) are techniques that have been proven for more than 40 years, reaching recovery factors between 5 and 15% (FLOERGER, 2016; Gbadamosi et al., 2019). and translating into great profitability in the implemented project. Water-soluble polymers are commonly used to increase viscosity, improving the volumetric sweep efficiency and, hence, the recovery factor (Delamaide, 2021).
Previous research works have studied technical problems related to the polymer-influenced effluents treatment in the case of polymer breakthrough. Stable and viscous emulsions, corrosion problems, and negative interactions between polymers and oilfield chemical additives as demulsifiers reducing the separation process efficiency have been reported (al kalbani et al., 2014; Argillier et al., 2018; Argillier et al., 2013; Chen et al., 2015; DeHekker et al., 1986; Graham & Frigo, 2019; Jacob et al., 2015; Mouret et al., 2022; Rambeau et al., 2016; Rowalt, 1973). The nature and severity of operational problems were confirmed during some polymer flood projects (Clemens et al., 2013; Leitenmueller et al., 2017; Manrique et al., 2017; Mehta et al., 2016). In the polymer injection implementation, it is expected that part of the injected polymer returns in the production fluids, to subsequently reach surface treatment systems. Polymer concentrations as high as 1000 ppm were found in the effluents of pilot influenced producing wells (Thakuria et al., 2013). The production profile including cEOR concentration in back produced fluids can also be simulated in some reservoir engineering studies, with relatively good accuracy. Over a certain polymer residual concentration, the emulsions type (W/O, water-in-oil - O/W, oil-in-water) and emulsion stability could be affected. The oil dehydration process and the whole water treatment chain may be disturbed and would not be efficient at the same operating conditions.
Colombian oil fields face new challenges; one of them is the handling of stable emulsions. Either those generated naturally when crude oils flow into the production wells due to the effect of the pressure gradient between the reservoir and the lifting and transport fluids conditions, or those caused when exogenous fluids such as gas, water, or chemicals are injected into the reservoir. Heater fouling risk should not be neglected as most of the surface facilities operated by ECOPETROL are equipped with heater treaters (Dhaliwal et al., 2021; Mittal et al., 2018; Wylde et al., 2011; Zagitov et al., 2020). Since ECOPETROL has been conducting several polymer flood pilots in various fields with widely varying conditions, it was necessary to assess the potential impact of EOR polymer on the separation of the back produced fluids and their treatment and include its impact in the technical and economic considerations for future expansion. This risk assessment study was focused on Yariguí field conditions. Thanks to a close collaboration between field operation staff and several laboratory teams, it was possible to work in conditions as representative as possible to that observed in the field (temperature, residence time, technology, etc.).
This experimental study, carried out using methodologies and experimental tools developed at IFP Energies Nouvelles (Cassar et al., 2021; Dalmazzone, 2017; Mouret et al., 2022), analyzed the potential effects of residual polymer concentration on surface treatment conditions of the Yariguí field, as shown on Figure 1 and Figure 2. Its results provide an approach to understand the possible polymer effects on emulsions and production fluids at a laboratory scale. The laboratory study then consisted in four experimental tasks to evaluate the main stages of effluent treatment, and the inherent risks in the presence of residual polymer: first of all, the water/oil separation and emulsion, including the electrostatic dehydration, then the heater fouling and finally the water treatment processes. The fluids and experimental means used at laboratory scale, as well as their parameters, were chosen to be as close as possible to the process of back-produced fluids treatment. The conclusions and findings of the study can be used to assist the front-end engineering and design considerations of the polymer implementation project. This kind of risk assessment approach would prevent the oil operator from facing potential problems, and help it to be ready to tackle operational issues in the event of polymer breakthrough.


2. EXPERIMENTAL DEVELOPMENT AND SET UP
FLUIDS AND CHEMICALS
The oil used for this study is a medium crude oil sampled on the Yariguí field, with API of 20 degrees, and viscosity 55cP at 65°C. This oil is made up of the following fractions: 27% C6-C20, 17% Saturates C20+, 15% C20+, 31% Resins and 11% Asphaltenes (% in weight). To meet the necessary criteria for this experimental study, we checked that this oil did not contain water and was not polluted by flow assurance chemicals. To such effect, we performed water determination by a Karl Fischer titration and an interfacial tension measurement, with a reference water with 10 g/L NaCl, using the Wilhelmy plate method. The results show a water content of less than 1 wt%, and an interfacial tension of 28 mN/m at 50°C, which is usually measured for a crude oil without chemical additives; these additives, even at low concentrations, significantly reduce the interfacial tension.
The brines used for this study are synthetic waters reconstituted in the laboratory with different salts of analytical grade dissolved in demineralized water. Synthetic brines are representative of the field fluids, according to the physical-chemical composition described in Table 1.

The brine composition corresponds to the synthetic water injection, except specifically in the fouling tests in case of a mixture of injection water and production water (Table 2).
Table 2 Synthetic waters composition: injection water, producer water, and mixture of 50% produced water and 50% injection water.

The conductivity and salinity data of the synthetic waters shown in Table 3, have similar values to those of real brines (Table 1)

Seeking as the most representative field conditions, the corrosion inhibitor and scale inhibitor were also added to the brine at concentrations similar to that of the aqueous phase produced on site, i.e., 21 ppm corrosion inhibitor and 30 ppm scale inhibitor (except for the water treatment tests: 34 and 42 ppm, respectively).
The EOR polymer is the partially hydrolyzed polyacrylamide (HPAM) used on site. It was solubilized in the brine of interest for about 15 hours under slow agitation at different concentrations, from 200 to 800 ppm depending on the tests. This concentration range matches the simulation data for different scenarios of polymer recovered on topside processes. The polymer solution was pre-degraded prior to emulsion testing, reducing the viscosity of approximately 35% at the shear viscosity plateau (~200 s-1). Additionally, in the bottle tests, emulsion is prepared by high shear stress (25,000 s-1), which causes decreasing of viscosity up to 1.2 cP (800 ppm) and 0.5 cP (200 ppm) in the separated water phase.
The efficiency of the direct demulsifier and the water clarifier, coagulant type, used on site will also be evaluated in these tests.
OIL / WATER SEPARATION BOTTLE-TEST
The experimental approach to assess the impact of EOR polymer on emulsion risk consists in carrying out bottle-tests and analyzing the quality of the separated phases, oil and water, at characteristic times representative of the field residence time in various vessels. To such end, a volume of 60 mL of emulsion is prepared by mixing, with an Ultra-Turrax T25 disperser, brine and crude oil preheated to test temperature. Thus, the required volume of oil is placed in a beaker and the aqueous phase is slowly added for 1.5 min using a graduated pipette and under a stirring of 3000 rpm; then, the mixing continues for one more minute in the same conditions. For tests nvolving demulsifier, the additive is introduced at this point using a syringe and an additional 10-seconds stirring to finely disperse it into the emulsion. The emulsion is then poured into a graduated cylinder (equipped with a cap) to better visualize the phase separation. The cylinder is kept at bottle-test temperature during the test,
Phase separation is then followed by tracking the levei of the oil/ water interface as a function of time and thus the separated water phase is estimated and expressed in relation with the total volume of water, Le., we will note 100 vol% if the water separation is total regardless of the water-cut. During this process, pictures are taken at different intervals over a period of 21 hours. In parallel, both separated phases are collected for laboratory analysis, at 5h for water, and 21h for oil corresponding to the treatment time required in the field. On the one hand, the top oil phase quality, i.e., the water-in-oil (WO) content, is measured by the volumetric Karl-Fischer method, which relies on a bi-potentiometric titration that measures the amount of iodine consumed by water in an alcoholic medium. On the other hand, the bottom water phase quality, i.e., the oil-in-water (OW) content, is determined by a liquid/liquid extraction using dichloromethane and then UV spectrophotometry measurement of the extracted sample, considering a calibration curve previously used with the same crude oil. The bottle tests were performed with a water-cut of 74%, at a temperature of 65 °C, which are the current conditions in the Yariguí process. A second series of tests, at a water-cut of 50% was also performed with the expectation that injection of EOR polymer into the reservoir would increase oil production and, therefore, decrease the water-cut of the back effluent produced. For both water-cuts, two polymer concentrations were assessed: 200 ppm and 800 ppm. These correspond to the lower and upper limits of the polymer residual concentration predicted by the reservoir simulation. Reference tests without polymer were also performed. The demulsifier was evaluated at a concentration of 300 ppm, which is approximately 5 times the concentration used on site. That concentration was defined in preliminary tests intended to determine the efficient concentration on an emulsion without polymer inside; the overdosing is explained by the fact that at the laboratory scale the tests are conducted in static conditions and, therefore, require a higher concentration for this type of medium oil than on site under dynamic conditions.
ELECTROSTATIC OIL DEHYDRATION TEST
The Electrical Stability Test (EST) is based on those conducted for drilling muds (API 13B-2), which allows simple measures for the development of chemical demulsifiers for treating WO emulsions (Beetge & Horne, 2005; Dalmazzone et al., 2010).
A simple electrode is dropped in the fluid, and AC voltage is applied at 340 Hz frequency. The voltage amplitude increases progressively at a rate of 150 V/s, and it is limited to a maximum of 12.9 kV/cm. The current intensity is then measured, and the critical voltage is recorded at 61 µA, which corresponds to the short-circuit of the device. The higher the critical voltage, the higher the stability of the emulsion. In fact, by recording the critical voltage over time, a decrease of this value is usually observed, corresponding to the destabilization of the emulsion. This decrease is more important in the presence of an efficient demulsifier, and it varies with its concentration (see Figure 3) (Dalmazzone et al., 2010).
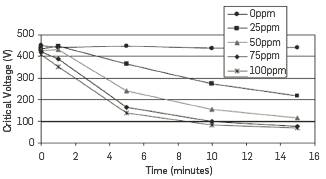
Figure 3 Example of EST tests with different demulsifier concentrations, with permission of Dalmazzone et al., 2009 (Dalmazzone et al., 2010).
The emulsion samples are prepared by means of an Ultra-Turrax T25 mixer where the pre-heated oil is placed, and the pre-heated brine is slowly added drop by drop during mixing at 6,000 rpm. The addition of the brine takes 1 minute, and the resulting emulsion is stirred for another 9 minutes at the same mixing rate. For the tests containing the demulsifier, it is introduced after the emulsion formation using a syringe and the mixture is stirred for an additional 10 seconds. The EST probe is then introduced in the emulsion, and measures are taken at 0, 1, 3, 5 and 10 minutes. In all cases, the fluids are kept at constant temperature (77°C). Further emulsion characterization is also performed at 0, 1 and 24 hours, including WO measurements, DSC, or microscopy.
Two different polymer concentrations corresponding to the most probable back concentration (200 ppm) produced, and the maximum concentration expected in the worst case (800 ppm) have been tested with a water-cut of 8%. In addition, two different demulsifier concentrations have also been used corresponding to the field concentration (62 ppm), as well as the corresponding concentration for a static laboratory test, which is 3 to 5 times the field concentration (300 ppm).
PRECIPITATION AND HEATER FOULING SET UP
SET UP
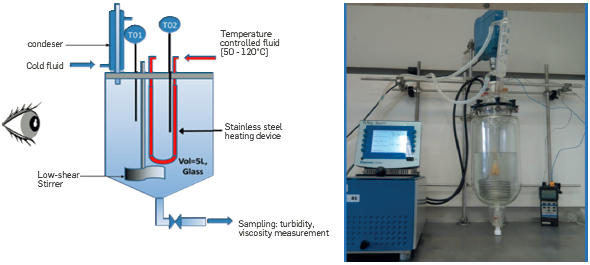
The Cloud point unit is designed to observe polymer precipitation with different brine compositions. This simple set-up is composed of a 3 L transparent reactor in which a heating tube is immersed (Figure 4). The temperature is measured in the bulk (T01) and at the surface of the heating pipe (T02). Nitrogen is injected in the solution to deoxygenate the aqueous solution and avoid polymer chemical degradation. The water that evaporates is re-condensed into the reactor.
This high-pressure fouling unit, the so-called Heater fouling unit, was designed and built at IFPEN to mimic conditions that can be encountered in a real heat exchanger for enhancement of the phase separation in presence of crude oil and produced water emulsions. As illustrated on Figure 5 and Figure 6, the unit is made up of a 4 L Hastelloy reactor in which a heating tube is immersed. The outer surface of the reactor is refreshed to maintain a temperature gradient between the hot surface and the bulk. The temperature is measured in the bulk (T01) and at the hot surface (T06). It is also measured at the inlet (T04) and the outlet (T02) of the heating pipe and at the inlet (T03) and the outlet (T05) of the outer low temperature pipe.

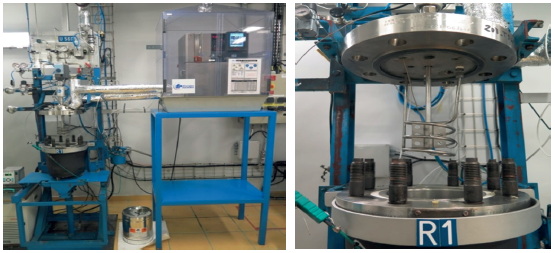
Nitrogen is injected in the solution to deoxygenate the aqueous solution and avoid polymer chemical degradation. Nitrogen injection also allows to reach a pressure high enough to avoid water evaporation (P01). A low-shear stirrer is used to homogenize the temperature (M).
PRODUCED WATER PREPARATION.
For Cloud point tests, the polymer soLution was pre-degraded prior to testing using a Silverson stirrer at 8800 rpm. The criterion for pre-degradation was a decrease in viscosity of approximately 35% at the shear viscosity plateau (~200 s-1). The time required for polymer degradation to reach a target viscosity was previously determined by taking a viscosity measurement every minute while stirring the solution at 8,800 rpm (Figure 7).

Figure 7 Evolution of the viscosity value (Red) and degradation rate (Blue) at a shear rate of 200s-1 as a function of the stirring time (Silverson - 8,800 rpm) for an 800 ppm polymer solution.
For Heater Fouling tests, the emulsion was prepared for a given a water-cut (volume of water phase / total volume) using a Silverson stirrer at 8,800 rpm. The stirring time was a balance between obtaining a stable emulsion and the required mechanical degradation of about 30% of the polymer solution. In this case, emulsion and degradation were the same operation.
A sample was taken to monitor the emulsion at room temperature and to measure the viscosity of the aqueous phase after settling to confirm the level of degradation of the polymer solution.
TEST MATRIX
Two tests with 800 ppm of polymer were performed on the transparent set-up to screen two different brines: 50% injection - 50% produced water and 100% injection water. The hot surface temperature was set at 77°C during 5h at steady state conditions. The tests carried out on the Heater Fouling unit are listed in Table 4. A third brine case was tested in this study to investigate the worst case scenario: the case of a monovalent-divalent (M/D) ratio of about 3, the risk of polymer precipitation being higher when the M/D ratio is lower due to the bridging effect (Thomas et al., 2012).
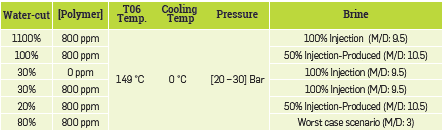
The hot surface temperature was set at 149°C and the cooling unit was set to 0°C to establish a temperature gradient between the surface of the heating pipe and the wall to promote deposits formation on the coil. The stirring rotation speed was set at 200 rpm to preserve the emulsion.
As for duration times, the polymer solution was observed after 1 hour from steady state conditions (around 2h are required to reach stable temperature conditions). Some tests were extended to more than 15 hours of heating time to assess more severe conditions.
WATER TREATMENT
The investigation about EOR polymer impact on water treatment relies on the preparation of representative produced waters and lab treatment methodologies. They are respectively explained in the following paragraphs.
PRODUCED WATER PREPARATION.
The basic step of produced water preparation is the obtention of a highly concentrated oil in water emulsion. This emulsion is called "mother emulsion", because all the produced water samples result from its dilution within selected brines. It is prepared by introducing 105 mL of crude oil in 45 mL of distilled water, using the Ultra-Turrax T25 homogenizer. The intensity and duration of mixing are crucial parameters to monitor the size of oil droplets. They were set here to 24000 rpm and 5 minutes to get an average droplet size diameter of 5µm. These values are adjusted depending on oil viscosity and preheating temperature. The aqueous phase contains a small amount of salt (7.5 g/L of NaCl) and of non-ionic surfactant (1% in weight of Triton X405). The amount of surfactant is optimized to stabilize the mother emulsion without influencing the further treatment of associated produced water. Its presence allows the long-term storage of the emulsion. The morphology of the emulsion s identified by optical microscopy and by dynamic light scattering.
Produced water samples are obtained by pouring the required amount of emulsion within aqueous phases to achieve the exact concentration of crude oil (typically ranging from 200 to 2,000 ppm). As oil droplets are already surrounded by water in the mother emulsion, a gentle stirring is enough to disperse them in the water. When the aqueous phase contains a dissolved polymer, gentle stirring avoids its mechanical degradation and allows to keep the size of oil droplets constant. The volume of added mother emulsion is so small that the salinity of the produced water is not affected.
WATER TREATMENT METHODOLOGIES
Several lab scale devices are suggested at IFPEN to investigate the treatment of produced water using representative field conditions. They include various technologies based on different mechanisms. Most of them rely on gravity separation, which s efficient due to the significant density differences between oil and water. This is the case of API tanks and the plate separator that constitute the primary treatment. They can be followed by additional methods offering more severe conditions with increased acceleration (hydrocyclone, centrifugation), or reinforced density difference (flotation). They constitute the secondary treatment. Further methods address the smallest oil droplets (< 3 µm) and even dissolved hydrocarbons: media or membrane filtration, reverse osmosis, biochemical processes etc. They constitute the tertiary treatment.
The methods used for investigating the EOR Yariguí case belong to the three classes with: long term gravity tests, jar tests, flotation and walnut shell filtration. They are successively described below. Gravity separation is one of the first methods used to remove oil droplets from produced water. As already mentioned, it relies on the difference of density between the aqueous and the organic phase that makes the lighter one rise. The rising speed of a single droplet is approximated by Stokes' law:

With
p p : density of particle (here oil droplet),
p f : density of suspended fluid (here aqueous phase),
µ: viscosity of suspended fluid (here aqueous phase)
g: gravity acceleration,
R: radius of the rising oil droplet.
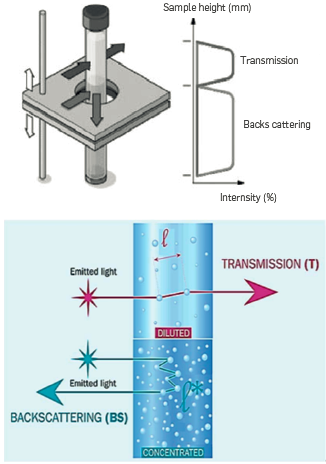
This equation demonstrates that an increase in oil droplets (that can be obtained by flocculating agents) favors the rise of the particles, Turbiscan Lab device (cf. Figure 8) was used to investigate the Long-term creaming of oil droplets of produced waters. It relies on the measurement of transmitted and back-scattered light by the sample contained in a glass tube (cf. Figure 9). When the sample is concentrated, as in the case of produced water, light transmission is measured a 11 along the tube as a function of time. Creaming velocity can be quantified with the increase in average light transmission of the sample calculated by the software of the equipment. The device is thermally controlled. Temperature was set at 40°C,
In parallel with these tests, beakers full of produced water were put in an oven at the same temperature. This made it possible to take samples and measure the content of oil dispersed in the aqueous phase using the same method as that used in the Emulsion risk task (liquid/liquid extraction with dichloromethane and UV measurement).
The jar test is a classical device to study separation of components resulting from static gravity separation (settling or creaming) optionally combined with flocculating agents. The equipment (Lovibond ET750) that has been employed is shown in Figure 10.
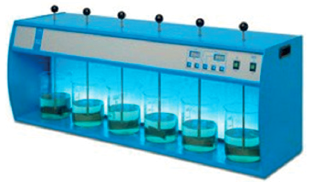
Test conditions have been adapted from ASTM D2035 norm. They comprise the following steps:
pouring of the additive within 400 mL of initially introduced sample at 370 rpm, which is the highest speed that can be generated by the device (400 rpm in ASTM D2035 Standards),
370 rpm for 1 minute (400 rpm for 1 minute in ASTM D2035 Standards),
70 rpm for 15 minutes,
20 minutes of static conditions.
The lab-scale flotation cell used is based on mechanical introduction of gas through a sintered glass disk located at the bottom of the column (Figure 11). It was designed and built at IFPEN. The dimensions of the column are: 65 mm of inside diameter and 500 mm of height. The sintered disk can be removed, and different pore sizes can be tested. The one used for this campaign was set to 16pm, which is a medium size, to get small bubbles with a sintered disk that is not subject to fouling. A volume of 400 ml of sample is poured in the column. Air is introduced through the disk at a given flow rate (200 L/h), with a controlled pressure (1 bar). Generated bubbles rise and collect oil droplets. This phenomenon favors the lifting and the separation of oil from water. During a test, samples are regularly passed through a tap at the bottom, where water is the clearest. Their oil concentration and light transmission are determined each time. Oil concentration is assessed by solvent extraction using dichloromethane and UV measurement. Concentration is evaluated using a calibration curve with original crude oil

Filtration through granular materials to remove suspended matter is an old concept. Many granular filter systems are available. Typical used media are sand, anthracite, garnet, coal, diatomaceous earth, etc. They can also be combined in different size and quantity of each filter media to meet the target requirement.
Anyhow, the most popular deep bed media filter in the oil industry is the walnut shell filter. This media is particularly suitable given its affinity for oil that is high enough to adsorb droplets during filtration, and low enough to release them during backwash. An additional advantage of walnut shells is their low density that makes them easily fluidized and scrubbed without yet being degraded.
To test deep bed filtration, a membrane filtration cell has been adapted using a stainless container instead of the glass one (cf. Figure 12). Its length is 13 cm, and its diameter is 4 cm. This allows to introduce enough granular media (2 cm of thickness- 20 g). A volume of 150 ml of produced water is forced through the media under a controlled pressure of 0.1 bar. The resulting permeation flow rate is measured with the Mettler Toledo XS1003S precision balance for 10 minutes. Water quality is measured on the final filtrate with dichloromethane extraction and UV analysis or turbidity measurement.

3. RESULTS AND DISCUSSION ON TOPSIDE RISK ASSESSMENT
OIL / WATER SEPARATION
At 74% water-cut (Table 5), the first test considered as the reference emulsion, without polymer or demulsifier, is not stable and instantaneous free water is observed mainly due to the proximity of the inversion point. The equilibrium moved towards the phase inversion as the presence of a multiple emulsion (WO and OW) was probably generated upfront. However, the oil/water separation is not complete, the water separation reaches 70% leading to a degraded oil quality with 45wt% of water content at 21h. Furthermore, the water quality seems to be very good, with 16 ppm of dispersed oil at 5h.
Table 5 Bottle-tests results with 74% water-cut. P stands for polymer concentration and D for demulsifier concentration.

The polymer improves oil/water separation but slows the creaming of the oil droplets due to the increase of the water viscosity, more at 800 ppm than at 200 ppm of polymer (1.2 cP and 0.5 cP, respectively). This leads to a slight degradation of the water quality, which remains relatively satisfactory (around 90 ppm and 200 ppm of oil for 200 ppm and 800 ppm of polymer respectively). On the other hand, the oil quality is very good with less of 0.5% of water-in-oil content, and, apparently, under the conditions of these tests without demulsifier, the residual polymer alone seems to improve the dehydration of oil.
The demulsifier was found efficient in the reference case without polymer as currently on the field: the oil/water separation is improved from 66% without demulsifier to 90% with demulsifier, at 5h (98% at 21h). The water quality in presence of demulsifier is quite similar with or without polymer, compared to an equal concentration of polymer (0, 200 or 800 ppm). However, in the presence of polymer and demulsifier, a degradation of the oil quality is observed. An interaction between the polymer and the demulsifier could be an explanation: a limited mobility of the demulsifier at the interface given the viscoelasticity of the water droplets with polymer, or a non-optimal chemical compatibility between the polymer and some demulsifier components.
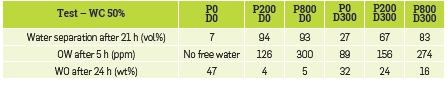
It is worth noting that a series of tests was also performed at the 50% water-cut in the same conditions (Table 6). First, the reference test (i.e., no polymer nor demulsifier) was a very stable water-in-oil emulsion with very little evolution over the testing time. However, the addition of polymer seemed to reverse the OW emulsion into a WO emulsion and consequently improved the bulk separation as in the previous case, resulting in relative clear free water after 5 h settling (126 and 300 ppm of oil respectively for 200 and 800 ppm of polymer). However, the increase of polymer concentration also has an impact on the aqueous phase quality with an observed degradation. With regard to the quality of oil, it should be noted that in the presence of polymer and, without the addition of a demulsifier, the water in oil content is significantly reduced as compared to the reference case with no polymer; it should nevertheless be noted that the 4-5% of water that remains stabilized in the oil may be more difficult to separate due to the viscoelastic properties of the water + polymer/oil interface compared to a water/oil interface,
Table 6 Bottle-tests results with 50% water-cut. P stands for polymer concentration and D for demulsifier concentration.
On the other hand, the addition of the demulsifier improves water separation without polymer even though its performance does not result in a complete separation. Moreover, as it was observed at a higher water-cut, the addition of the demulsifier in the presence of polymer results in a worse oil quality than in the case of no demulsifier addition, while the water phase quality remains quite similar in both cases. It should, therefore, be noted that a stable emulsified interface seems to persist in presence of polymer for this water-cut. This can also be explained by the presence of solids in the oil which, by placing themselves at the interfaces, also participate in stabilizing the emulsion.
To summarize that highlighted for this emulsion risk assessment, regardless of the water cut (without demulsifier), the addition of polymer improved water/oil separation at laboratory conditions, probably due to the increase in viscosity (the emulsion is more difficult to create with a defined mixing energy) and likely to the flocculent action of polymer. Water recovery is almost complete for 74% water-cut and reaches 90% for 50% water-cut. However, the polymer concentration seems not to influence water/oil separation (similar performances are observed at polymer 200 and 800 ppm), but the water phase quality is impacted anyway. In fact, the polymer slows down the creaming of oil droplets, especially when its concentration is high. Concerning the demulsifier performance, the addition of this chemical improves both phases quality without polymer addition. Nonetheless, its effect does not lead to a complete separation. Moreover, when the demulsifier is added in the presence of polymer, the oil quality is worsened with respect to the case of polymer without demulsifier. The polymer seems to interact with the demulsifier resulting in more degraded efficiency of the chemical. Therefore, to maintain optimal water/oil separation on site, it seems necessary to adjust demulsifier composition or replace the current demulsifier by an EOR compatible demulsifier.
ELECTROSTATIC OIL DEHYDRATION
One of the major concerns about dealing with polymer is equipment fouling due to polymer deposition on the electrodes. No hard deposition should be expected in such devices apart from the typical deposition caused by the interaction of the polymer and the dissolved salts in the water. In addition, the presence of polymer can also impact or impair oil/water separation even under an electromagnetic field. The impact of the polymer and the demulsifier on the oil/water separation in the presence of an electric field is shown in Figure 13. In addition, Table 7 gathers the dehydration performance of each test.
Table 7 Water-in-oil and dehydration efficiencies for water-cut 8% in presence of polymer and demulsifier.
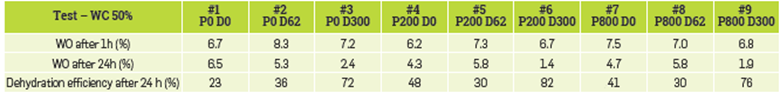

Figure 13 EST curves for water-cut 8% in presence of demulsifier and polymer: no polymer (A), 200 ppm (B), and 800 ppm (C). P stands for polymer concentration and D for demulsifier concentration.
First, we assessed the impact of the demulsifier without the addition of the polymer (tests 1 to 3). Comparing the separation kinetics of these tests in Figure 13, the addition of the demulsifier has little impact during the first 10 minutes of the tests. However, after 24 hours, a reduction of the water-in-oil is observed, which grows higher as the concentration of demulsifier is increased (see Table 7). This suggests that the selection of the incumbent demulsifier, or its dose, is not fully optimized.
Regarding the impact of the polymer, two different behaviors are observed. On the one hand, the initial critical voltage decreases with the increase of the polymer concentration, which indicates that there is either less water dispersed in the oil, or the presence of more voltage. This is logical as by increasing the polymer concentration, the viscosity of the aqueous phase is increased. On the other hand, the evolution of the critical voltage over time is also affected by the presence of polymer. In the case of 200 ppm of polymer, almost no changes of the voltage are observed, while at 800 ppm, the critical voltage drops due to the instability of the emulsion in such conditions. This is verified with measurement of the WO after 24 hours (see Table 7). In fact, the dehydration efficiency is similar with both polymer concentrations and twice as high in the case of no polymer.
Further, the combined effect of polymer and demulsifier has also been assessed. Regarding the case of 200 ppm of polymer (tests 5 and 6), there is a reduction on the initial voltage but with no further evolution over time leading to a stable emulsion as in the reference case. Even with the increase of the demulsifier concentration, no impact was observed. A similar behavior is observed in the case of 800 ppm of polymer (tests 8 and 9). The increase of the demulsifier has little impact at a low dose but, after some time. an evolution is observed at a higher rate. As previously mentioned, the demulsifier seems to take some time to show any effect. Moreover, the presence of the polymer seems to interact with the demulsifier as noted in dehydration efficiency after 24h. In fact, an increase of the demulsifier concentration is required to have an impact on the dehydration process more than in the case of only polymer present, reaching dehydration efficiencies up to 80% of water removal. A more detailed study should be performed to optimize the concentration of the demulsifier as well as the strength of the electric field to obtain the maximum efficiency at the retention time in the electro coalescer.
Finally, a higher water-cut was also tested (20%), with some issued in the presence of the polymer and the electrical field. In fact, during our tests, some filament structures build up have been observed between the electrodes when polymeric solutions and higher water-cuts were used (see Figure 14). These continuous strings can be a problem for the applied electric field, disturbing the measure as the voltage oscillated randomly. One hypothesis for this structure build-up is the alignment of water droplets in the presence of the electric field, which are deformed due to the viscoelastic properties of the polymeric solution resulting in the formation of this kind of structures.

PRECIPITATION AND HEATER FOULING
ASSESSMENT OF THE POLYMER PRECIPITATION RISK
No polymer precipitation was observed in the cloud point unit at 77 °C for the two brines tested: 100% Injection water and 50% Injection-50% Produced water. In both cases, the solution remains clear for 5 hours of heating at 77 °C (Figure 15), visually indicating the absence of polymer precipitation under these conditions. In addition, the evolution of conductivity and viscosity (Figure 16) at 200 s-1 for each step and each hour of heating confirm the visual observation as the conductivity and the viscosity do not evolve with heating.
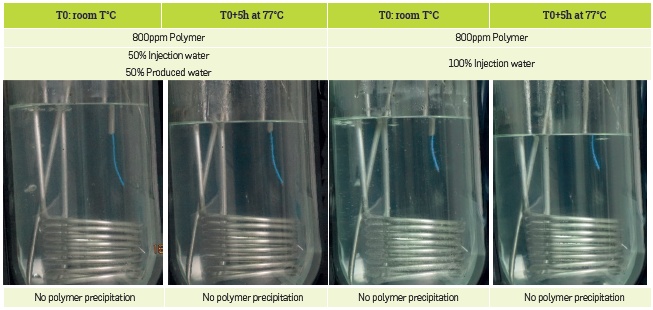
Figure 15 Visual observations of the cloud point tests at room temperature and after 5h of heating time at 77°C.
ASSESSMENT OF THE FOULING RISK
First, no polymer precipitation was observed for the aqueous phase tests in the Heater Fouling unit at high temperature (149 °C) and under pressure (23 bar) (Figure 17 left), thus confirming the results obtained in the transparent set-up.
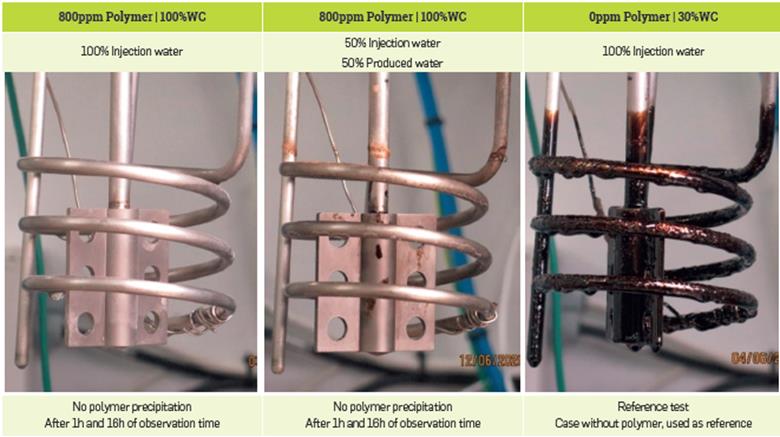
Figure 17 Heater Fouling results in presence of aqueous phase only (To investigate the risk of polymer precipitation under pressure and higher temperature than Cloud point unit tests) [left]; Heater fouling result for the reference case: without polymer
Second, no fouling effects were observed for all tests involving brine from the Yariguí field. Without any doubt, no sticky, gelatinous, or granular deposits were observed in the reactor or in the heating pipe (Figure 18), which appears to be in a similar condition as in the reference case: test without polymer (Figure 17 right). The heating pipe requires the same cleaning effort as if only crude oil was present without polymer (Figure 17 right).

As the Heater Fouling unit operates in batch mode, we decided to test more severe conditions than those in the field to promote the fouling phenomena and consider the risk of an accumulation effect withing the exchangers (dead zones). Hence, the M/D ratio has been reduced to 3 to promote the bridging effect and the water-cut has been increased to 80% as a continuous aqueous phase is more likely to generate fouling than a continuous oil phase. Even when testing more severe conditions than those in the field (Figure 18), no fouling phenomena were observed, proving the robustness of the results. For the sake of reliability, longer tests have been conducted (15h of heating time) to replicate long-term operating conditions and showed no fouling either.
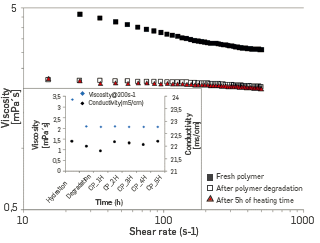
For information purposes, the viscosity as a function of the shear rate is shown in Figure 19 for the three stages of a heater fouling test, namely Fresh polymer, after emulsion (and degradation), and after heating, which gives some insight of the polymer degradation process in the heater fouling unit. Consequently, this test-campaign is a good indication of the low risk of fouling under the experimental conditions of the Yariguí field. Nonetheless, it should be borne in mind that the Heater fouling unit operates in batch mode and does not exactly mimic the operation of a real exchanger with a continuous flow and sometimes variable conditions.

WATER TREATMENT
The mother emulsion prepared with Yariguí crude oil has been analysed with laser diffraction after dilution. Results are shown in Figure 20. They display a satisfactory monodisperse distribution with an average diameter of 4-5 pm. An optical microscopy was also performed to confirm the oil droplet size. The preparation of synthetic production water at 200 ppm oil is shown as an example in this paragraph. The same procedure is carried out regardless of the desired oil content, by changing the requested mother emulsion amount to incorporate.

A small amount of the mother emulsion (0.286 g) is poured into 1 L of Yariguí synthetic brine or polymer solution (500 ppm of HPAM polymer to get synthetic produced waters with an oil content of 200 ppm). The mother emulsion is poured and mixed by gentle manual shaking. This caution enables to maintain the initial size of oil droplets and does not further mechanically degrade macromolecular chains. An example of synthetic produced waters is shown in Figure 21. It was confirmed that oil droplets distribution of mother emulsion and produced water remains the same.
During flooding operations, the polymer is subjected to a severe mechanical effort that might degrade it as compared to its original molecular weight and viscosifying properties. To consider this phenomenon, two kinds of produced water with polymer were prepared:
one with an intact polymer that was only subjected to gentle stirring for its dissolving,
one with a polymer solution that was passed through the contraction of the API apparatus RP63 at 8 bars, which decreased its viscosity by 20% (cf. Figure 22).

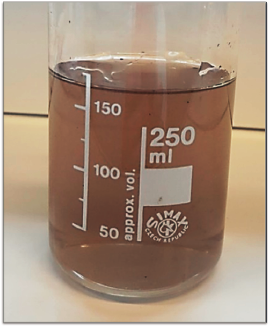
To simulate the creaming of oil droplets during the storage of produced water (PW) in pools, samples of produced water were left at 40 °C for 8 hours in an oven and in the Turbiscan lab. The experiments were conducted with the following compositions:
PW containing 1,000 ppm of crude oil without clarifier (as in field),
PW P (500 ppm of polymer) containing 1,000 ppm of crude oil without clarifier,
PW Pdeg (500 ppm of polymer - 20% loss viscosity) containing 1,000 ppm of crude oil without clarifier.
A picture of each sample was taken after 24 hours and the concentration of residual oil was assessed in the middle of each beaker (cf. Figure 23). In all cases, the oil content has significantly decreased and shows the efficiency of time in pools. It is much lower than the initial oil concentration of 1,000 ppm. The residual oil concentration is close to 100 ppm (consistent with field data) for PW and reaches roughly 300 ppm in the presence of polymer (intact and degraded).

Figure 23 Oil residual contents of samples after 8 hours of rest at 40°C, a= PW, b= PW with degraded polymer, c= PW with intact
The presence of polymer, even if degraded, slows down the rising of oil droplets and stays in pool should last longer to improve water quality. Kinetics of clarification obtained with the Turbiscan Lab are consistent with this remark. They can be calculated by the light transmission evolving in the different cases (cf. Figure 24). When plotted as a function of the inverse of viscosity of continuous phases, a straight line is obtained, as expected with Stokes's law (cf. Figure 25).
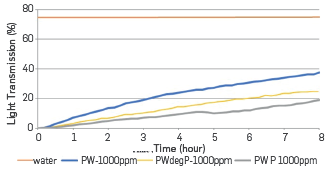
Figure 24 Average light transmission of samples as a function of time, clear water is taken as a reference (red line).
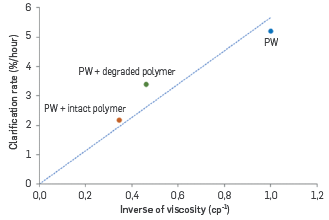
Figure 25 Kinetics of clarification as a function of the inverse of the viscosity of the continuous phase (3 conditions: brine, polymer solution, degraded polymer solution).
The long-term gravity separation tests were repeated with a concentration of crude oil of 2000 ppm instead of 1,000 ppm. This led to the same previous observations with a decrease in efficiency of oil removal in the presence of intact and degraded polymer.
After this storage, produced waters still contain tiny oil droplets that rise more slowly than the bigger ones. To regain efficiency, is it common to add water clarifiers that are expected to coagulate and flocculate oil droplets making them bigger and easier to separate. Jar tests are usually performed to screen such additives.
The water clarifier planned for Yariguí case was tested with and without polymer (500 ppm intact polymer) and oil droplets (100 and 200 ppm). Different clarifier concentrations were applied (6 and 206 ppm). At lab scale, the highest ones were necessary for the successful appearance of oily flocs. These flocs were still visualized in presence of polymer but with additional precipitates probably resulting from the interactions between anionic polymer and cationic coagulant contained in the water clarifier. All pictures are shown in Figure 26.

As mentioned in the introduction, gravitational removal of oil droplets can be strongly favoured by the introduction of gas bubbles in produced waters. In this method, called induced gas flotation, the injected bubbles attach to oil droplets, release them, and accelerate their rise. The produced waters containing either 100 or 300 ppm of crude oil were treated based on this principle with a lab flotation column. Tests were performed with a given air flow rate (200 L/h) with different compositions: with or without polymer, with or without clarifier. All results were superimposed on the same graph (cf. Figure 27). This shows that oil removal is quite efficient with flotation, but should last longer in the presence of polymer, even if it is degraded. Its viscosifying properties slow down the rising of bubbles and impede their attachment to the oil droplets. The clarifier (6 ppm) did not fasten the creaming of oil droplets and seemed to even worsen the situation in the presence of polymer.

Deep bed filtration belongs to the tertiary treatment and addresses produced water with the lowest content of crude oil for a polishing step. It was tested for the Yariguí case with samples of 50 ppm of crude oil in different aqueous phases: with or without polymer, with or without clarifier. The media is composed of pre-washed walnut shell. Results are gathered in Figure 28.

Filtration is highly efficient to remove oil droplets. Water quality is very good, and no fouling was observed. In the presence of polymer, a significant decrease in filtration rate is provoked due to higher viscosity, but water quality remains good. This decrease is reinforced by the simultaneous presence of polymer and clarifier that precipitate together.
■ CONCLUSIONS
A new experimental methodology was developed based on the fluid treatment conditions in the Yariguí-Cantagallo field, the objective being to be as representative of the site as possible. Experimental designs were set according to the range of expected operational conditions and the different stages of the current field process. At laboratory scale, the polymer improved the kinetics of water/ oil separation, but the quality of the water phase was degraded especially at high polymer concentrations. Oil quality remained good, even without demulsifier, but was worsened in the presence of polymer, suggesting incompatibility between the polymer and the incumbent demulsifier.
No fouling effect related to hot surfaces was observed for all tests since no sticky, gelatinous, or granular deposits were observed in the reactor or in the heating pipe under these experimental conditions. Consequently, this test-campaign suggests a low risk of fouling under the experimental conditions of the Yariguí field.
Regarding the water treatment assessment, first, the polymer affected the gravitational oil/water separation in relation with the viscosity increase and Stokes' law. However, the polymer did not impede the clarification effect since small oily flocs were still visible when the coagulant was added at high concentration. Second, the polymer, even if degraded, slowed down flotation action probably due to the increase in viscosity and steric hindrance, with macromolecules affecting the bonding between oil droplets and bubbles. Finally, filtration was highly efficient to remove oil droplets, as water quality was very good and no fouling on the walnut shells was observed. In the presence of polymer, a significant decrease in the filtration rate occurred due to higher viscosity, although the water quality remained good. Such decrease was reinforced by the simultaneous presence of the polymer and water clarifier, which precipitated together.
This experimental study, conducted with tools and conditions representative of the Yariguí field, highlights the need to use EOR compliant chemicals (demulsifier and water clarifier) to maintain efficient fluid treatment in the presence of residual polymer. This also allowed to anticipate possible adjustments in the treatment process, such as more frequent backwashing of nutshells in the presence of polymer. Anticipating and identifying key parameters at the laboratory scale and implementing them on site will certainly increase the chances of successful polymer injection at the Yariguí field.

